Putnam County Investment Properties for Sale
Browse homes for sale and investment properties in Putnam County. Refine your search by price, property type, or more.
Best cash flowing properties in Putnam County
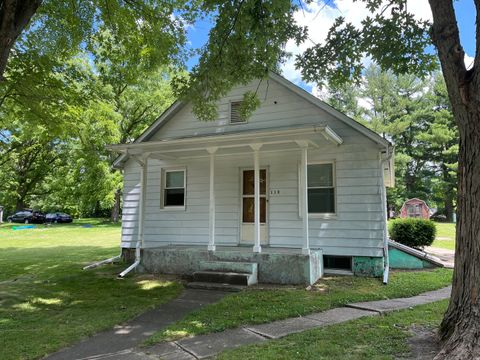
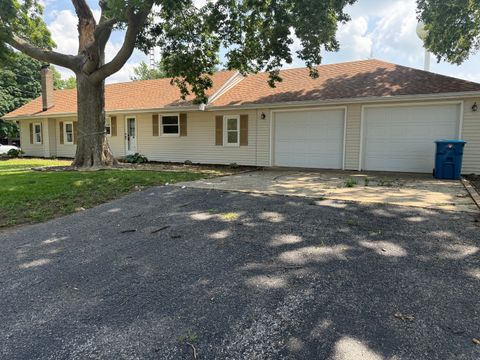
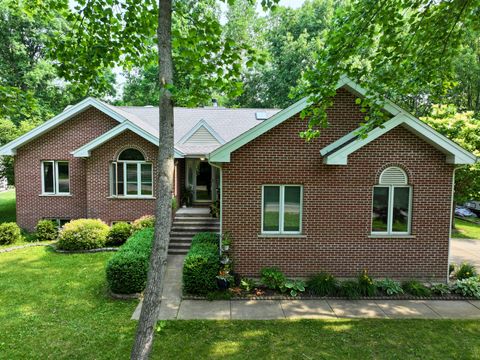
Active
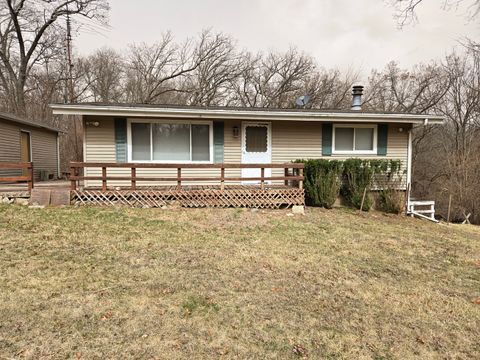
$79,000
2
bds
|
1
ba
|
912
sqft
|
built
1900
113 3rd St, Mark, IL 61340
$128
Cash flow
8.5%
Cash-on-Cash Return
7.6%
Cap rate
1.3%
Rent to Value Ratio
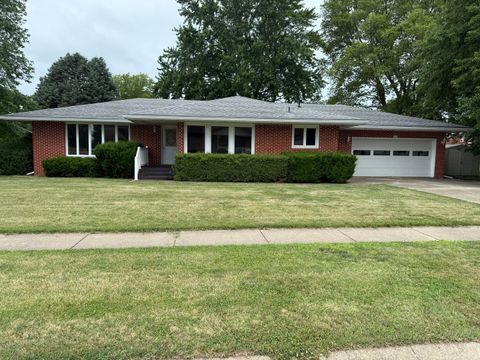
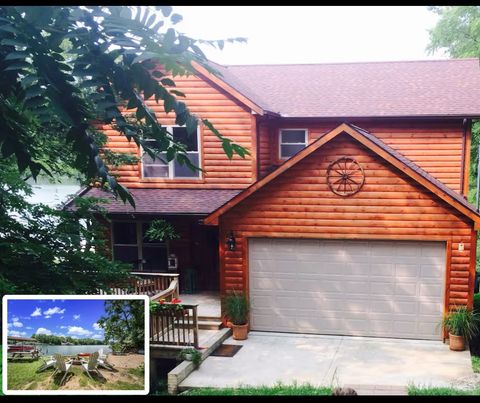
Active
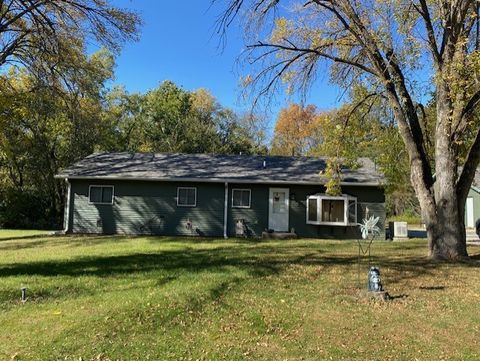
$235,000
3
bds
|
2
ba
|
1,646
sqft
|
built
1970
227 S 6th St, Hennepin, IL 61327
$-8
Cash flow
-0.2%
Cash-on-Cash Return
5.6%
Cap rate
0.9%
Rent to Value Ratio
16 out of 18 properties for sale in Putnam County
Limited Results Shown
Create a free account, or log in to reveal all property listings and enjoy the complete experience.
Active
$159,900
2
bds
|
1
ba
|
1,200
sqft
|
built
1975
19 Navajo Ct, Putnam, IL 61560
$-25
Cash flow
-0.8%
Cash-on-Cash Return
5.5%
Cap rate
0.9%
Rent to Value Ratio
Active
$199,999
3
bds
|
2
ba
|
1,600
sqft
|
built
2009
3 Poplar Ct, Putnam, IL 61560
$-340
Cash flow
-8.9%
Cash-on-Cash Return
3.6%
Cap rate
0.9%
Rent to Value Ratio
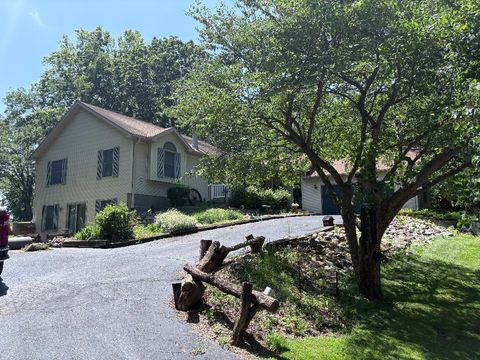
Active
$110,000
2
bds
|
1
ba
|
1,144
sqft
|
built
1950
126 N 8th St, Hennepin, IL 61327
$-16
Cash flow
-0.8%
Cash-on-Cash Return
5.5%
Cap rate
1.0%
Rent to Value Ratio
Active
$645,000
3
bds
|
3
ba
|
2,469
sqft
|
built
2013
6 Barbados Ct N, Putnam, IL 61560
$-2,983
Cash flow
-24.1%
Cash-on-Cash Return
0.1%
Cap rate
0.2%
Rent to Value Ratio
Active
$309,900
3
bds
|
2
ba
|
1,870
sqft
|
built
50 Barbados Dr, Putnam, IL 61560
$-967
Cash flow
-16.3%
Cash-on-Cash Return
1.9%
Cap rate
0.5%
Rent to Value Ratio
Active
$179,000
3
bds
|
2
ba
|
1,050
sqft
|
built
2003
11 Cedar Ln N, Putnam, IL 61560
$-152
Cash flow
-4.4%
Cash-on-Cash Return
4.7%
Cap rate
0.8%
Rent to Value Ratio
Active
$329,900
3
bds
|
3
ba
|
1,703
sqft
|
built
2004
3 Wood Ct, Putnam, IL 61560
$-808
Cash flow
-12.8%
Cash-on-Cash Return
2.7%
Cap rate
0.6%
Rent to Value Ratio
Active
$239,000
3
bds
|
2
ba
|
1,288
sqft
|
built
2000
1 Wherry Dr, Putnam, IL 61560
$-563
Cash flow
-12.3%
Cash-on-Cash Return
2.9%
Cap rate
0.6%
Rent to Value Ratio
Active
$525,000
3
bds
|
2
ba
|
1,100
sqft
|
built
22 Cedar Ln S, Putnam, IL 61560
$-2,011
Cash flow
-20.0%
Cash-on-Cash Return
1.1%
Cap rate
0.3%
Rent to Value Ratio
Active
$479,900
4
bds
|
4
ba
|
2,792
sqft
|
built
1978
20 Chairtree Ct, Putnam, IL 61560
$-1,994
Cash flow
-21.7%
Cash-on-Cash Return
0.7%
Cap rate
0.4%
Rent to Value Ratio
Active
$165,000
2
bds
|
1
ba
|
800
sqft
|
built
81 Indian Hills Dr, Putnam, IL 61560
$-195
Cash flow
-6.2%
Cash-on-Cash Return
4.3%
Cap rate
0.7%
Rent to Value Ratio
Active
$125,000
2
bds
|
1
ba
|
720
sqft
|
built
1974
4 Malibu Dr, Putnam, IL 61560
$-205
Cash flow
-8.6%
Cash-on-Cash Return
3.7%
Cap rate
0.7%
Rent to Value Ratio
Active
$339,000
4
bds
|
3
ba
|
1,400
sqft
|
built
2006
8 Birch Dr, Putnam, IL 61560
$-760
Cash flow
-11.7%
Cash-on-Cash Return
3.0%
Cap rate
0.5%
Rent to Value Ratio
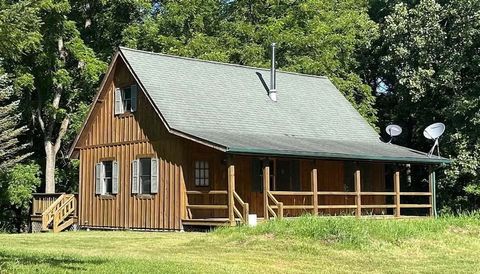
Active
$184,900
4
bds
|
1
ba
|
1,850
sqft
|
built
1974
7 Clearwater Pt, Putnam, IL 61560
$-134
Cash flow
-3.8%
Cash-on-Cash Return
4.8%
Cap rate
0.9%
Rent to Value Ratio