Tazewell County Investment Properties for Sale
Browse homes for sale and investment properties in Tazewell County. Refine your search by price, property type, or more.
Best cash flowing properties in Tazewell County
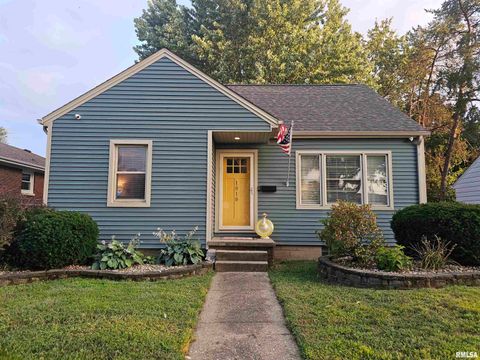
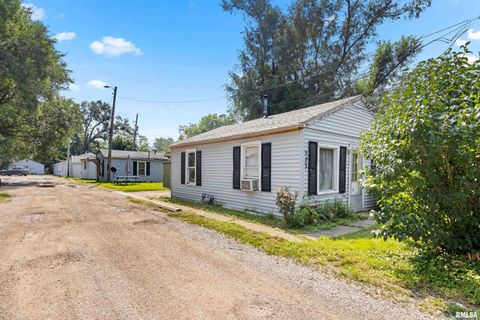
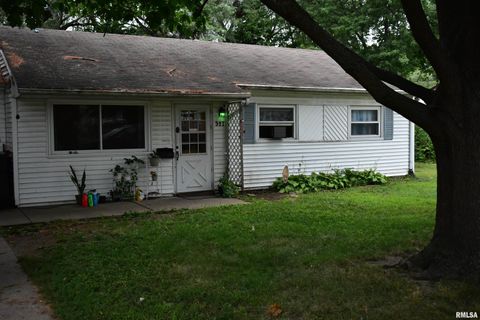
Active
$60,000
3
bds
|
1
ba
|
1,632
sqft
|
built
1948
2217 Springfield Rd, East Peoria, IL 61611
$1,085
Cash flow
21.1%
Cash-on-Cash Return
21.7%
Cap rate
3.0%
Rent to Value Ratio
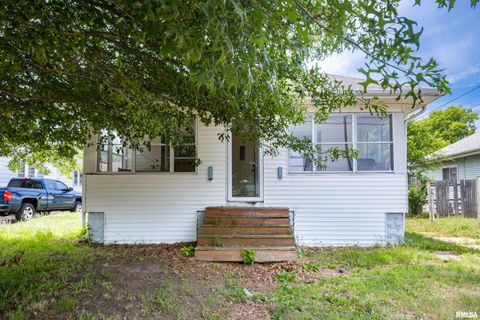
Active
$27,500
3
bds
|
2
ba
|
1,520
sqft
|
built
1907
231 Cooper St, Pekin, IL 61554
$1,002
Cash flow
42.5%
Cash-on-Cash Return
43.7%
Cap rate
5.5%
Rent to Value Ratio
87 out of 93 properties for sale in Tazewell County
Limited Results Shown
Create a free account, or log in to reveal all property listings and enjoy the complete experience.
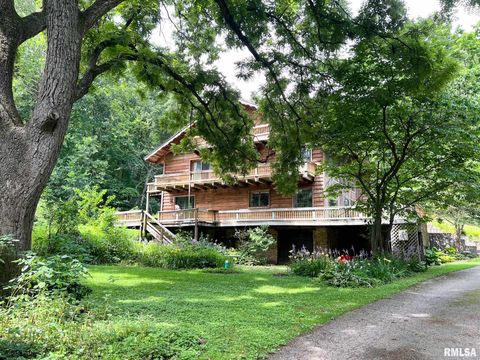
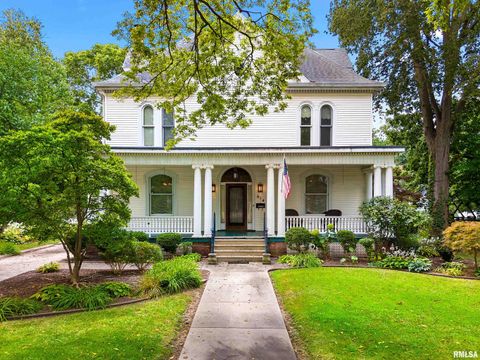
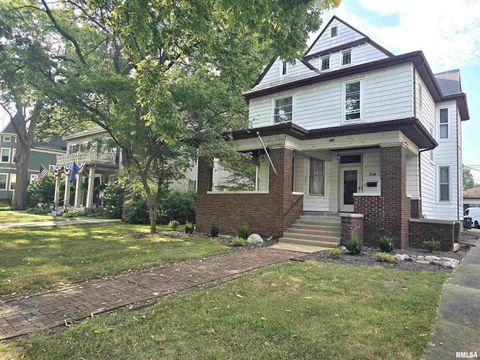
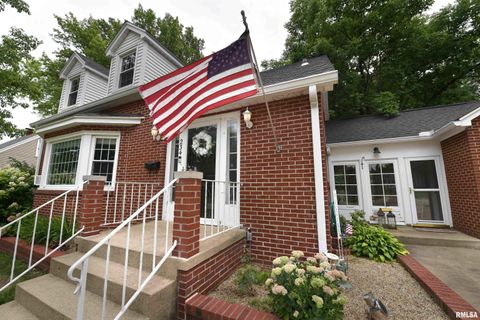
Active
$194,900
3
bds
|
2
ba
|
2,340
sqft
|
built
1847
304 Buena Vista Ave, Pekin, IL 61554
$-11
Cash flow
-0.3%
Cash-on-Cash Return
5.6%
Cap rate
0.8%
Rent to Value Ratio

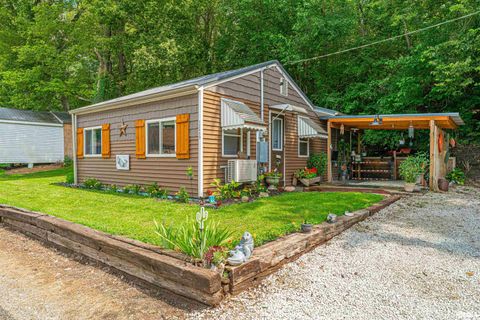
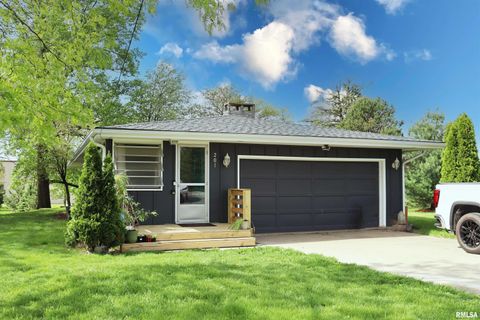
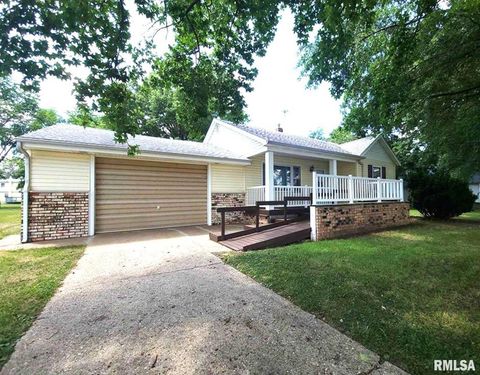
Active
$29,900
2
bds
|
1
ba
|
1,328
sqft
|
built
1938
116 N Church St, Green Valley, IL 61534
$631
Cash flow
24.6%
Cash-on-Cash Return
25.3%
Cap rate
3.7%
Rent to Value Ratio
Active
$389,000
4
bds
|
3
ba
|
1,520
sqft
|
built
1853
105 W C St, Delavan, IL 61734
$-824
Cash flow
-11.1%
Cash-on-Cash Return
3.1%
Cap rate
0.5%
Rent to Value Ratio
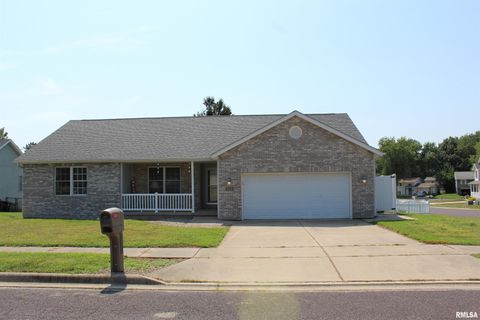
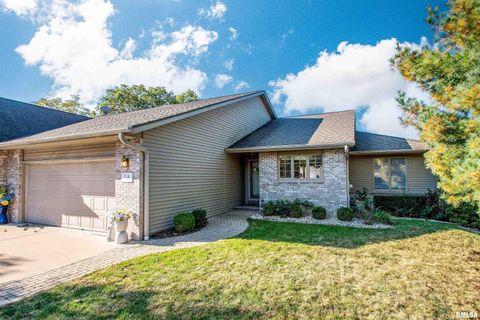
Active
$225,000
3
bds
|
2
ba
|
1,396
sqft
|
built
1978
801 Heritage Dr, Mackinaw, IL 61755
$-252
Cash flow
-5.8%
Cash-on-Cash Return
4.3%
Cap rate
0.7%
Rent to Value Ratio
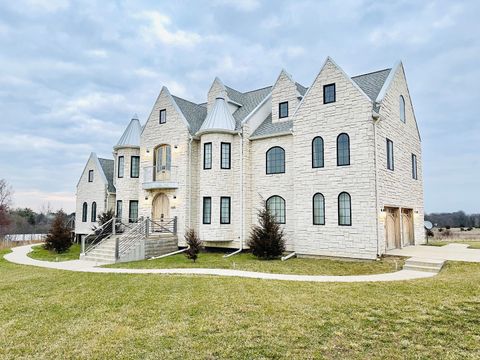
Active
$950,000
5
bds
|
5
ba
|
5,802
sqft
|
built
2018
16810 Springfield Rd, Pekin, IL 61554
$-3,184
Cash flow
-17.5%
Cash-on-Cash Return
1.7%
Cap rate
0.4%
Rent to Value Ratio

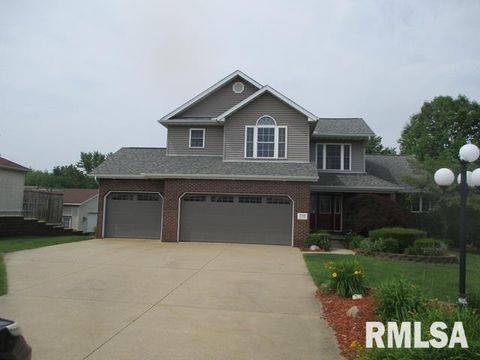
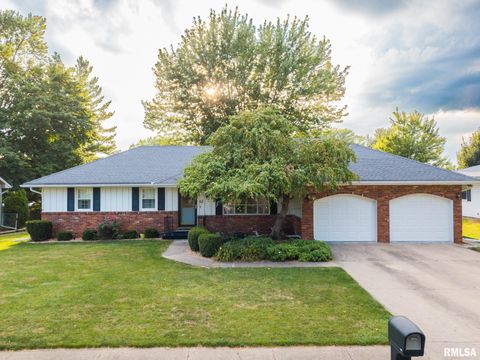
Active
$449,900
4
bds
|
3
ba
|
2,400
sqft
|
built
1975
394 Circle Shore Dr, Washington, IL 61571
$-1,309
Cash flow
-15.2%
Cash-on-Cash Return
2.2%
Cap rate
0.6%
Rent to Value Ratio
Active
$105,000
3
bds
|
1
ba
|
1,660
sqft
|
built
1977
10333 Evergreen Dr, Manito, IL 61546
$340
Cash flow
16.9%
Cash-on-Cash Return
9.6%
Cap rate
1.2%
Rent to Value Ratio

Active
$114,900
3
bds
|
1
ba
|
1,023
sqft
|
built
1976
132 N Mc Arthur Dr, North Pekin, IL 61554
$220
Cash flow
10.0%
Cash-on-Cash Return
8.0%
Cap rate
1.1%
Rent to Value Ratio

Active
$434,990
4
bds
|
4
ba
|
4,042
sqft
|
built
2002
1508 Oak Rdg, Washington, IL 61571
$-990
Cash flow
-11.9%
Cash-on-Cash Return
2.9%
Cap rate
0.6%
Rent to Value Ratio

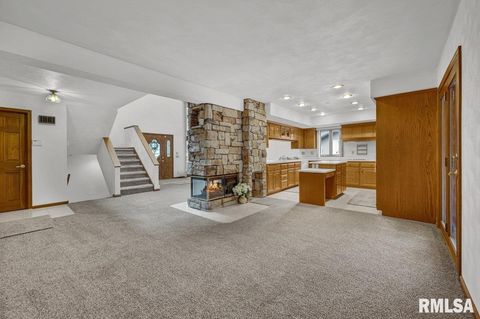
Active
$325,000
3
bds
|
2
ba
|
3,303
sqft
|
built
1979
106 Windridge Dr, Washington, IL 61571
$-93
Cash flow
-1.5%
Cash-on-Cash Return
5.3%
Cap rate
0.8%
Rent to Value Ratio
Active
$274,900
3
bds
|
2
ba
|
2,532
sqft
|
built
1912
1448 Park Ave, Pekin, IL 61554
$90
Cash flow
1.7%
Cash-on-Cash Return
6.1%
Cap rate
0.9%
Rent to Value Ratio
Active
$189,900
4
bds
|
2
ba
|
2,131
sqft
|
built
1952
1010 Irene St, Pekin, IL 61554
$88
Cash flow
2.4%
Cash-on-Cash Return
6.2%
Cap rate
0.9%
Rent to Value Ratio
Active
$45,000
3
bds
|
1
ba
|
912
sqft
|
built
1929
211 Minch St, South Pekin, IL 61564
$691
Cash flow
17.9%
Cash-on-Cash Return
18.4%
Cap rate
2.7%
Rent to Value Ratio
Active
$764,900
5
bds
|
4
ba
|
4,698
sqft
|
built
1949
305 E Martin Dr, Goodfield, IL 61742
$-2,056
Cash flow
-14.0%
Cash-on-Cash Return
2.5%
Cap rate
0.3%
Rent to Value Ratio
Active
$80,000
1
bds
|
1
ba
|
556
sqft
|
built
1950
12450 Sunset Dr, Manito, IL 61546
$144
Cash flow
9.4%
Cash-on-Cash Return
7.8%
Cap rate
1.0%
Rent to Value Ratio

Active
$335,000
5
bds
|
4
ba
|
2,456
sqft
|
built
1900
200 S Chestnut St, Tremont, IL 61568
$-423
Cash flow
-6.6%
Cash-on-Cash Return
4.2%
Cap rate
0.7%
Rent to Value Ratio
Active
$389,990
5
bds
|
3
ba
|
3,538
sqft
|
built
1966
1021 E Madison St, Morton, IL 61550
$-791
Cash flow
-10.6%
Cash-on-Cash Return
3.2%
Cap rate
0.6%
Rent to Value Ratio
Active
$355,000
3
bds
|
3
ba
|
3,816
sqft
|
built
2007
1414 S Missouri Ave, Morton, IL 61550
$-502
Cash flow
-7.4%
Cash-on-Cash Return
4.0%
Cap rate
0.7%
Rent to Value Ratio
Active
$139,900
3
bds
|
3
ba
|
1,598
sqft
|
built
1973
412 Kerfoot St, East Peoria, IL 61611
$26
Cash flow
1.0%
Cash-on-Cash Return
5.9%
Cap rate
1.0%
Rent to Value Ratio
Active
$284,900
6
bds
|
0
ba
|
0
sqft
|
built
1974
101 Patricia Ave, East Peoria, IL 61611
$-393
Cash flow
-7.2%
Cash-on-Cash Return
4.0%
Cap rate
0.8%
Rent to Value Ratio
Active
$334,900
4
bds
|
5
ba
|
4,112
sqft
|
built
1880
614 Washington St, Pekin, IL 61554
$-954
Cash flow
-14.9%
Cash-on-Cash Return
2.3%
Cap rate
0.6%
Rent to Value Ratio
Active
$385,000
5
bds
|
4
ba
|
2,785
sqft
|
built
1999
3708 Bloomington Rd, East Peoria, IL 61611
$-870
Cash flow
-11.8%
Cash-on-Cash Return
3.0%
Cap rate
0.6%
Rent to Value Ratio
Active
$447,900
4
bds
|
3
ba
|
3,159
sqft
|
built
1989
1220 S Main St, Morton, IL 61550
$-801
Cash flow
-9.3%
Cash-on-Cash Return
3.5%
Cap rate
0.6%
Rent to Value Ratio

Active
$220,000
5
bds
|
3
ba
|
3,152
sqft
|
built
1972
125 Calumet Rd, Marquette Heights, IL 61554
$405
Cash flow
9.6%
Cash-on-Cash Return
7.9%
Cap rate
1.1%
Rent to Value Ratio
Active
$794,000
3
bds
|
2
ba
|
1,416
sqft
|
built
1960
201 Willa Ln, Washington, IL 61571
$-2,733
Cash flow
-18.0%
Cash-on-Cash Return
1.5%
Cap rate
0.2%
Rent to Value Ratio
Active
$325,000
3
bds
|
0
ba
|
0
sqft
|
built
1948
523 Sanford St, East Peoria, IL 61611
$-1,333
Cash flow
-21.4%
Cash-on-Cash Return
0.8%
Cap rate
0.2%
Rent to Value Ratio
Active
$169,000
5
bds
|
2
ba
|
2,464
sqft
|
built
1894
704 Washington St, Pekin, IL 61554
$235
Cash flow
7.3%
Cash-on-Cash Return
7.3%
Cap rate
1.1%
Rent to Value Ratio
Active
$164,500
2
bds
|
1
ba
|
1,242
sqft
|
built
1953
12927 State Route 29, Pekin, IL 61554
$-62
Cash flow
-2.0%
Cash-on-Cash Return
5.2%
Cap rate
0.7%
Rent to Value Ratio
Active
$264,900
3
bds
|
3
ba
|
3,256
sqft
|
built
2004
1713 Hope Ct, Pekin, IL 61554
$-403
Cash flow
-7.9%
Cash-on-Cash Return
3.9%
Cap rate
0.8%
Rent to Value Ratio
Active
$88,900
3
bds
|
1
ba
|
864
sqft
|
built
1960
321 Arrow St, Pekin, IL 61554
$298
Cash flow
17.5%
Cash-on-Cash Return
9.7%
Cap rate
1.5%
Rent to Value Ratio

Active
$277,900
4
bds
|
2
ba
|
2,580
sqft
|
built
1972
7711 Linden Ln, Delavan, IL 61734
$-204
Cash flow
-3.8%
Cash-on-Cash Return
4.8%
Cap rate
0.8%
Rent to Value Ratio

Active
$179,900
3
bds
|
2
ba
|
1,304
sqft
|
built
1970
105 E 9th St, Delavan, IL 61734
$-226
Cash flow
-6.6%
Cash-on-Cash Return
4.2%
Cap rate
0.6%
Rent to Value Ratio

Active
$194,900
3
bds
|
1
ba
|
2,208
sqft
|
built
1966
412 Elmhurst Dr, Washington, IL 61571
$48
Cash flow
1.3%
Cash-on-Cash Return
6.0%
Cap rate
0.9%
Rent to Value Ratio
Active
$269,900
4
bds
|
3
ba
|
1,974
sqft
|
built
1952
234 E Edgewood St, Morton, IL 61550
$-124
Cash flow
-2.4%
Cash-on-Cash Return
5.1%
Cap rate
0.8%
Rent to Value Ratio
Active
$339,000
4
bds
|
3
ba
|
3,214
sqft
|
built
2005
7 Country Club Ct, Pekin, IL 61554
$-853
Cash flow
-13.1%
Cash-on-Cash Return
2.7%
Cap rate
0.6%
Rent to Value Ratio
Active
$230,000
3
bds
|
2
ba
|
2,098
sqft
|
built
1974
2107 Sierra Dr, Pekin, IL 61554
$-206
Cash flow
-4.7%
Cash-on-Cash Return
4.6%
Cap rate
0.8%
Rent to Value Ratio
Active
$64,900
2
bds
|
1
ba
|
660
sqft
|
built
1917
208 Fayette St, Pekin, IL 61554
$612
Cash flow
11.0%
Cash-on-Cash Return
11.3%
Cap rate
1.5%
Rent to Value Ratio

Active
$179,500
bds
|
1
ba
|
200
sqft
|
built
2019
6670 Bass Rd, Manito, IL 61546
$-356
Cash flow
-10.3%
Cash-on-Cash Return
3.3%
Cap rate
0.5%
Rent to Value Ratio