Whiteside County Investment Properties for Sale
Browse homes for sale and investment properties in Whiteside County. Refine your search by price, property type, or more.
Best cash flowing properties in Whiteside County
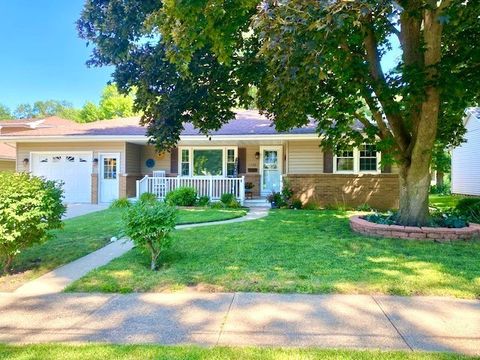
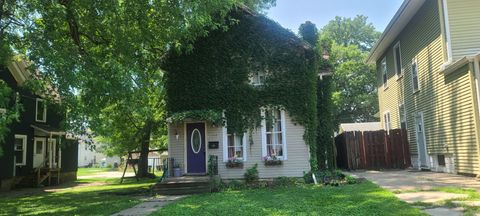
Active
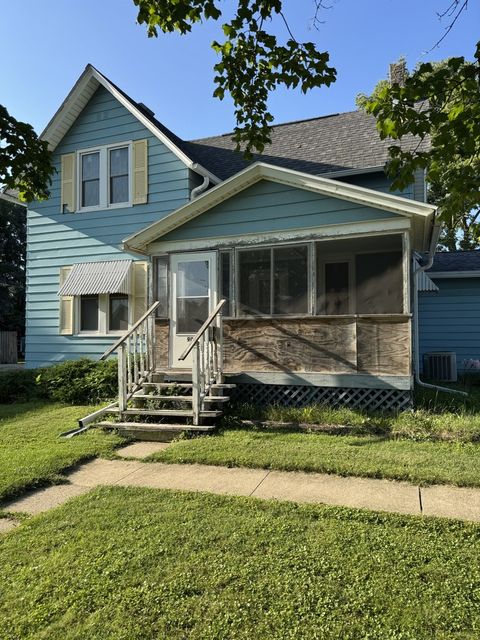
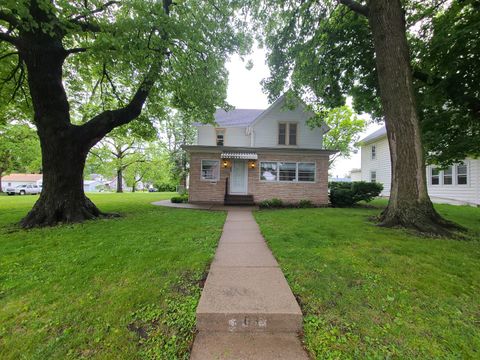
$68,900
4
bds
|
2
ba
|
1,529
sqft
|
built
1970
903 W 7th St, Sterling, IL 61081
$770
Cash flow
13.0%
Cash-on-Cash Return
13.4%
Cap rate
1.9%
Rent to Value Ratio
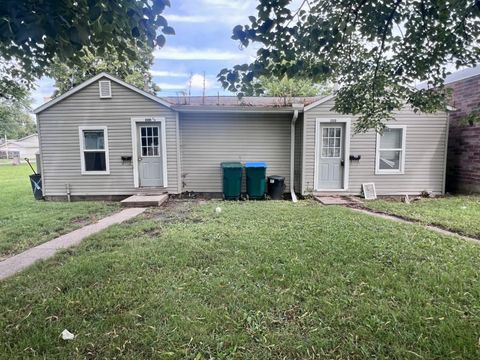
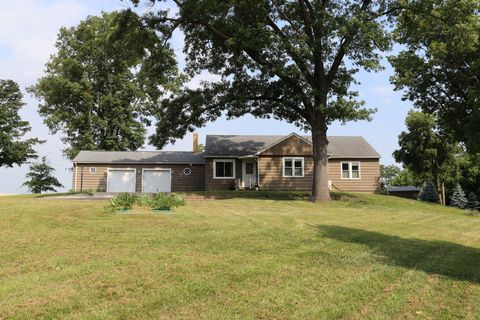
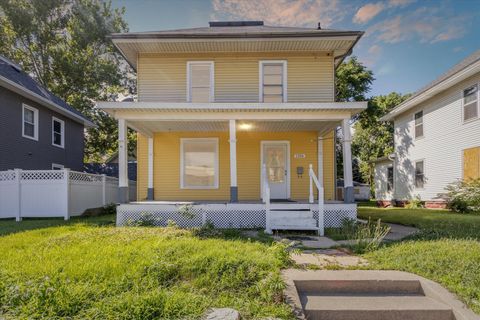
Active
$65,000
2
bds
|
2
ba
|
0
sqft
|
built
200 W 13th St, Rock Falls, IL 61071
$761
Cash flow
13.6%
Cash-on-Cash Return
14.0%
Cap rate
2.0%
Rent to Value Ratio
59 out of 91 properties for sale in Whiteside County
Limited Results Shown
Create a free account, or log in to reveal all property listings and enjoy the complete experience.
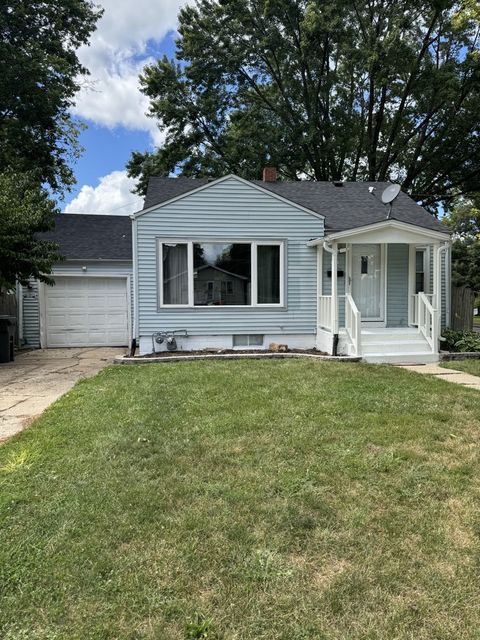
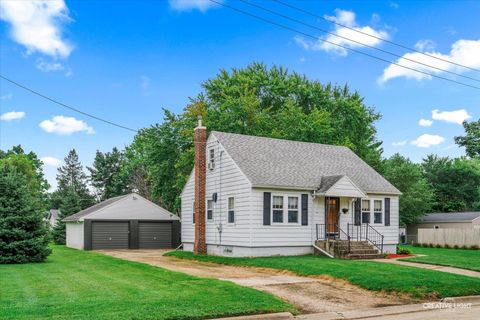
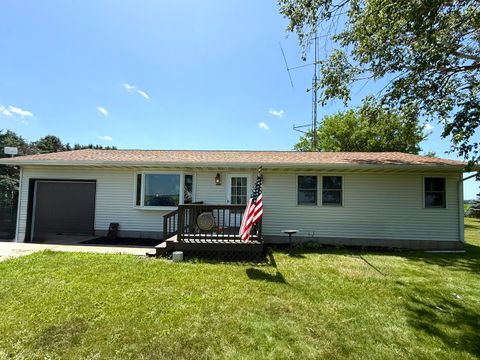
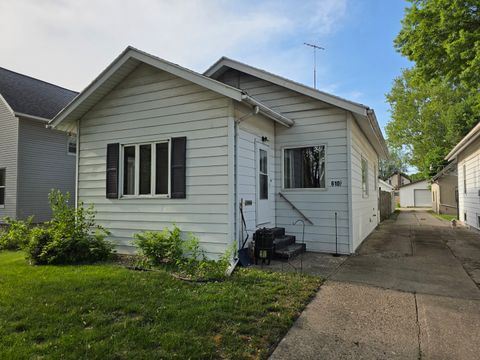
Active
$93,000
2
bds
|
1
ba
|
811
sqft
|
built
1950
1111 Avenue J, Sterling, IL 61081
$194
Cash flow
10.9%
Cash-on-Cash Return
8.2%
Cap rate
1.3%
Rent to Value Ratio
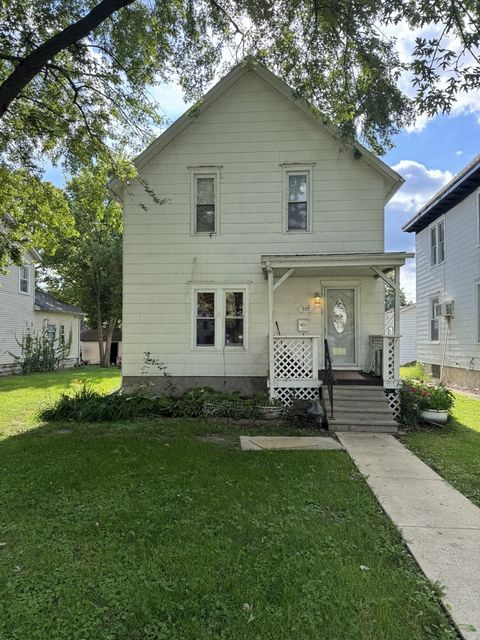
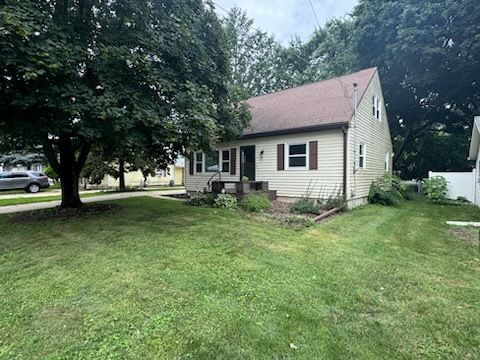
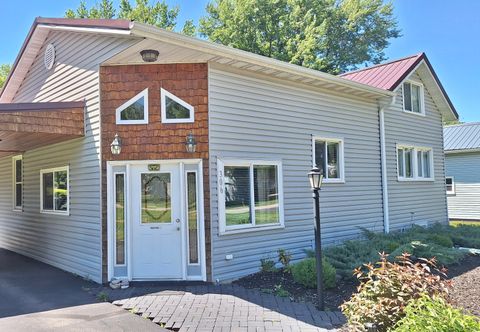
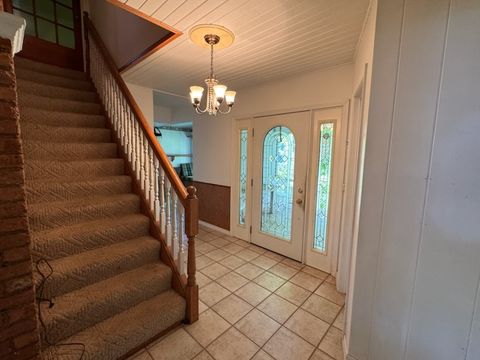
Active
$108,900
4
bds
|
2
ba
|
1,460
sqft
|
built
1900
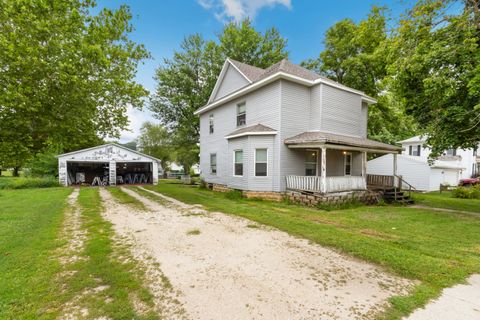
505 6th Ave, Sterling, IL 61081
$314
Cash flow
15.0%
Cash-on-Cash Return
9.1%
Cap rate
1.4%
Rent to Value Ratio
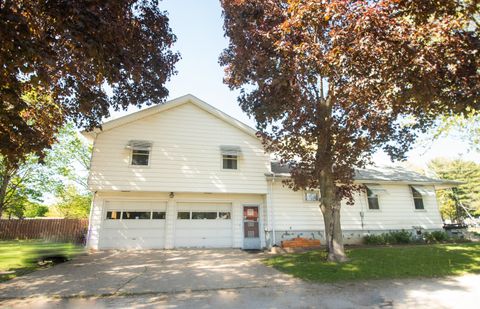
Active
$79,900
4
bds
|
2
ba
|
1,836
sqft
|
built
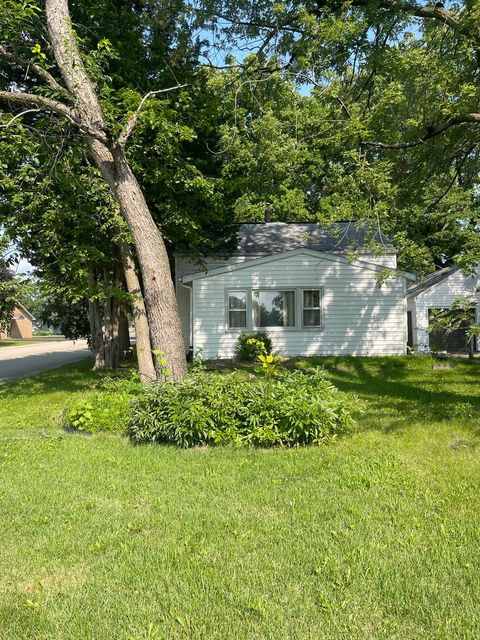
210 N Main St, Tampico, IL 61283
$584
Cash flow
38.1%
Cash-on-Cash Return
14.4%
Cap rate
1.9%
Rent to Value Ratio
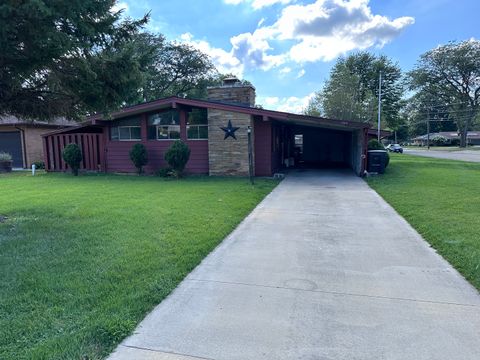
Active
$95,000
3
bds
|
1
ba
|
1,174
sqft
|
built
1957
1723 Avenue D, Sterling, IL 61081
$170
Cash flow
9.3%
Cash-on-Cash Return
7.8%
Cap rate
1.5%
Rent to Value Ratio
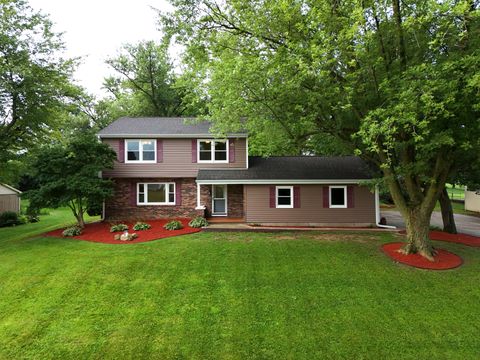
Active
$339,900
3
bds
|
3
ba
|
2,144
sqft
|
built
1974
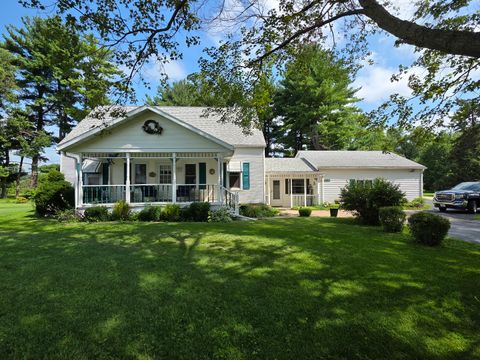
24049 Hillcrest Dr, Sterling, IL 61081
$-753
Cash flow
-11.6%
Cash-on-Cash Return
3.0%
Cap rate
0.5%
Rent to Value Ratio
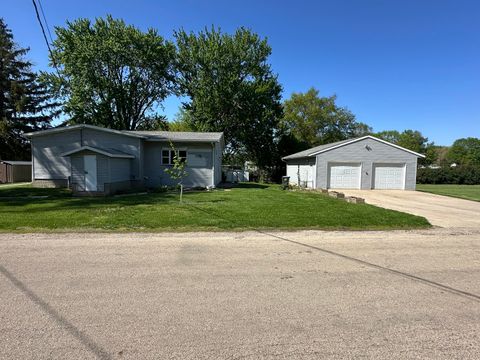
Active
$125,000
3
bds
|
2
ba
|
1,459
sqft
|
built
1954
1610 W 9th St, Sterling, IL 61081
$217
Cash flow
9.1%
Cash-on-Cash Return
7.8%
Cap rate
1.0%
Rent to Value Ratio
Active
$199,900
2
bds
|
2
ba
|
1,206
sqft
|
built
1970
1106 W 5th St, Rock Falls, IL 61071
$-76
Cash flow
-2.0%
Cash-on-Cash Return
5.2%
Cap rate
0.8%
Rent to Value Ratio
Active
$229,900
4
bds
|
2
ba
|
1,730
sqft
|
built
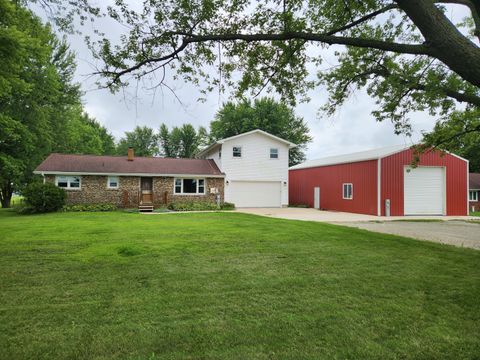
2707 W Rock Falls Rd, Rock Falls, IL 61071
$-287
Cash flow
-6.5%
Cash-on-Cash Return
4.2%
Cap rate
0.7%
Rent to Value Ratio
Active
$145,000
3
bds
|
1
ba
|
1,140
sqft
|
built
1948
1716 17th Ave, Sterling, IL 61081
$110
Cash flow
4.0%
Cash-on-Cash Return
6.6%
Cap rate
1.0%
Rent to Value Ratio
Active
$164,900
4
bds
|
2
ba
|
1,425
sqft
|
built
1970
1827 2nd Ave, Sterling, IL 61081
$-103
Cash flow
-3.3%
Cash-on-Cash Return
4.9%
Cap rate
1.0%
Rent to Value Ratio
Active
$94,900
3
bds
|
1
ba
|
1,211
sqft
|
built
1938
1824 16th Ave, Sterling, IL 61081
$220
Cash flow
12.1%
Cash-on-Cash Return
8.5%
Cap rate
1.4%
Rent to Value Ratio
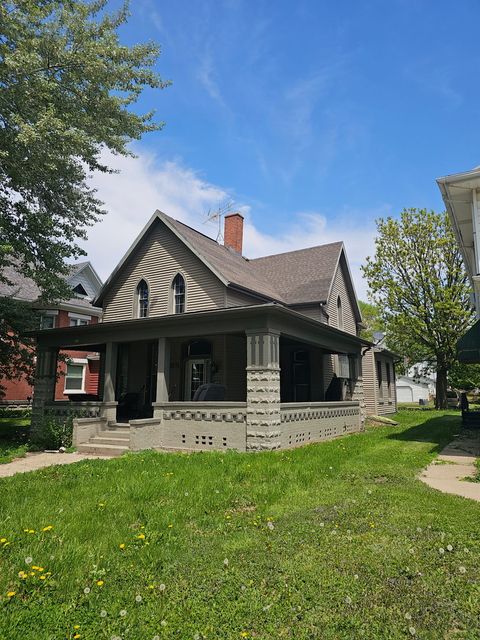
Active
$78,000
3
bds
|
2
ba
|
2,150
sqft
|
built
1890
608 2nd Ave, Sterling, IL 61081
$581
Cash flow
38.9%
Cash-on-Cash Return
14.6%
Cap rate
2.2%
Rent to Value Ratio
Active
$169,900
3
bds
|
1
ba
|
1,594
sqft
|
built
1970
908 Wiker Dr, Rock Falls, IL 61071
$-77
Cash flow
-2.4%
Cash-on-Cash Return
5.1%
Cap rate
0.8%
Rent to Value Ratio

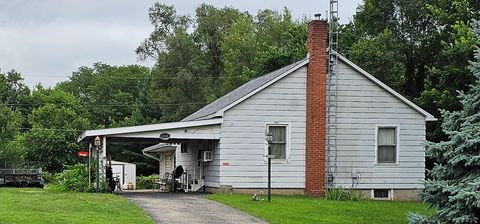
Active
$59,500
2
bds
|
1
ba
|
846
sqft
|
built
1920
903 3rd Ave, Sterling, IL 61081
$675
Cash flow
13.2%
Cash-on-Cash Return
13.6%
Cap rate
1.7%
Rent to Value Ratio
Active
$272,500
3
bds
|
2
ba
|
1,914
sqft
|
built
1960
17150 Timber Dr, Sterling, IL 61081
$-527
Cash flow
-10.1%
Cash-on-Cash Return
3.4%
Cap rate
0.7%
Rent to Value Ratio
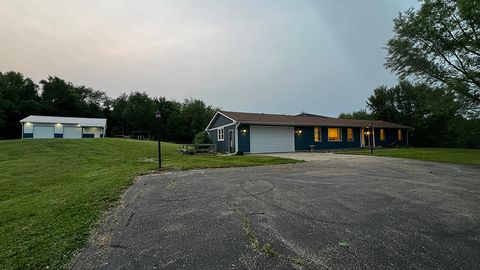
Active
$325,000
3
bds
|
2
ba
|
2,040
sqft
|
built
1960
24455 Fulfs Rd, Sterling, IL 61081
$-869
Cash flow
-14.0%
Cash-on-Cash Return
2.5%
Cap rate
0.5%
Rent to Value Ratio
Active
$129,900
3
bds
|
1
ba
|
1,064
sqft
|
built
1910
505 E 4th St, Rock Falls, IL 61071
$134
Cash flow
5.4%
Cash-on-Cash Return
6.9%
Cap rate
1.0%
Rent to Value Ratio
Active
$350,000
5
bds
|
5
ba
|
3,392
sqft
|
built
1880
644 Genesee Ave, Morrison, IL 61270
$-727
Cash flow
-10.8%
Cash-on-Cash Return
3.2%
Cap rate
0.6%
Rent to Value Ratio
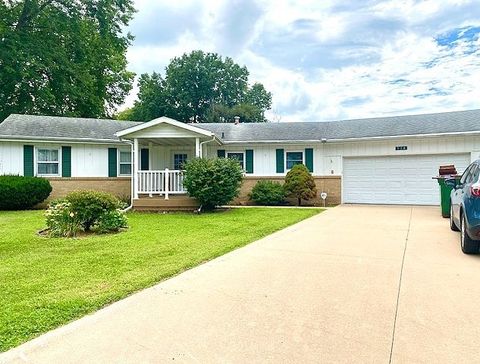
Active
$119,900
2
bds
|
2
ba
|
1,300
sqft
|
built
2019
3307 B St, Rock Falls, IL 61071
$256
Cash flow
11.1%
Cash-on-Cash Return
8.2%
Cap rate
1.1%
Rent to Value Ratio
Active
$225,000
4
bds
|
2
ba
|
1,872
sqft
|
built
1946
4404 Emerson Rd, Sterling, IL 61081
$-260
Cash flow
-6.0%
Cash-on-Cash Return
4.3%
Cap rate
0.6%
Rent to Value Ratio

Active
$85,000
4
bds
|
2
ba
|
1,800
sqft
|
built
1920
721 Broadway Ave, Sterling, IL 61081
$319
Cash flow
19.6%
Cash-on-Cash Return
10.2%
Cap rate
1.5%
Rent to Value Ratio
Active
$130,000
2
bds
|
2
ba
|
900
sqft
|
built
1954
3408 A St, Rock Falls, IL 61071
$180
Cash flow
7.2%
Cash-on-Cash Return
7.3%
Cap rate
1.1%
Rent to Value Ratio
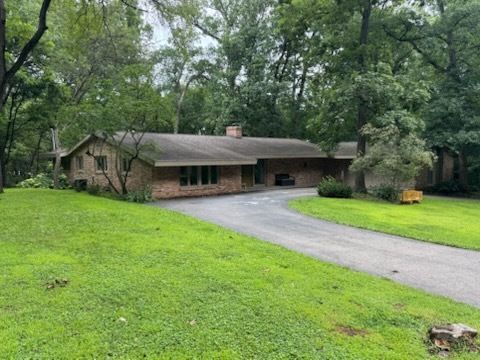
Active
$550,000
3
bds
|
3
ba
|
2,693
sqft
|
built
1978
15501 Bishop Rd, Morrison, IL 61270
$-1,663
Cash flow
-15.8%
Cash-on-Cash Return
2.1%
Cap rate
0.4%
Rent to Value Ratio
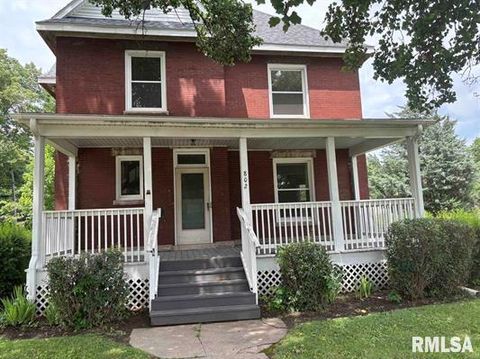
Active
$225,000
5
bds
|
2
ba
|
2,732
sqft
|
built
1821
802 W 4th St, Sterling, IL 61081
$288
Cash flow
6.7%
Cash-on-Cash Return
7.2%
Cap rate
1.0%
Rent to Value Ratio
Active
$106,500
3
bds
|
1
ba
|
1,970
sqft
|
built
1900
109 6th Ave, Sterling, IL 61081
$249
Cash flow
12.2%
Cash-on-Cash Return
8.5%
Cap rate
1.2%
Rent to Value Ratio
Active
$105,000
3
bds
|
3
ba
|
1,800
sqft
|
built
1932
1304 E 4th St, Sterling, IL 61081
$271
Cash flow
13.5%
Cash-on-Cash Return
8.8%
Cap rate
1.2%
Rent to Value Ratio
Active
$180,000
3
bds
|
1
ba
|
1,056
sqft
|
built
1966
31535 E Thome Rd, Rock Falls, IL 61071
$-132
Cash flow
-3.8%
Cash-on-Cash Return
4.8%
Cap rate
0.8%
Rent to Value Ratio
Active
$135,000
2
bds
|
1
ba
|
1,546
sqft
|
built
1950
306 N Joy St, Tampico, IL 61283
$184
Cash flow
7.1%
Cash-on-Cash Return
7.3%
Cap rate
1.0%
Rent to Value Ratio
Active
$98,000
3
bds
|
1
ba
|
1,636
sqft
|
built
1908
603 7th Ave, Sterling, IL 61081
$312
Cash flow
16.6%
Cash-on-Cash Return
9.5%
Cap rate
1.3%
Rent to Value Ratio
Active
$77,500
2
bds
|
1
ba
|
832
sqft
|
built
1923
610 1/2 W 7th St, Sterling, IL 61081
$153
Cash flow
10.3%
Cash-on-Cash Return
8.1%
Cap rate
1.4%
Rent to Value Ratio
Active
$349,000
3
bds
|
2
ba
|
1,875
sqft
|
built
110 Martin Rd, Rock Falls, IL 61071
$-1,076
Cash flow
-16.1%
Cash-on-Cash Return
2.0%
Cap rate
0.4%
Rent to Value Ratio
Active
$146,000
3
bds
|
2
ba
|
1,915
sqft
|
built
1948
1807 3rd Ave, Sterling, IL 61081
$258
Cash flow
9.2%
Cash-on-Cash Return
7.8%
Cap rate
1.2%
Rent to Value Ratio
Active
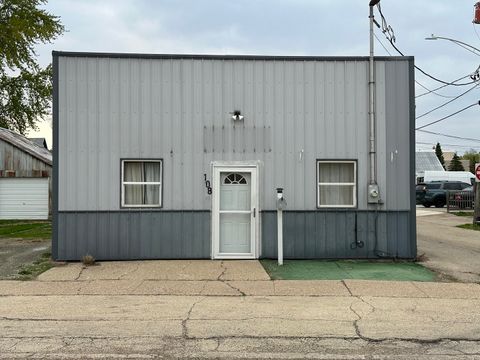
$84,900
2
bds
|
1
ba
|
2,132
sqft
|
built
1975
108 W Railroad St, Prophetstown, IL 61277
$416
Cash flow
25.6%
Cash-on-Cash Return
11.6%
Cap rate
1.5%
Rent to Value Ratio
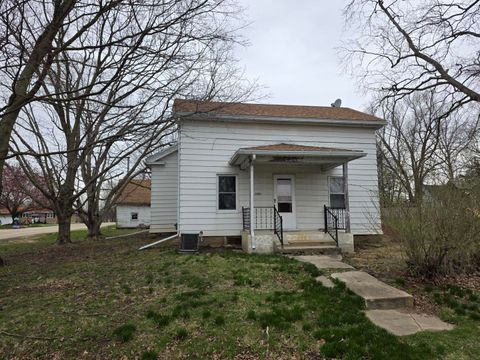
Active
$29,700
3
bds
|
1
ba
|
1,554
sqft
|
built
1930
513 E 3rd St, Prophetstown, IL 61277
$585
Cash flow
22.9%
Cash-on-Cash Return
23.6%
Cap rate
3.7%
Rent to Value Ratio
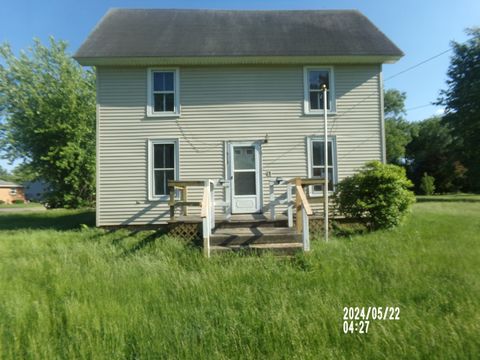
Active
$74,900
3
bds
|
1
ba
|
1,728
sqft
|
built
1900
2203 Deets Rd, Sterling, IL 61081
$742
Cash flow
11.5%
Cash-on-Cash Return
11.9%
Cap rate
1.7%
Rent to Value Ratio
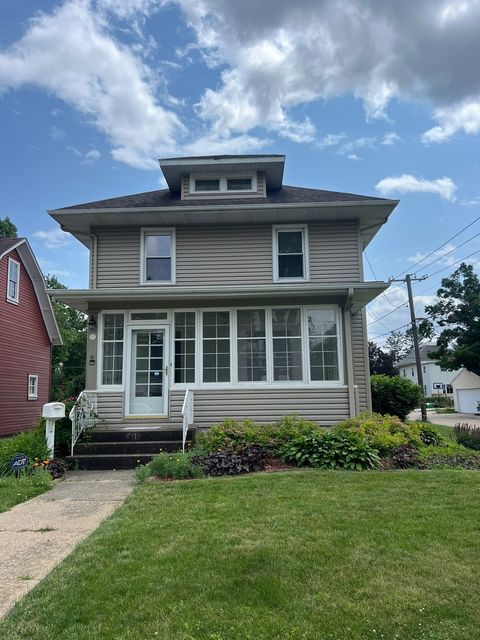
Active
$225,000
3
bds
|
3
ba
|
2,028
sqft
|
built
1916
211 W 13th St, Sterling, IL 61081
$-276
Cash flow
-6.4%
Cash-on-Cash Return
4.2%
Cap rate
0.8%
Rent to Value Ratio
Active
$149,900
3
bds
|
2
ba
|
1,790
sqft
|
built
1900
408 9th Ave, Sterling, IL 61081
$187
Cash flow
6.5%
Cash-on-Cash Return
7.2%
Cap rate
1.1%
Rent to Value Ratio
Active
$104,000
4
bds
|
3
ba
|
2,048
sqft
|
built
1915
105 6th Ave, Sterling, IL 61081
$490
Cash flow
24.6%
Cash-on-Cash Return
11.3%
Cap rate
1.5%
Rent to Value Ratio