Woodford County Investment Properties for Sale
Browse homes for sale and investment properties in Woodford County. Refine your search by price, property type, or more.
Best cash flowing properties in Woodford County
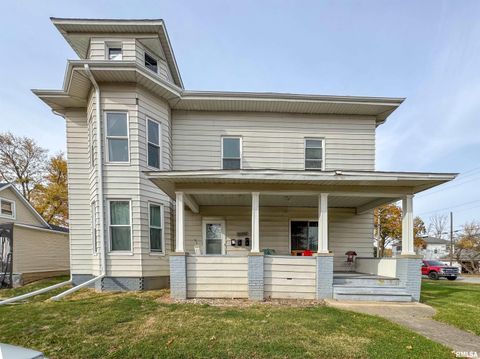
Active
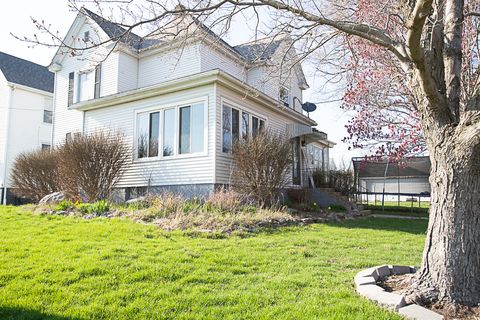
$169,000
3
bds
|
3
ba
|
1,328
sqft
|
built
1908
393 E Front St, El Paso, IL 61738
$274
Cash flow
8.5%
Cash-on-Cash Return
7.6%
Cap rate
1.1%
Rent to Value Ratio
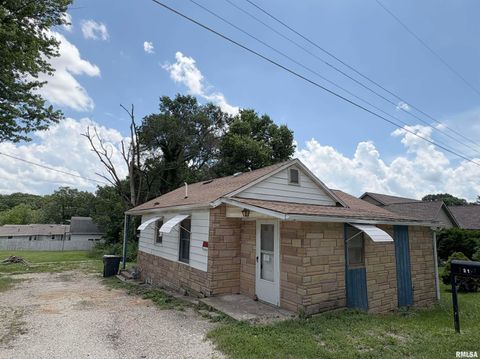
Active
$79,900
2
bds
|
1
ba
|
1,001
sqft
|
built
1938
210 Murphy Ln, Metamora, IL 61548
$199
Cash flow
13.0%
Cash-on-Cash Return
9.2%
Cap rate
1.5%
Rent to Value Ratio
21 out of 23 properties for sale in Woodford County
Limited Results Shown
Create a free account, or log in to reveal all property listings and enjoy the complete experience.
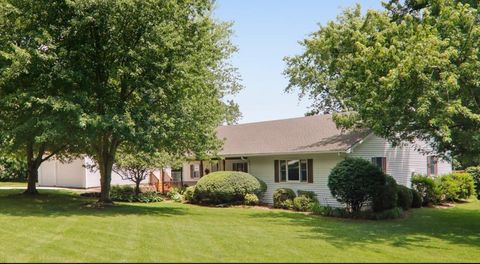
Active
$365,000
3
bds
|
2
ba
|
3,350
sqft
|
built
1989
308 1st South St, Kappa, IL 61738
$-1,410
Cash flow
-20.2%
Cash-on-Cash Return
1.0%
Cap rate
0.4%
Rent to Value Ratio

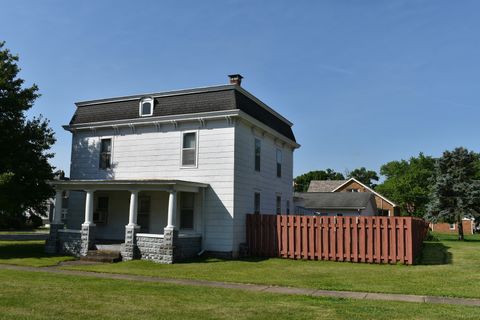
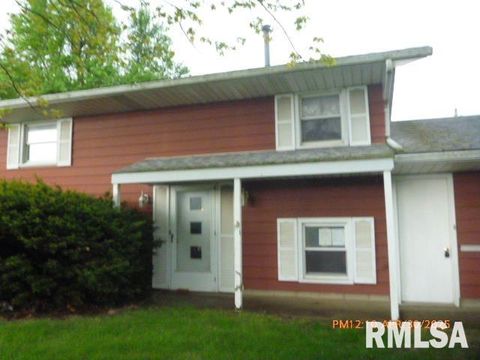
Active
$134,900
2
bds
|
1
ba
|
948
sqft
|
built
1921
110 E Van Alstine St, Secor, IL 61771
$54
Cash flow
2.1%
Cash-on-Cash Return
6.2%
Cap rate
1.0%
Rent to Value Ratio
Active
$115,000
5
bds
|
2
ba
|
2,016
sqft
|
built
1900
207 State St, Benson, IL 61516
$175
Cash flow
7.9%
Cash-on-Cash Return
7.5%
Cap rate
1.0%
Rent to Value Ratio
Active
$260,000
4
bds
|
3
ba
|
3,628
sqft
|
built
1919
546 Elmwood Ct, El Paso, IL 61738
$150
Cash flow
3.0%
Cash-on-Cash Return
6.4%
Cap rate
0.8%
Rent to Value Ratio

Active
$169,000
4
bds
|
3
ba
|
1,680
sqft
|
built
1900
307 N Meek St, Eureka, IL 61530
$38
Cash flow
1.2%
Cash-on-Cash Return
6.0%
Cap rate
0.9%
Rent to Value Ratio

Active
$325,000
5
bds
|
2
ba
|
3,314
sqft
|
built
1869
405 S Darst St, Eureka, IL 61530
$-173
Cash flow
-2.8%
Cash-on-Cash Return
5.0%
Cap rate
0.8%
Rent to Value Ratio
Active
$159,900
2
bds
|
1
ba
|
1,152
sqft
|
built
2000
1309 N Woodland Ln, Metamora, IL 61548
$-202
Cash flow
-6.6%
Cash-on-Cash Return
4.2%
Cap rate
0.7%
Rent to Value Ratio

Active
$860,000
5
bds
|
4
ba
|
5,659
sqft
|
built
2016
28 Briarwood Ln, Metamora, IL 61548
$-3,443
Cash flow
-20.9%
Cash-on-Cash Return
0.9%
Cap rate
0.4%
Rent to Value Ratio
Active
$219,900
4
bds
|
2
ba
|
2,034
sqft
|
built
1950
505 S Davenport St, Metamora, IL 61548
$-550
Cash flow
-13.0%
Cash-on-Cash Return
3.2%
Cap rate
0.5%
Rent to Value Ratio
Active
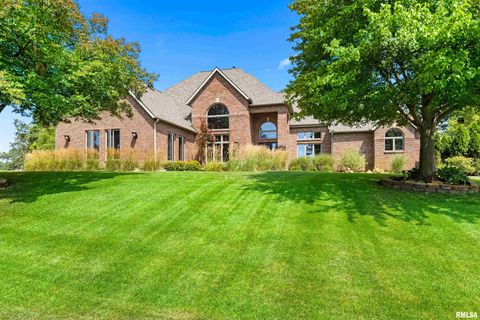
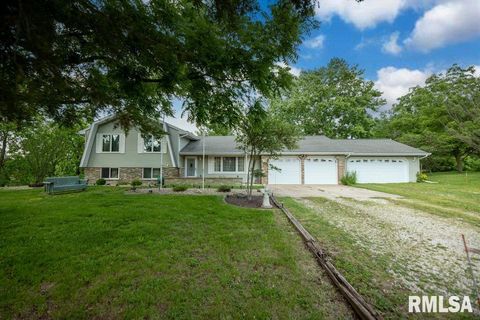
$289,900
3
bds
|
3
ba
|
3,045
sqft
|
built
1991
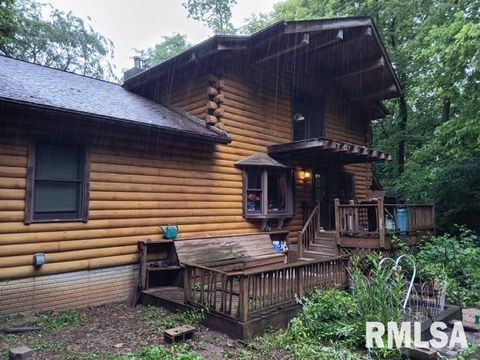
504 Highview Rdg, Washburn, IL 61570
$-378
Cash flow
-6.8%
Cash-on-Cash Return
4.1%
Cap rate
0.7%
Rent to Value Ratio
Active
$775,000
5
bds
|
5
ba
|
4,606
sqft
|
built
1995
2844 Saint Andrews Ct, El Paso, IL 61738
$-2,120
Cash flow
-14.3%
Cash-on-Cash Return
2.4%
Cap rate
0.5%
Rent to Value Ratio
Active
$200,000
bds
|
0
ba
|
0
sqft
|
built
1920
734 Locust St, Minonk, IL 61760
$-2
Cash flow
-0.1%
Cash-on-Cash Return
5.7%
Cap rate
0.9%
Rent to Value Ratio

Active
$500,000
5
bds
|
3
ba
|
3,828
sqft
|
built
1989
283 Old Germantown Rd, East Peoria, IL 61611
$-603
Cash flow
-6.3%
Cash-on-Cash Return
4.2%
Cap rate
0.6%
Rent to Value Ratio
Active
$119,900
3
bds
|
2
ba
|
1,968
sqft
|
built
1970
1007 N Church St, Roanoke, IL 61561
$-149
Cash flow
-6.5%
Cash-on-Cash Return
4.2%
Cap rate
0.8%
Rent to Value Ratio
Active
$599,000
5
bds
|
4
ba
|
5,373
sqft
|
built
1996
702 Mayfair Ct, Germantown Hills, IL 61548
$-2,756
Cash flow
-24.0%
Cash-on-Cash Return
0.2%
Cap rate
0.2%
Rent to Value Ratio
Active
$269,900
2
bds
|
2
ba
|
1,492
sqft
|
built
1997
130 Zimmerman Rd, Spring Bay, IL 61611
$-890
Cash flow
-17.2%
Cash-on-Cash Return
1.7%
Cap rate
0.5%
Rent to Value Ratio
Active
$329,900
3
bds
|
3
ba
|
2,709
sqft
|
built
1978
386 Townhall Rd, Metamora, IL 61548
$-1,289
Cash flow
-20.4%
Cash-on-Cash Return
1.5%
Cap rate
0.4%
Rent to Value Ratio
Active
$224,900
3
bds
|
1
ba
|
1,405
sqft
|
built
1954
1229 Sunset Dr, East Peoria, IL 61611
$-770
Cash flow
-17.9%
Cash-on-Cash Return
1.6%
Cap rate
0.6%
Rent to Value Ratio
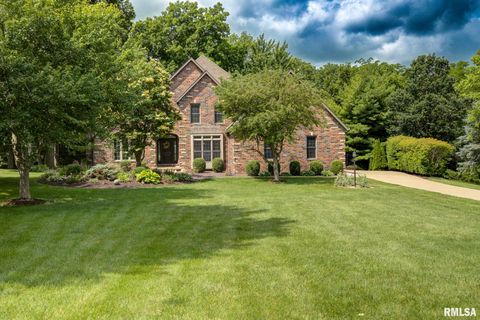
Active
$284,900
3
bds
|
2
ba
|
2,104
sqft
|
built
1967
1536 Hickory Point Rd, Metamora, IL 61548
$-425
Cash flow
-7.8%
Cash-on-Cash Return
4.4%
Cap rate
0.7%
Rent to Value Ratio