Illinois Investment Properties for Sale
Browse homes for sale and investment properties in Illinois. Refine your search by price, property type, or more.
Best cash flowing properties in Illinois
Active
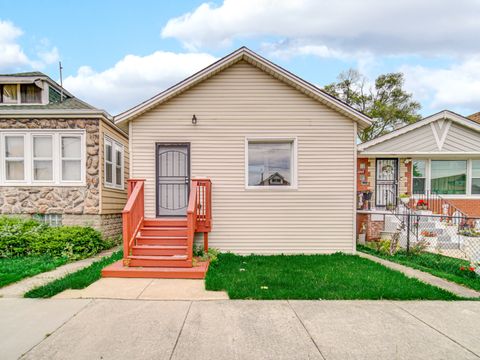
$127,700
2
bds
|
1
ba
|
861
sqft
|
built
1917
7245 S Honore St, Chicago, IL 60636
$575
Cash flow
23.5%
Cash-on-Cash Return
11.7%
Cap rate
1.4%
Rent to Value Ratio

Active
$245,000
3
bds
|
2
ba
|
1,106
sqft
|
built
1952
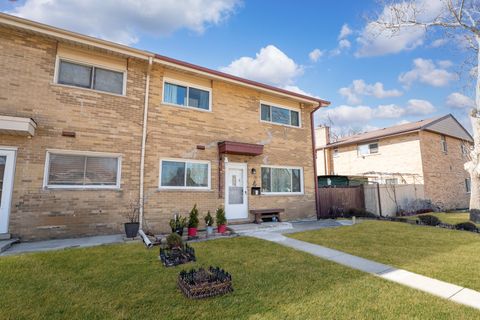
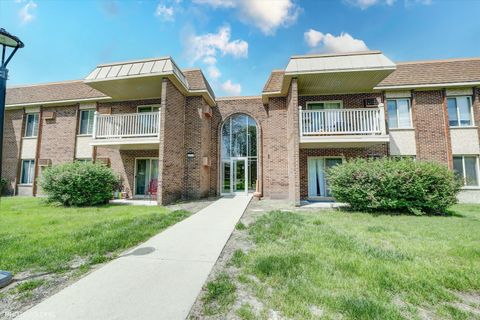
224 Meadow Ln, Lake Zurich, IL 60047
$325
Cash flow
6.9%
Cash-on-Cash Return
7.3%
Cap rate
1.0%
Rent to Value Ratio
9,345 out of 17,412 properties for sale in Illinois
Limited Results Shown
Create a free account, or log in to reveal all property listings and enjoy the complete experience.
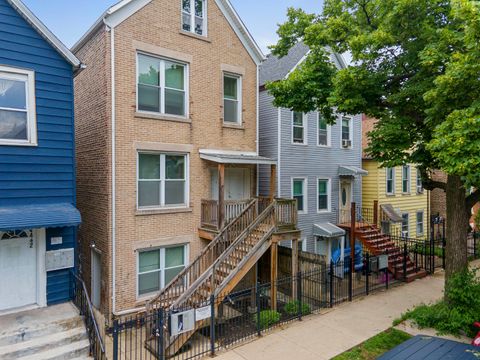
Active
$395,000
6
bds
|
3
ba
|
0
sqft
|
built
1902
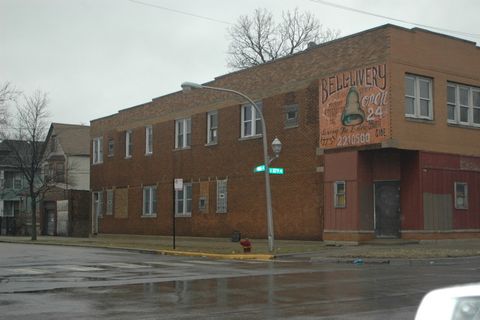
4440 S Honore St, Chicago, IL 60609
$-731
Cash flow
-9.7%
Cash-on-Cash Return
4.0%
Cap rate
0.6%
Rent to Value Ratio
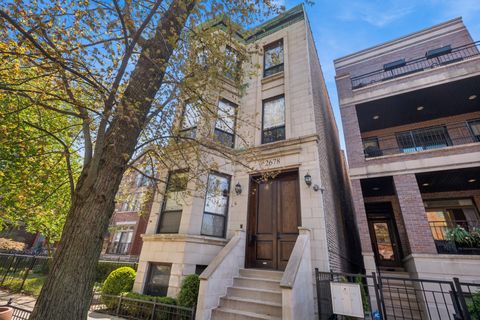
Active
$3,195,000
6
bds
|
6
ba
|
0
sqft
|
built
1890
2678 N Orchard St, Chicago, IL 60614
$-14,132
Cash flow
-23.1%
Cash-on-Cash Return
1.0%
Cap rate
0.3%
Rent to Value Ratio
Active
$127,700
2
bds
|
1
ba
|
861
sqft
|
built
1917
7245 S Honore St, Chicago, IL 60636
$575
Cash flow
23.5%
Cash-on-Cash Return
11.7%
Cap rate
1.4%
Rent to Value Ratio
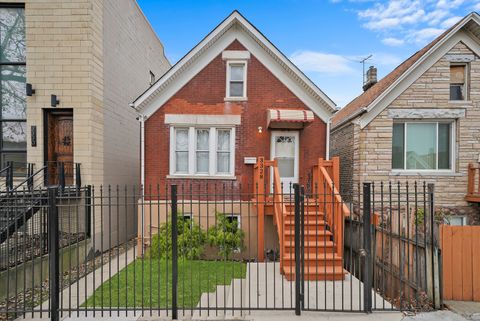
Active
$459,900
4
bds
|
2
ba
|
2,000
sqft
|
built
1888
3328 S Damen Ave, Chicago, IL 60608
$-607
Cash flow
-6.9%
Cash-on-Cash Return
4.7%
Cap rate
0.7%
Rent to Value Ratio
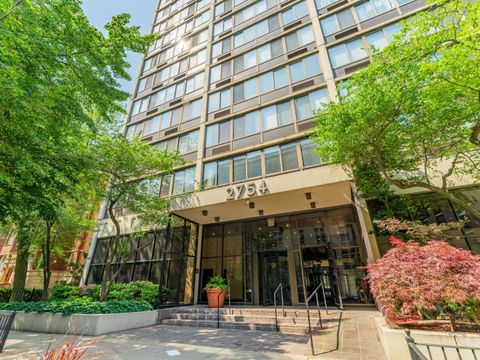
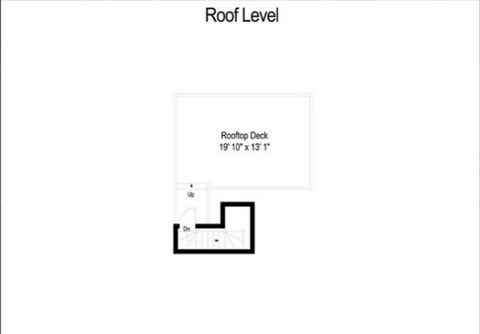
Active
$305,000
1
bds
|
1
ba
|
800
sqft
|
built
1972
2754 N Hampden Ct, Chicago, IL 60614
$-793
Cash flow
-13.6%
Cash-on-Cash Return
3.1%
Cap rate
0.7%
Rent to Value Ratio
Active
$925,000
3
bds
|
4
ba
|
2,884
sqft
|
built
2003
909 W Village Ct, Chicago, IL 60608
$-3,143
Cash flow
-17.7%
Cash-on-Cash Return
2.2%
Cap rate
0.6%
Rent to Value Ratio
Active
$310,000
2
bds
|
2
ba
|
1,160
sqft
|
built
2007
3630 N Harlem Ave, Chicago, IL 60634
$-742
Cash flow
-12.5%
Cash-on-Cash Return
3.4%
Cap rate
0.7%
Rent to Value Ratio

Active
$670,000
3
bds
|
3
ba
|
1,740
sqft
|
built
1978
42280 N Center St, Antioch, IL 60002
$-2,002
Cash flow
-15.6%
Cash-on-Cash Return
2.1%
Cap rate
0.4%
Rent to Value Ratio

Active
$345,000
3
bds
|
3
ba
|
1,812
sqft
|
built
1962
419 Glenshire Rd, Glenview, IL 60025
$-231
Cash flow
-3.5%
Cash-on-Cash Return
4.9%
Cap rate
0.8%
Rent to Value Ratio
Active
$245,000
3
bds
|
2
ba
|
1,106
sqft
|
built
1952
224 Meadow Ln, Lake Zurich, IL 60047
$325
Cash flow
6.9%
Cash-on-Cash Return
7.3%
Cap rate
1.0%
Rent to Value Ratio

Active
$285,000
3
bds
|
3
ba
|
1,701
sqft
|
built
2001
120 Presidential Blvd, Oswego, IL 60543
$-400
Cash flow
-7.3%
Cash-on-Cash Return
4.0%
Cap rate
0.8%
Rent to Value Ratio

Active
$524,999
3
bds
|
3
ba
|
2,050
sqft
|
built
2024
4520 W Shore Dr, Wonder Lake, IL 60097
$-388
Cash flow
-3.9%
Cash-on-Cash Return
4.8%
Cap rate
0.7%
Rent to Value Ratio

Active
$299,000
2
bds
|
2
ba
|
1,449
sqft
|
built
1993
924 Millcreek Cir, Elgin, IL 60123
$-559
Cash flow
-9.8%
Cash-on-Cash Return
3.4%
Cap rate
0.8%
Rent to Value Ratio

Active
$624,900
5
bds
|
3
ba
|
2,896
sqft
|
built
1959
230 Elmwood Dr, Naperville, IL 60540
$-1,239
Cash flow
-10.3%
Cash-on-Cash Return
3.3%
Cap rate
0.6%
Rent to Value Ratio

Active
$479,900
4
bds
|
4
ba
|
4,149
sqft
|
built
1973
10751 S Nashville Ave, Worth, IL 60482
$-870
Cash flow
-9.5%
Cash-on-Cash Return
3.5%
Cap rate
0.7%
Rent to Value Ratio

Active
$485,000
2
bds
|
2
ba
|
1,450
sqft
|
built
2001
1212 N Wells St, Chicago, IL 60610
$-1,060
Cash flow
-11.4%
Cash-on-Cash Return
3.1%
Cap rate
0.8%
Rent to Value Ratio
Active
$500,000
7
bds
|
3
ba
|
2,250
sqft
|
built
1889
1634 W 38th St, Chicago, IL 60609
$-1,406
Cash flow
-14.7%
Cash-on-Cash Return
2.9%
Cap rate
0.5%
Rent to Value Ratio
Active
$299,000
2
bds
|
2
ba
|
1,500
sqft
|
built
1967
7033 N Kedzie Ave, Chicago, IL 60645
$-1,287
Cash flow
-22.5%
Cash-on-Cash Return
1.1%
Cap rate
0.7%
Rent to Value Ratio
Active
$299,999
15
bds
|
8
ba
|
0
sqft
|
built
1894
5016 S Paulina St, Chicago, IL 60609
$-184
Cash flow
-3.2%
Cash-on-Cash Return
5.5%
Cap rate
0.7%
Rent to Value Ratio
Active
$299,000
1
bds
|
1
ba
|
0
sqft
|
built
1989
1600 N Halsted St, Chicago, IL 60614
$-644
Cash flow
-11.2%
Cash-on-Cash Return
3.7%
Cap rate
0.8%
Rent to Value Ratio
Active
$229,900
1
bds
|
1
ba
|
0
sqft
|
built
1913
1550 S Blue Island Ave, Chicago, IL 60608
$-701
Cash flow
-15.9%
Cash-on-Cash Return
2.6%
Cap rate
1.0%
Rent to Value Ratio
Active
$585,000
4
bds
|
2
ba
|
0
sqft
|
built
1913
5028 W Lawrence Ave, Chicago, IL 60630
$-2,159
Cash flow
-19.3%
Cash-on-Cash Return
1.8%
Cap rate
0.3%
Rent to Value Ratio
Active
$1,475,000
3
bds
|
4
ba
|
2,540
sqft
|
built
2009
600 N Lake Shore Dr, Chicago, IL 60611
$-5,393
Cash flow
-19.1%
Cash-on-Cash Return
1.9%
Cap rate
0.6%
Rent to Value Ratio
Active
$179,000
1
bds
|
1
ba
|
0
sqft
|
built
1920
5058 N Claremont Ave, Chicago, IL 60625
$-414
Cash flow
-12.1%
Cash-on-Cash Return
3.5%
Cap rate
0.9%
Rent to Value Ratio
Active
$189,900
2
bds
|
1
ba
|
786
sqft
|
built
1923
6926 S Justine St, Chicago, IL 60636
$199
Cash flow
5.5%
Cash-on-Cash Return
7.5%
Cap rate
0.9%
Rent to Value Ratio
Active
$185,000
1
bds
|
1
ba
|
675
sqft
|
built
1969
230 E Ontario St, Chicago, IL 60611
$-605
Cash flow
-17.1%
Cash-on-Cash Return
2.3%
Cap rate
1.1%
Rent to Value Ratio
Active
$670,000
1
bds
|
2
ba
|
1,071
sqft
|
built
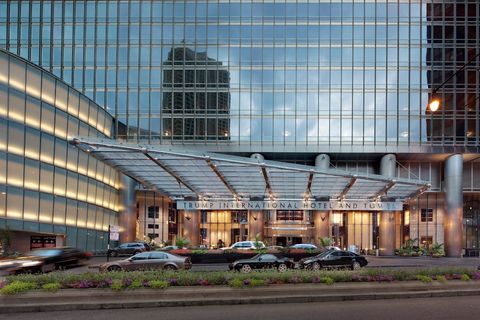
2008
401 N Wabash Ave, Chicago, IL 60611
$-2,762
Cash flow
-21.5%
Cash-on-Cash Return
1.3%
Cap rate
0.6%
Rent to Value Ratio
Active
$165,000
2
bds
|
3
ba
|
1,224
sqft
|
built
2005
3323 W King James Rd, Peoria, IL 61615
$-196
Cash flow
-6.2%
Cash-on-Cash Return
4.8%
Cap rate
1.0%
Rent to Value Ratio
Active
$1,045,000
1
bds
|
3
ba
|
2,230
sqft
|
built
1964
1040 N Lake Shore Dr, Chicago, IL 60611
$-5,093
Cash flow
-25.4%
Cash-on-Cash Return
-0.2%
Cap rate
0.5%
Rent to Value Ratio
Active
$162,000
2
bds
|
2
ba
|
1,000
sqft
|
built
1969
9720 S Pulaski Rd, Oak Lawn, IL 60453
$-98
Cash flow
-3.2%
Cash-on-Cash Return
5.0%
Cap rate
1.1%
Rent to Value Ratio
Active
$3,495,000
6
bds
|
7
ba
|
6,995
sqft
|
built
2014
31 Concord Dr, Oak Brook, IL 60523
$-14,909
Cash flow
-22.3%
Cash-on-Cash Return
0.6%
Cap rate
0.2%
Rent to Value Ratio
Active
$625,000
4
bds
|
4
ba
|
4,434
sqft
|
built
2000
16260 W Mohawk Ct, Lockport, IL 60441
$-1,086
Cash flow
-9.1%
Cash-on-Cash Return
3.6%
Cap rate
0.7%
Rent to Value Ratio
Active
$245,000
2
bds
|
2
ba
|
1,100
sqft
|
built
1962
4800 S Chicago Beach Dr, Chicago, IL 60615
$-1,062
Cash flow
-22.6%
Cash-on-Cash Return
0.5%
Cap rate
0.9%
Rent to Value Ratio
Active
$284,999
3
bds
|
2
ba
|
1,440
sqft
|
built
1962
1520 Pennsylvania Ave, Des Plaines, IL 60018
$-332
Cash flow
-6.1%
Cash-on-Cash Return
4.3%
Cap rate
0.8%
Rent to Value Ratio
Active
$1,300,000
6
bds
|
5
ba
|
6,019
sqft
|
built
1996
18215 Gougar Rd, Joliet, IL 60432
$-6,235
Cash flow
-25.0%
Cash-on-Cash Return
-0.1%
Cap rate
0.2%
Rent to Value Ratio
Active
$319,900
3
bds
|
3
ba
|
1,756
sqft
|
built
2023
864 Briar Glen Ct, Hampshire, IL 60140
$-337
Cash flow
-5.5%
Cash-on-Cash Return
4.4%
Cap rate
0.9%
Rent to Value Ratio

Active
$574,000
3
bds
|
2
ba
|
2,300
sqft
|
built
1949
9337 Crawford Ave, Evanston, IL 60203
$-739
Cash flow
-6.7%
Cash-on-Cash Return
4.1%
Cap rate
0.7%
Rent to Value Ratio
Active
$1,380,000
5
bds
|
5
ba
|
3,248
sqft
|
built
2001
1619 Patriot Blvd, Glenview, IL 60026
$-4,249
Cash flow
-16.1%
Cash-on-Cash Return
2.0%
Cap rate
0.4%
Rent to Value Ratio
Active
$190,000
1
bds
|
1
ba
|
880
sqft
|
built
1970
461 N Jonathan Dr, Palatine, IL 60074
$-377
Cash flow
-10.4%
Cash-on-Cash Return
3.3%
Cap rate
0.8%
Rent to Value Ratio
Active
$134,000
8
bds
|
4
ba
|
0
sqft
|
built
1885
2900 E 87th St, Chicago, IL 60617
$208
Cash flow
8.1%
Cash-on-Cash Return
7.5%
Cap rate
1.1%
Rent to Value Ratio