Illinois Investment Properties for Sale
Browse homes for sale and investment properties in Illinois. Refine your search by price, property type, or more.
Best cash flowing properties in Illinois
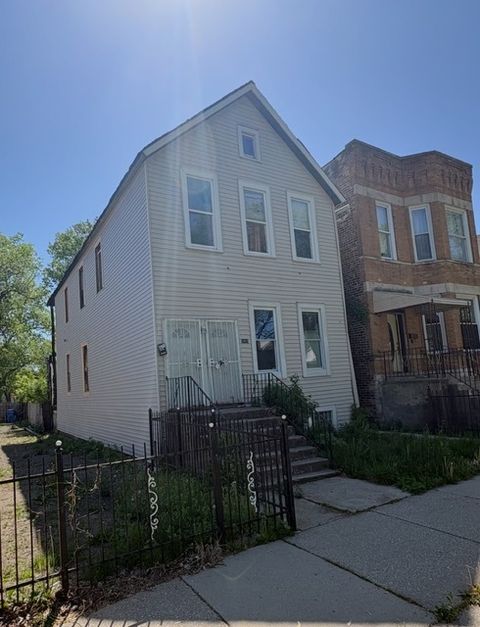
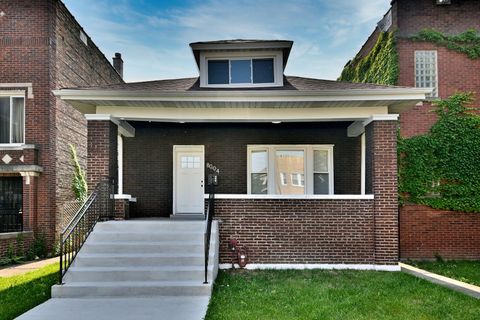
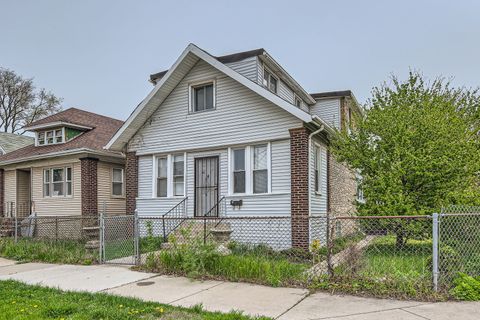
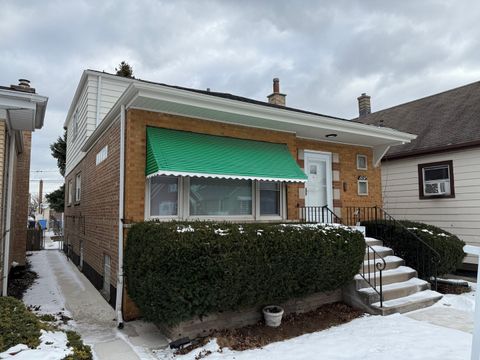
Active
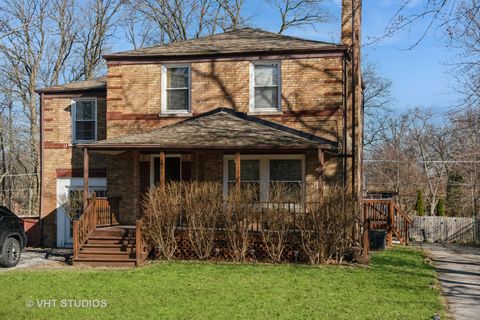
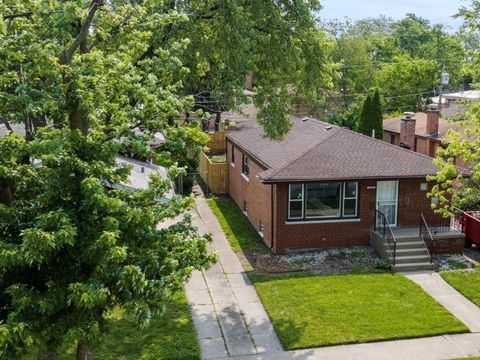
$73,000
5
bds
|
2
ba
|
0
sqft
|
built
1893
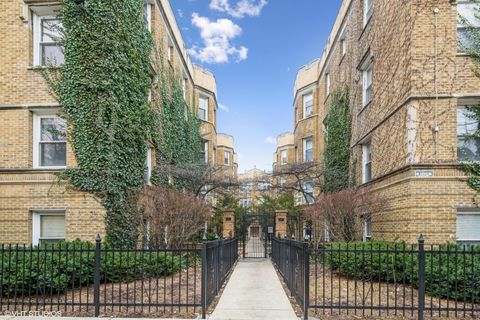
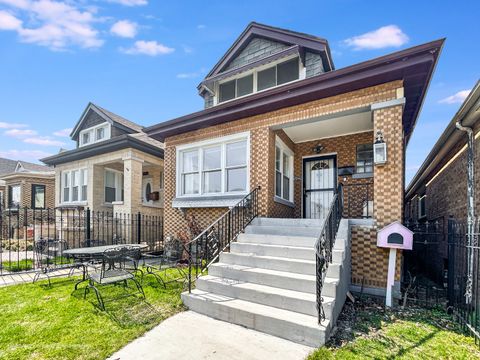
6409 S Carpenter St, Chicago, IL 60621
$1,084
Cash flow
17.3%
Cash-on-Cash Return
17.8%
Cap rate
2.5%
Rent to Value Ratio

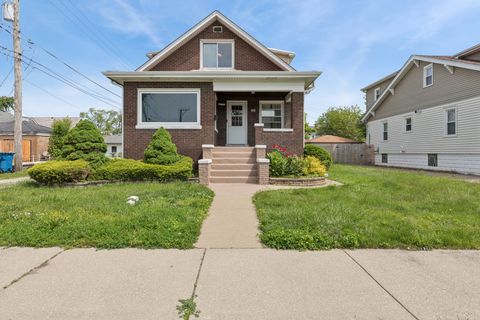
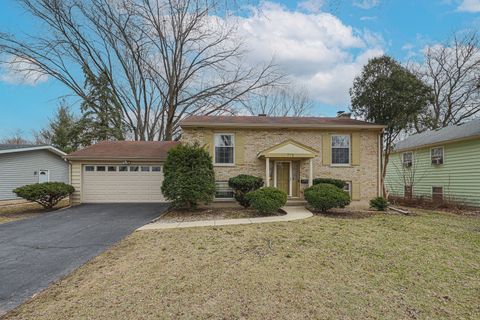
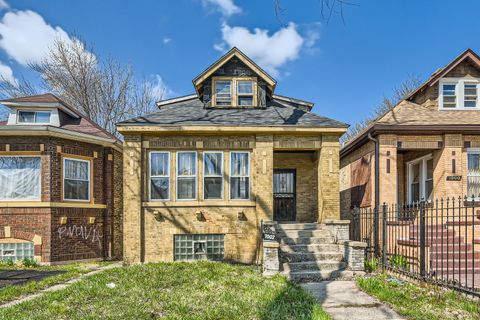
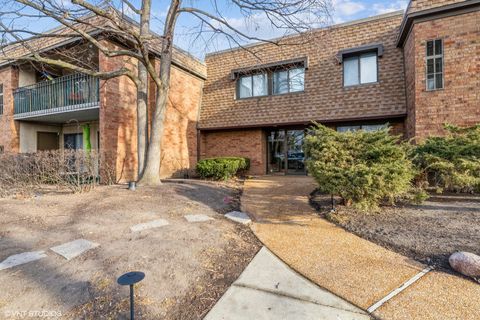
Active
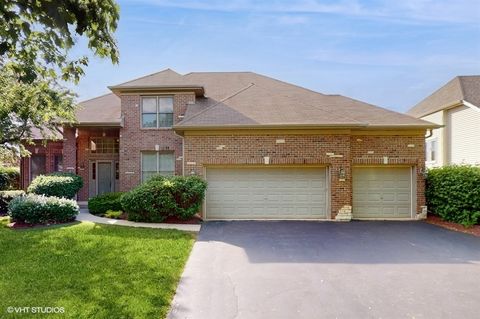
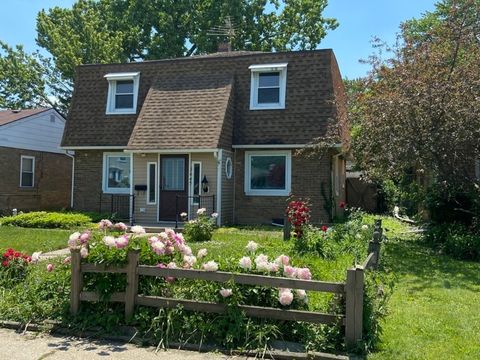
$259,900
3
bds
|
2
ba
|
2,315
sqft
|
built
1973
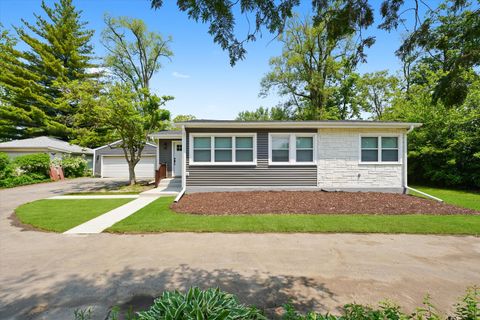
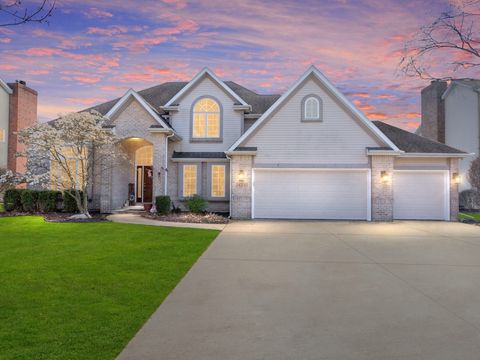
22 W Jane St, Glenwood, IL 60425
$677
Cash flow
13.6%
Cash-on-Cash Return
8.8%
Cap rate
1.2%
Rent to Value Ratio
10,000 out of 16,071 properties for sale in Illinois
Limited Results Shown
Create a free account, or log in to reveal all property listings and enjoy the complete experience.
Active
$73,000
5
bds
|
2
ba
|
0
sqft
|
built
1893
6409 S Carpenter St, Chicago, IL 60621
$1,084
Cash flow
17.3%
Cash-on-Cash Return
17.8%
Cap rate
2.5%
Rent to Value Ratio
Active
$235,500
6
bds
|
3
ba
|
1,900
sqft
|
built
1927
334 153rd St, Calumet City, IL 60409
$-285
Cash flow
-6.3%
Cash-on-Cash Return
4.2%
Cap rate
1.1%
Rent to Value Ratio
Active
$499,900
4
bds
|
2
ba
|
2,098
sqft
|
built
1940
3836 N Pioneer Ave, Chicago, IL 60634
$-647
Cash flow
-6.8%
Cash-on-Cash Return
4.1%
Cap rate
0.6%
Rent to Value Ratio
Active
$169,000
1
bds
|
1
ba
|
900
sqft
|
built
1977
1475 Rebecca Dr, Hoffman Estates, IL 60169
$2
Cash flow
0.1%
Cash-on-Cash Return
5.7%
Cap rate
1.1%
Rent to Value Ratio
Active
$255,000
3
bds
|
2
ba
|
2,328
sqft
|
built
1940
221 Cornwall Dr, Crete, IL 60417
$273
Cash flow
5.6%
Cash-on-Cash Return
7.0%
Cap rate
1.3%
Rent to Value Ratio
Active
$499,000
3
bds
|
3
ba
|
1,600
sqft
|
built
1925
1013 Ferdinand Ave, Forest Park, IL 60130
$-1,367
Cash flow
-14.3%
Cash-on-Cash Return
2.4%
Cap rate
0.4%
Rent to Value Ratio
Active
$659,000
4
bds
|
4
ba
|
2,833
sqft
|
built
2001
528 Terrace Ln, South Elgin, IL 60177
$-1,722
Cash flow
-13.6%
Cash-on-Cash Return
2.5%
Cap rate
0.5%
Rent to Value Ratio
Active
$235,000
2
bds
|
2
ba
|
1,050
sqft
|
built
1974
3856 S Parkway Dr, Northbrook, IL 60062
$-408
Cash flow
-9.1%
Cash-on-Cash Return
3.6%
Cap rate
0.9%
Rent to Value Ratio
Active
$278,900
3
bds
|
2
ba
|
2,300
sqft
|
built
1916
8004 S Ada St, Chicago, IL 60620
$538
Cash flow
10.1%
Cash-on-Cash Return
8.0%
Cap rate
1.0%
Rent to Value Ratio
Active
$339,900
4
bds
|
2
ba
|
1,728
sqft
|
built
1968
719 Webster St, Algonquin, IL 60102
$-622
Cash flow
-9.5%
Cash-on-Cash Return
3.5%
Cap rate
0.6%
Rent to Value Ratio
Active
$249,900
3
bds
|
2
ba
|
1,500
sqft
|
built
1955
1467 W 73rd St, Chicago, IL 60636
$39
Cash flow
0.8%
Cash-on-Cash Return
5.9%
Cap rate
0.8%
Rent to Value Ratio
Active
$1,665,000
5
bds
|
6
ba
|
7,287
sqft
|
built
2003
26285 W Roberts Ln, Barrington, IL 60010
$-4,154
Cash flow
-13.0%
Cash-on-Cash Return
2.7%
Cap rate
0.5%
Rent to Value Ratio
Active
$189,900
2
bds
|
1
ba
|
1,000
sqft
|
built
1921
1624 W Farwell Ave, Chicago, IL 60626
$-135
Cash flow
-3.7%
Cash-on-Cash Return
4.8%
Cap rate
0.9%
Rent to Value Ratio
Active
$334,900
3
bds
|
2
ba
|
1,745
sqft
|
built
1956
2936 Willow Rd, Homewood, IL 60430
$-416
Cash flow
-6.5%
Cash-on-Cash Return
4.2%
Cap rate
0.7%
Rent to Value Ratio
Active
$537,000
4
bds
|
3
ba
|
2,422
sqft
|
built
1991
341 Breckenridge Dr, Aurora, IL 60504
$-1,222
Cash flow
-11.9%
Cash-on-Cash Return
2.9%
Cap rate
0.6%
Rent to Value Ratio
Active
$285,000
1
bds
|
2
ba
|
2,421
sqft
|
built
1975
4 Cour La Salle, Palos Hills, IL 60465
$66
Cash flow
1.2%
Cash-on-Cash Return
6.0%
Cap rate
1.1%
Rent to Value Ratio
Active
$114,900
1
bds
|
1
ba
|
0
sqft
|
built
1975
2030 W 111th St, Chicago, IL 60643
$231
Cash flow
10.5%
Cash-on-Cash Return
8.1%
Cap rate
1.3%
Rent to Value Ratio
Active
$449,900
3
bds
|
3
ba
|
2,042
sqft
|
built
1993
19 W Bay Rd, Palos Heights, IL 60463
$-1,107
Cash flow
-12.8%
Cash-on-Cash Return
2.7%
Cap rate
0.6%
Rent to Value Ratio
Active
$415,000
2
bds
|
2
ba
|
0
sqft
|
built
2001
2307 W Wolfram St, Chicago, IL 60618
$-1,125
Cash flow
-14.1%
Cash-on-Cash Return
2.4%
Cap rate
0.7%
Rent to Value Ratio
Active
$624,900
4
bds
|
3
ba
|
1,836
sqft
|
built
1927
375 S Berkley Ave, Elmhurst, IL 60126
$-1,303
Cash flow
-10.9%
Cash-on-Cash Return
3.2%
Cap rate
0.6%
Rent to Value Ratio
Active
$269,999
3
bds
|
3
ba
|
2,232
sqft
|
built
1962
15035 Evers St, Dolton, IL 60419
$-372
Cash flow
-7.2%
Cash-on-Cash Return
4.0%
Cap rate
0.8%
Rent to Value Ratio

Active
$187,000
2
bds
|
1
ba
|
927
sqft
|
built
1926
6457 N California Ave, Chicago, IL 60645
$-422
Cash flow
-11.8%
Cash-on-Cash Return
3.0%
Cap rate
0.9%
Rent to Value Ratio

Active
$237,000
3
bds
|
2
ba
|
1,269
sqft
|
built
1964
525 N Park Dr, Glenwood, IL 60425
$-203
Cash flow
-4.5%
Cash-on-Cash Return
4.7%
Cap rate
1.0%
Rent to Value Ratio
Active
$159,900
3
bds
|
2
ba
|
1,550
sqft
|
built
1948
3645 177th Pl, Lansing, IL 60438
$64
Cash flow
2.1%
Cash-on-Cash Return
6.2%
Cap rate
1.1%
Rent to Value Ratio
Active
$1,149,000
4
bds
|
4
ba
|
3,437
sqft
|
built
2015
722 Bridle Ln, Wheaton, IL 60187
$-3,499
Cash flow
-15.9%
Cash-on-Cash Return
2.0%
Cap rate
0.4%
Rent to Value Ratio
Active
$459,000
4
bds
|
2
ba
|
0
sqft
|
built
1914
4645 N Leamington Ave, Chicago, IL 60630
$-674
Cash flow
-7.7%
Cash-on-Cash Return
3.9%
Cap rate
0.6%
Rent to Value Ratio
Active
$225,000
9
bds
|
3
ba
|
0
sqft
|
built
1916
8151 S Bennett Ave, Chicago, IL 60617
$483
Cash flow
11.2%
Cash-on-Cash Return
8.3%
Cap rate
1.2%
Rent to Value Ratio
Active
$80,000
3
bds
|
3
ba
|
1,098
sqft
|
built
1922
7002 S Hermitage Ave, Chicago, IL 60636
$637
Cash flow
41.5%
Cash-on-Cash Return
15.2%
Cap rate
2.0%
Rent to Value Ratio
Active
$389,900
3
bds
|
2
ba
|
1,662
sqft
|
built
1987
1604 Estate Cir, Naperville, IL 60565
$-420
Cash flow
-5.6%
Cash-on-Cash Return
4.4%
Cap rate
0.7%
Rent to Value Ratio
Active
$143,000
0
bds
|
1
ba
|
550
sqft
|
built
1973
655 W Irving Park Rd, Chicago, IL 60613
$-80
Cash flow
-2.9%
Cash-on-Cash Return
5.0%
Cap rate
1.4%
Rent to Value Ratio
Active
$459,900
4
bds
|
3
ba
|
2,760
sqft
|
built
1952
6037 S Mason Ave, Chicago, IL 60638
$141
Cash flow
1.6%
Cash-on-Cash Return
6.0%
Cap rate
0.9%
Rent to Value Ratio
Active
$269,900
2
bds
|
2
ba
|
1,350
sqft
|
built
1977
250 Old Oak Dr, Buffalo Grove, IL 60089
$-268
Cash flow
-5.2%
Cash-on-Cash Return
4.5%
Cap rate
0.9%
Rent to Value Ratio
Active
$330,000
3
bds
|
1
ba
|
977
sqft
|
built
1976
2009 Chaplin Ct, Hanover Park, IL 60133
$-336
Cash flow
-5.3%
Cash-on-Cash Return
4.5%
Cap rate
0.8%
Rent to Value Ratio
Active
$159,900
2
bds
|
1
ba
|
900
sqft
|
built
1973
4833 W 109th St, Oak Lawn, IL 60453
$-42
Cash flow
-1.4%
Cash-on-Cash Return
5.4%
Cap rate
1.1%
Rent to Value Ratio

Active
$459,900
3
bds
|
4
ba
|
3,304
sqft
|
built
2001
33 Spyglass Cir, Palos Heights, IL 60463
$-968
Cash flow
-11.0%
Cash-on-Cash Return
3.2%
Cap rate
0.7%
Rent to Value Ratio
Active
$259,900
3
bds
|
2
ba
|
2,315
sqft
|
built
1973
22 W Jane St, Glenwood, IL 60425
$677
Cash flow
13.6%
Cash-on-Cash Return
8.8%
Cap rate
1.2%
Rent to Value Ratio
Active
$429,999
3
bds
|
2
ba
|
2,500
sqft
|
built
1927
3422 N Kolmar Ave, Chicago, IL 60641
$-305
Cash flow
-3.7%
Cash-on-Cash Return
4.8%
Cap rate
0.8%
Rent to Value Ratio
Active
$220,000
5
bds
|
2
ba
|
0
sqft
|
built
1903
1641 S Ridgeway Ave, Chicago, IL 60623
$180
Cash flow
4.3%
Cash-on-Cash Return
6.7%
Cap rate
0.9%
Rent to Value Ratio
Active
$559,900
4
bds
|
4
ba
|
3,328
sqft
|
built
1998
24235 Cropland Dr, Plainfield, IL 60544
$-1,607
Cash flow
-15.0%
Cash-on-Cash Return
2.2%
Cap rate
0.5%
Rent to Value Ratio
Active
$169,900
3
bds
|
1
ba
|
1,210
sqft
|
built
1947
3737 Rose Manor Ter, Markham, IL 60428
$265
Cash flow
8.1%
Cash-on-Cash Return
7.6%
Cap rate
1.3%
Rent to Value Ratio