Illinois Investment Properties for Sale
Browse homes for sale and investment properties in Illinois. Refine your search by price, property type, or more.
Best cash flowing properties in Illinois

Active
$259,999
3
bds
|
2
ba
|
1,048
sqft
|
built
1968
7709 S Champlain Ave, Chicago, IL 60619
$372
Cash flow
7.5%
Cash-on-Cash Return
7.4%
Cap rate
1.0%
Rent to Value Ratio

Active
$219,900
4
bds
|
2
ba
|
1,400
sqft
|
built
1949
1329 E 89th Pl, Chicago, IL 60619
$248
Cash flow
5.9%
Cash-on-Cash Return
7.0%
Cap rate
1.0%
Rent to Value Ratio
10,000 out of 16,071 properties for sale in Illinois
Limited Results Shown
Create a free account, or log in to reveal all property listings and enjoy the complete experience.

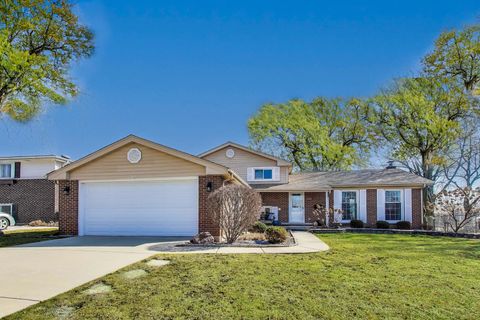
Active
$239,900
4
bds
|
2
ba
|
1,559
sqft
|
built
1941
37 Waltham St, Calumet City, IL 60409
$240
Cash flow
5.2%
Cash-on-Cash Return
6.9%
Cap rate
0.8%
Rent to Value Ratio
Active
$359,900
4
bds
|
3
ba
|
1,036
sqft
|
built
1927
2816 Cuyler Ave, Berwyn, IL 60402
$-259
Cash flow
-3.8%
Cash-on-Cash Return
4.8%
Cap rate
0.8%
Rent to Value Ratio

Active under contract
$749,000
5
bds
|
3
ba
|
3,900
sqft
|
built
2012
26814 Basswood Cir, Plainfield, IL 60585
$-1,726
Cash flow
-12.0%
Cash-on-Cash Return
2.9%
Cap rate
0.6%
Rent to Value Ratio
Active
$529,000
4
bds
|
2
ba
|
1,900
sqft
|
built
1966
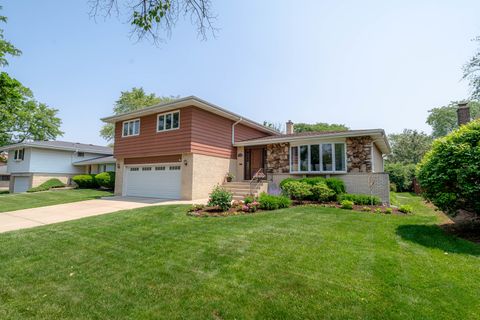
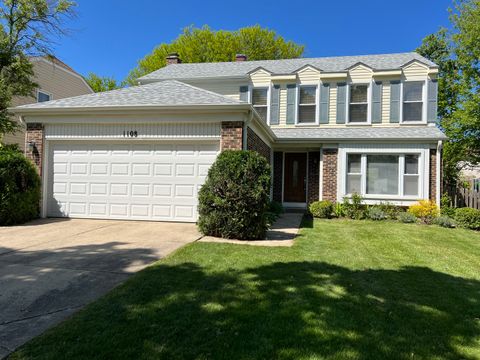
2023 N Shenandoah Dr, Arlington Heights, IL 60004
$-765
Cash flow
-7.5%
Cash-on-Cash Return
3.9%
Cap rate
0.7%
Rent to Value Ratio
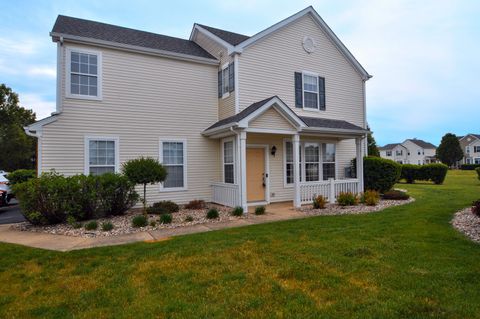
Active under contract
$279,900
3
bds
|
3
ba
|
1,560
sqft
|
built
2006
24952 Clare Cir, Manhattan, IL 60442
$-544
Cash flow
-10.1%
Cash-on-Cash Return
3.3%
Cap rate
0.8%
Rent to Value Ratio
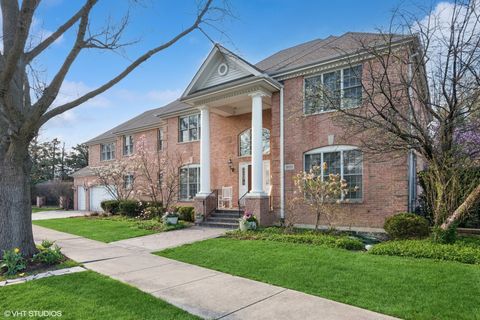
Active
$1,999,999
4
bds
|
6
ba
|
4,961
sqft
|
built
1997
500 S Kenilworth Ave, Elmhurst, IL 60126
$-6,618
Cash flow
-17.3%
Cash-on-Cash Return
1.7%
Cap rate
0.3%
Rent to Value Ratio

Active
$599,000
3
bds
|
3
ba
|
1,800
sqft
|
built
2002
1622 W Ontario St, Chicago, IL 60622
$-1,080
Cash flow
-9.4%
Cash-on-Cash Return
3.5%
Cap rate
0.7%
Rent to Value Ratio
Active
$257,700
2
bds
|
2
ba
|
1,100
sqft
|
built
1989
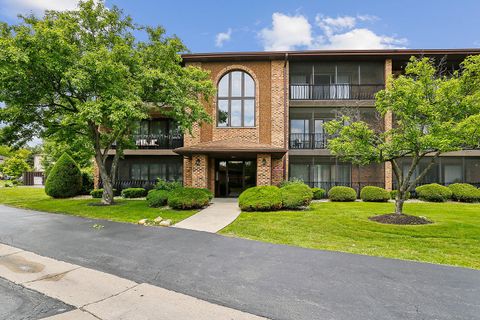
11114 Heritage Dr, Palos Hills, IL 60465
$-251
Cash flow
-5.1%
Cash-on-Cash Return
4.5%
Cap rate
0.9%
Rent to Value Ratio
Active
$875,000
4
bds
|
3
ba
|
3,186
sqft
|
built
1966
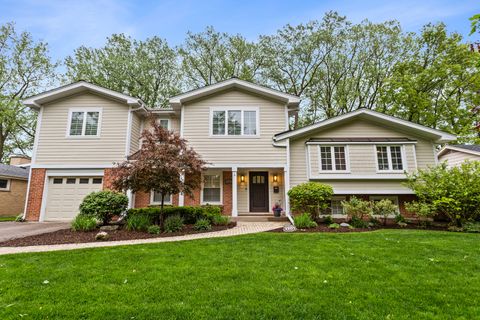
1101 Juniper Ter, Glenview, IL 60025
$-2,339
Cash flow
-13.9%
Cash-on-Cash Return
2.5%
Cap rate
0.5%
Rent to Value Ratio

Active
$349,900
3
bds
|
2
ba
|
1,901
sqft
|
built
1960
3781 W 76th St, Chicago, IL 60652
$-267
Cash flow
-4.0%
Cash-on-Cash Return
4.8%
Cap rate
0.7%
Rent to Value Ratio
Active under contract
$529,000
4
bds
|
3
ba
|
3,099
sqft
|
built
1949
539 S Plum Grove Rd, Palatine, IL 60067
$-1,368
Cash flow
-13.5%
Cash-on-Cash Return
2.6%
Cap rate
0.5%
Rent to Value Ratio
Active
$360,000
3
bds
|
3
ba
|
2,400
sqft
|
built
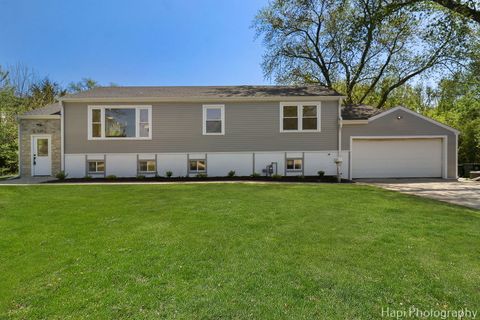
1979
5115 Roberta Ln, Richton Park, IL 60471
$-941
Cash flow
-13.6%
Cash-on-Cash Return
2.5%
Cap rate
0.7%
Rent to Value Ratio
Active
$899,900
4
bds
|
3
ba
|
3,000
sqft
|
built
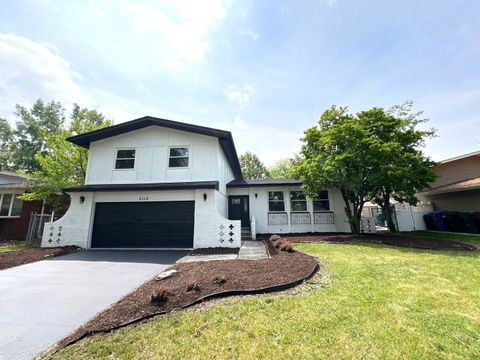
1972
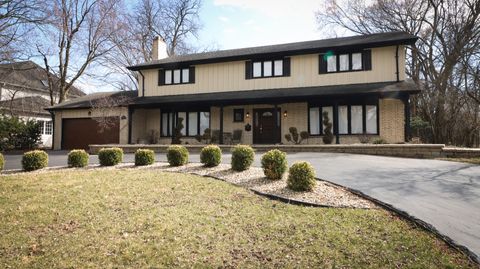
769 S Stuart Ave, Elmhurst, IL 60126
$-2,379
Cash flow
-13.8%
Cash-on-Cash Return
2.5%
Cap rate
0.4%
Rent to Value Ratio

Active
$695,000
4
bds
|
3
ba
|
2,810
sqft
|
built
1970
1552 Chat Ct, Naperville, IL 60565
$-1,656
Cash flow
-12.4%
Cash-on-Cash Return
2.8%
Cap rate
0.5%
Rent to Value Ratio
Active
$525,000
5
bds
|
5
ba
|
4,500
sqft
|
built
1966
2702 1st Private Rd, Flossmoor, IL 60422
$-607
Cash flow
-6.0%
Cash-on-Cash Return
4.3%
Cap rate
0.8%
Rent to Value Ratio
Active under contract
$434,900
4
bds
|
3
ba
|
2,454
sqft
|
built
1989
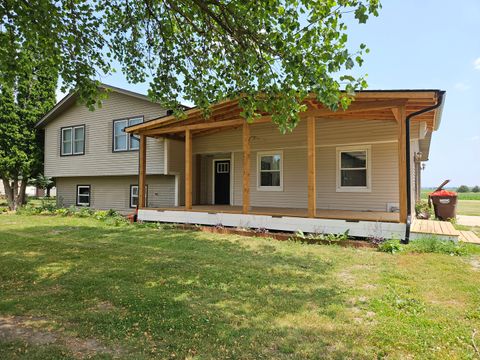
32068 New Lebanon Rd, Hampshire, IL 60140
$-449
Cash flow
-5.4%
Cash-on-Cash Return
4.4%
Cap rate
0.7%
Rent to Value Ratio

Active
$439,900
4
bds
|
4
ba
|
2,800
sqft
|
built
2005
1826 Joseph Sixbury St, Sycamore, IL 60178
$-944
Cash flow
-11.2%
Cash-on-Cash Return
3.1%
Cap rate
0.7%
Rent to Value Ratio
Active
$219,900
4
bds
|
2
ba
|
1,400
sqft
|
built
1949
1329 E 89th Pl, Chicago, IL 60619
$248
Cash flow
5.9%
Cash-on-Cash Return
7.0%
Cap rate
1.0%
Rent to Value Ratio

Active
$899,999
5
bds
|
6
ba
|
5,121
sqft
|
built
1976
5873 Walnut Ave, Downers Grove, IL 60516
$-2,309
Cash flow
-13.4%
Cash-on-Cash Return
2.6%
Cap rate
0.5%
Rent to Value Ratio
Active
$460,000
3
bds
|
4
ba
|
2,047
sqft
|
built
1985
1127 Alpine Ln, Lemont, IL 60439
$-545
Cash flow
-6.2%
Cash-on-Cash Return
4.3%
Cap rate
0.7%
Rent to Value Ratio
Active
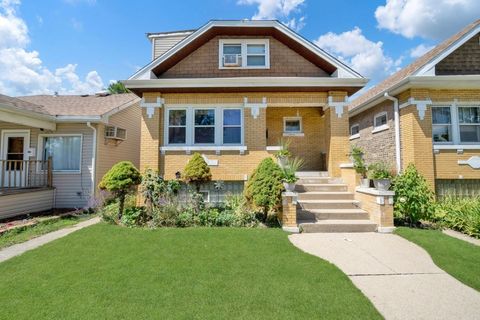
$259,999
3
bds
|
2
ba
|
1,048
sqft
|
built
1968
7709 S Champlain Ave, Chicago, IL 60619
$372
Cash flow
7.5%
Cash-on-Cash Return
7.4%
Cap rate
1.0%
Rent to Value Ratio

Active under contract
$549,000
2
bds
|
2
ba
|
1,650
sqft
|
built
1963
1325 N State Pkwy, Chicago, IL 60610
$-2,230
Cash flow
-21.2%
Cash-on-Cash Return
0.8%
Cap rate
0.7%
Rent to Value Ratio

Active
$459,000
2
bds
|
2
ba
|
1,658
sqft
|
built
1949
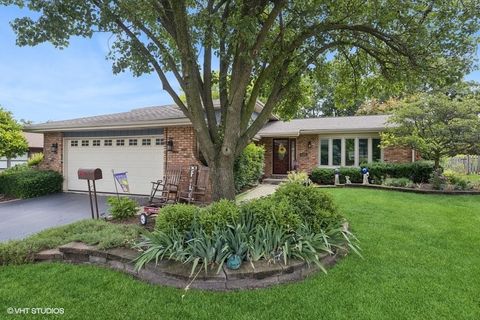
201 W Council Trl, Mount Prospect, IL 60056
$-786
Cash flow
-8.9%
Cash-on-Cash Return
3.6%
Cap rate
0.6%
Rent to Value Ratio

Active
$225,000
3
bds
|
2
ba
|
1,424
sqft
|
built
1998
1537 Anderson Trl, Zion, IL 60099
$-404
Cash flow
-9.4%
Cash-on-Cash Return
3.5%
Cap rate
0.9%
Rent to Value Ratio
Active
$719,000
4
bds
|
4
ba
|
3,940
sqft
|
built
1993
190 Southgate Dr, Vernon Hills, IL 60061
$-1,789
Cash flow
-13.0%
Cash-on-Cash Return
2.7%
Cap rate
0.5%
Rent to Value Ratio

Active
$579,900
5
bds
|
2
ba
|
0
sqft
|
built
1916
5028 N Sawyer Ave, Chicago, IL 60625
$-1,514
Cash flow
-13.6%
Cash-on-Cash Return
2.5%
Cap rate
0.4%
Rent to Value Ratio
Active
$579,900
5
bds
|
3
ba
|
2,796
sqft
|
built
1995
527 Capital Ln, Gurnee, IL 60031
$-1,093
Cash flow
-9.8%
Cash-on-Cash Return
3.4%
Cap rate
0.7%
Rent to Value Ratio

Active
$349,900
2
bds
|
2
ba
|
1,250
sqft
|
built
1973
5415 N Sheridan Rd, Chicago, IL 60640
$-1,308
Cash flow
-19.5%
Cash-on-Cash Return
1.2%
Cap rate
0.8%
Rent to Value Ratio

Active
$360,000
3
bds
|
2
ba
|
2,400
sqft
|
built
1920
9151 S Normal Ave, Chicago, IL 60620
$151
Cash flow
2.2%
Cash-on-Cash Return
6.2%
Cap rate
0.9%
Rent to Value Ratio
Active
$695,000
4
bds
|
3
ba
|
3,648
sqft
|
built
1989
1 Byron Ct, Hawthorn Woods, IL 60047
$-1,032
Cash flow
-7.7%
Cash-on-Cash Return
3.9%
Cap rate
0.7%
Rent to Value Ratio
Active
$399,900
5
bds
|
3
ba
|
0
sqft
|
built
1914
14412 Martin Luther King Jr Dr, Dolton, IL 60419
$-977
Cash flow
-12.7%
Cash-on-Cash Return
2.7%
Cap rate
0.6%
Rent to Value Ratio

Active
$599,999
3
bds
|
4
ba
|
2,800
sqft
|
built
1913
4914 S Washington Park Ct, Chicago, IL 60615
$-755
Cash flow
-6.6%
Cash-on-Cash Return
4.2%
Cap rate
0.6%
Rent to Value Ratio
Active
$550,000
4
bds
|
3
ba
|
2,000
sqft
|
built
1978
1108 Devonshire Rd, Buffalo Grove, IL 60089
$-1,222
Cash flow
-11.6%
Cash-on-Cash Return
3.0%
Cap rate
0.6%
Rent to Value Ratio
Active
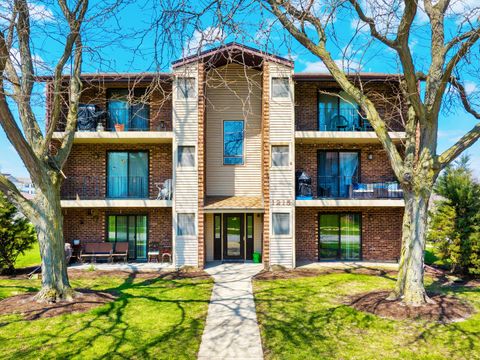
$255,000
2
bds
|
2
ba
|
969
sqft
|
built
1981
1215 Chalet Rd, Naperville, IL 60563
$-394
Cash flow
-8.1%
Cash-on-Cash Return
3.8%
Cap rate
0.8%
Rent to Value Ratio

Active
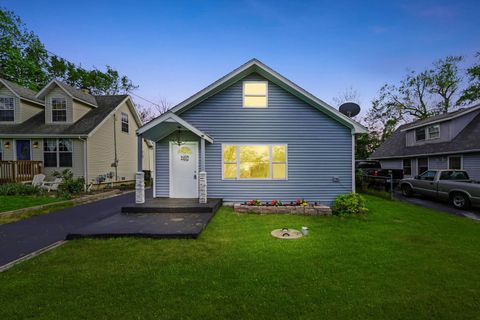
$295,000
5
bds
|
3
ba
|
2,041
sqft
|
built
1920
2002 Grove Ave, North Chicago, IL 60064
$-52
Cash flow
-0.9%
Cash-on-Cash Return
5.5%
Cap rate
0.9%
Rent to Value Ratio

Active
$365,000
2
bds
|
2
ba
|
1,339
sqft
|
built
1996
5360 N Lowell Ave, Chicago, IL 60630
$-798
Cash flow
-11.4%
Cash-on-Cash Return
3.1%
Cap rate
0.7%
Rent to Value Ratio
Active
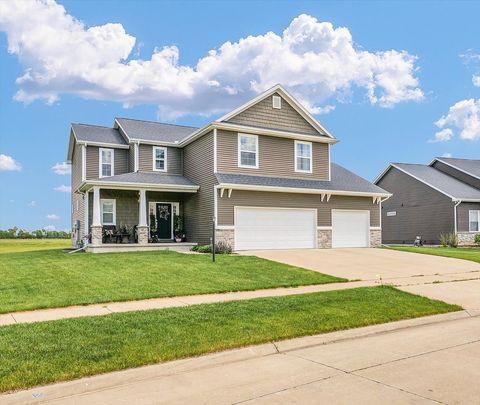
$457,500
4
bds
|
3
ba
|
2,402
sqft
|
built
2018
1908 Littlefield Ln, Mahomet, IL 61853
$-601
Cash flow
-6.9%
Cash-on-Cash Return
4.1%
Cap rate
0.8%
Rent to Value Ratio
Active
$261,000
3
bds
|
2
ba
|
1,200
sqft
|
built
1960
26427 W Prospect Ave, Antioch, IL 60002
$-264
Cash flow
-5.3%
Cash-on-Cash Return
4.5%
Cap rate
0.8%
Rent to Value Ratio
Active
$340,000
3
bds
|
2
ba
|
1,959
sqft
|
built
2006
13211 W Sheffield Ln, Beach Park, IL 60083
$-461
Cash flow
-7.1%
Cash-on-Cash Return
4.1%
Cap rate
0.7%
Rent to Value Ratio
Active
$599,000
4
bds
|
3
ba
|
2,500
sqft
|
built
1967
912 N Sumac Ln, Mount Prospect, IL 60056
$-817
Cash flow
-7.1%
Cash-on-Cash Return
4.0%
Cap rate
0.7%
Rent to Value Ratio