Illinois Investment Properties for Sale
Browse homes for sale and investment properties in Illinois. Refine your search by price, property type, or more.
Best cash flowing properties in Illinois

Active
$150,000
6
bds
|
2
ba
|
0
sqft
|
built
1890
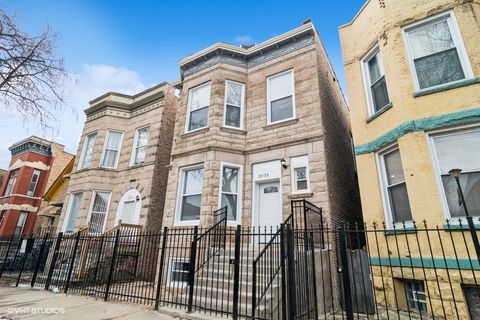
4321 W Maypole Ave, Chicago, IL 60624
$318
Cash flow
11.1%
Cash-on-Cash Return
8.8%
Cap rate
1.2%
Rent to Value Ratio

Active
$210,000
3
bds
|
2
ba
|
1,250
sqft
|
built
1969
605 Saginaw Ave, Calumet City, IL 60409
$299
Cash flow
7.4%
Cash-on-Cash Return
8.0%
Cap rate
1.0%
Rent to Value Ratio
10,000 out of 16,044 properties for sale in Illinois
Limited Results Shown
Create a free account, or log in to reveal all property listings and enjoy the complete experience.

Active
$369,000
3
bds
|
2
ba
|
1,290
sqft
|
built
1929
14 E Madison St, Villa Park, IL 60181
$-502
Cash flow
-7.1%
Cash-on-Cash Return
4.6%
Cap rate
0.8%
Rent to Value Ratio
Active
$210,000
3
bds
|
2
ba
|
1,250
sqft
|
built
1969
605 Saginaw Ave, Calumet City, IL 60409
$299
Cash flow
7.4%
Cash-on-Cash Return
8.0%
Cap rate
1.0%
Rent to Value Ratio

Active
$439,900
4
bds
|
4
ba
|
2,509
sqft
|
built
2006
2081 Ingemunson Ln, Yorkville, IL 60560
$-1,075
Cash flow
-12.7%
Cash-on-Cash Return
3.3%
Cap rate
0.7%
Rent to Value Ratio

Active
$167,000
1
bds
|
1
ba
|
900
sqft
|
built
1962
4250 N Marine Dr, Chicago, IL 60613
$-525
Cash flow
-16.4%
Cash-on-Cash Return
2.5%
Cap rate
1.2%
Rent to Value Ratio

Active
$380,000
4
bds
|
3
ba
|
2,133
sqft
|
built
2005
838 Valley Stream Dr, Pingree Grove, IL 60140
$-766
Cash flow
-10.5%
Cash-on-Cash Return
3.8%
Cap rate
0.8%
Rent to Value Ratio

Active
$349,000
4
bds
|
3
ba
|
2,091
sqft
|
built
1938
24311 N Bonnie Ln, Lake Zurich, IL 60047
$62
Cash flow
0.9%
Cash-on-Cash Return
6.5%
Cap rate
1.0%
Rent to Value Ratio

Pending
$190,000
3
bds
|
2
ba
|
1,160
sqft
|
built
1982
347 Meadow Green Ln, Round Lake Beach, IL 60073
$-275
Cash flow
-7.6%
Cash-on-Cash Return
4.5%
Cap rate
1.0%
Rent to Value Ratio

Active
$445,000
4
bds
|
2
ba
|
2,182
sqft
|
built
1911
9606 S Vanderpoel Ave, Chicago, IL 60643
$-362
Cash flow
-4.2%
Cash-on-Cash Return
5.3%
Cap rate
0.8%
Rent to Value Ratio

Active
$245,000
3
bds
|
2
ba
|
1,302
sqft
|
built
1970
110 W Butterfield Rd, Elmhurst, IL 60126
$-739
Cash flow
-15.7%
Cash-on-Cash Return
2.6%
Cap rate
1.0%
Rent to Value Ratio

Active under contract
$2,850,000
6
bds
|
6
ba
|
6,868
sqft
|
built
1989
475 Red Fox Ln, Lake Forest, IL 60045
$-11,676
Cash flow
-21.4%
Cash-on-Cash Return
1.3%
Cap rate
0.4%
Rent to Value Ratio

Active
$620,000
4
bds
|
3
ba
|
0
sqft
|
built
1950
2417 Lyons St, Evanston, IL 60201
$-1,599
Cash flow
-13.5%
Cash-on-Cash Return
3.2%
Cap rate
0.6%
Rent to Value Ratio

Active
$849,000
3
bds
|
2
ba
|
1,800
sqft
|
built
2006
849 N Franklin St, Chicago, IL 60610
$-3,272
Cash flow
-20.1%
Cash-on-Cash Return
1.6%
Cap rate
0.6%
Rent to Value Ratio

Active
$289,900
3
bds
|
2
ba
|
0
sqft
|
built
1919
7633 N Greenview Ave, Chicago, IL 60626
$-485
Cash flow
-8.7%
Cash-on-Cash Return
4.3%
Cap rate
0.9%
Rent to Value Ratio

Active
$364,900
2
bds
|
3
ba
|
1,373
sqft
|
built
2007
19242 104th Ave, Mokena, IL 60448
$-578
Cash flow
-8.3%
Cash-on-Cash Return
4.4%
Cap rate
0.8%
Rent to Value Ratio

Active
$180,000
1
bds
|
1
ba
|
800
sqft
|
built
1932
6171 N Sheridan Rd, Chicago, IL 60660
$-518
Cash flow
-15.0%
Cash-on-Cash Return
2.8%
Cap rate
1.1%
Rent to Value Ratio
Active
$615,000
3
bds
|
3
ba
|
1,600
sqft
|
built
1924
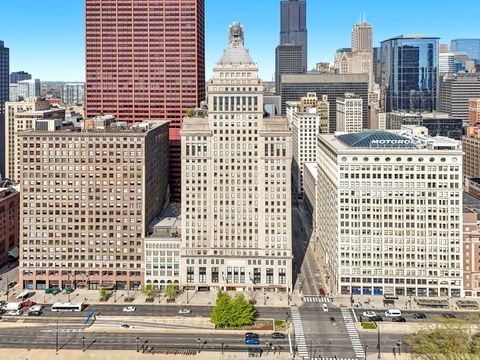
310 S Michigan Ave, Chicago, IL 60604
$-2,873
Cash flow
-24.4%
Cash-on-Cash Return
0.7%
Cap rate
0.7%
Rent to Value Ratio

Active
$235,000
1
bds
|
1
ba
|
900
sqft
|
built
1977
4946 Douglas Rd, Downers Grove, IL 60515
$-345
Cash flow
-7.7%
Cash-on-Cash Return
4.5%
Cap rate
0.9%
Rent to Value Ratio
Active
$349,900
3
bds
|
2
ba
|
1,176
sqft
|
built
1953
407 S York Rd, Bensenville, IL 60106
$-595
Cash flow
-8.9%
Cash-on-Cash Return
4.2%
Cap rate
0.7%
Rent to Value Ratio

Active
$619,000
3
bds
|
3
ba
|
2,500
sqft
|
built
1967
636 Cambridge Dr, Schaumburg, IL 60193
$-1,808
Cash flow
-15.2%
Cash-on-Cash Return
2.8%
Cap rate
0.5%
Rent to Value Ratio
Active
$559,900
6
bds
|
3
ba
|
0
sqft
|
built
1905
3035 W Flournoy St, Chicago, IL 60612
$-1,394
Cash flow
-13.0%
Cash-on-Cash Return
3.3%
Cap rate
0.5%
Rent to Value Ratio
Active
$359,900
3
bds
|
2
ba
|
1,200
sqft
|
built
1951
3415 Adams St, Bellwood, IL 60104
$-782
Cash flow
-11.3%
Cash-on-Cash Return
3.7%
Cap rate
0.7%
Rent to Value Ratio

Active
$519,900
2
bds
|
2
ba
|
1,450
sqft
|
built
2002
669 N Peoria St, Chicago, IL 60642
$-1,057
Cash flow
-10.6%
Cash-on-Cash Return
3.8%
Cap rate
0.8%
Rent to Value Ratio
Active
$899,000
5
bds
|
3
ba
|
2,880
sqft
|
built
1967
1329 Sanford Ln, Glenview, IL 60025
$-2,183
Cash flow
-12.7%
Cash-on-Cash Return
3.4%
Cap rate
0.6%
Rent to Value Ratio

Active
$650,000
6
bds
|
4
ba
|
5,000
sqft
|
built
1986
9344 N Lincoln Ave, Niles, IL 60714
$-762
Cash flow
-6.1%
Cash-on-Cash Return
4.9%
Cap rate
0.8%
Rent to Value Ratio
Active
$599,900
3
bds
|
3
ba
|
1,954
sqft
|
built
1938
1021 Cleveland Ave, Park Ridge, IL 60068
$-2,173
Cash flow
-18.9%
Cash-on-Cash Return
1.9%
Cap rate
0.6%
Rent to Value Ratio
Active under contract
$549,500
4
bds
|
3
ba
|
2,176
sqft
|
built
1964
604 S Reuter Dr, Arlington Heights, IL 60005
$-1,390
Cash flow
-13.2%
Cash-on-Cash Return
3.2%
Cap rate
0.6%
Rent to Value Ratio
Active
$569,000
3
bds
|
3
ba
|
2,100
sqft
|
built
1913
827 Thomas Ave, Forest Park, IL 60130
$-886
Cash flow
-8.1%
Cash-on-Cash Return
4.4%
Cap rate
0.8%
Rent to Value Ratio

Active
$398,900
3
bds
|
1
ba
|
1,114
sqft
|
built
1978
24W500 Seabrook Ct, Naperville, IL 60540
$-1,038
Cash flow
-13.6%
Cash-on-Cash Return
3.1%
Cap rate
0.6%
Rent to Value Ratio
Active
$925,000
4
bds
|
4
ba
|
4,325
sqft
|
built
1956
8081 Tennessee Ave, Willowbrook, IL 60527
$-3,305
Cash flow
-18.6%
Cash-on-Cash Return
2.0%
Cap rate
0.3%
Rent to Value Ratio

Active
$579,900
3
bds
|
3
ba
|
1,890
sqft
|
built
1958
815 Santa Maria Dr, Naperville, IL 60540
$-1,746
Cash flow
-15.7%
Cash-on-Cash Return
2.7%
Cap rate
0.6%
Rent to Value Ratio
Active
$150,000
6
bds
|
2
ba
|
0
sqft
|
built
1890
4321 W Maypole Ave, Chicago, IL 60624
$318
Cash flow
11.1%
Cash-on-Cash Return
8.8%
Cap rate
1.2%
Rent to Value Ratio

Active
$298,000
3
bds
|
2
ba
|
2,100
sqft
|
built
1919
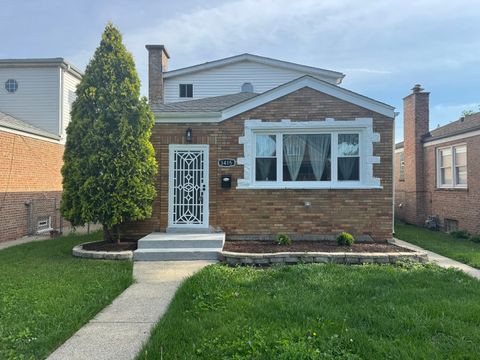
8344 S Ada St, Chicago, IL 60620
$-473
Cash flow
-8.3%
Cash-on-Cash Return
4.4%
Cap rate
0.6%
Rent to Value Ratio

Active
$374,000
3
bds
|
2
ba
|
1,577
sqft
|
built
1929
2827 N 77th Ct, Elmwood Park, IL 60707
$-493
Cash flow
-6.9%
Cash-on-Cash Return
4.7%
Cap rate
0.8%
Rent to Value Ratio

Active
$399,900
2
bds
|
1
ba
|
0
sqft
|
built
1962
1455 N Sandburg Ter, Chicago, IL 60610
$-757
Cash flow
-9.9%
Cash-on-Cash Return
4.0%
Cap rate
0.9%
Rent to Value Ratio
Active
$225,000
2
bds
|
2
ba
|
1,300
sqft
|
built
2004
15505 Cicero Ave, Oak Forest, IL 60452
$-458
Cash flow
-10.6%
Cash-on-Cash Return
3.8%
Cap rate
1.0%
Rent to Value Ratio

Active
$464,900
3
bds
|
2
ba
|
1,747
sqft
|
built
1979
479 Newport Dr, Naperville, IL 60565
$-853
Cash flow
-9.6%
Cash-on-Cash Return
4.1%
Cap rate
0.7%
Rent to Value Ratio
Active
$419,000
4
bds
|
3
ba
|
3,623
sqft
|
built
1997
18507 Indie Ct, Hazel Crest, IL 60429
$-1,000
Cash flow
-12.5%
Cash-on-Cash Return
3.4%
Cap rate
0.9%
Rent to Value Ratio

Active
$389,000
2
bds
|
2
ba
|
2,023
sqft
|
built
1990
20936 W Orangeblossom Ln, Plainfield, IL 60544
$-1,292
Cash flow
-17.3%
Cash-on-Cash Return
2.3%
Cap rate
0.6%
Rent to Value Ratio
Active under contract
$434,900
3
bds
|
2
ba
|
1,625
sqft
|
built
1965
476 Raupp Blvd, Buffalo Grove, IL 60089
$-720
Cash flow
-8.6%
Cash-on-Cash Return
4.3%
Cap rate
0.7%
Rent to Value Ratio
Active
$365,000
3
bds
|
2
ba
|
1,081
sqft
|
built
1975
4925 Timber Ct, Oak Forest, IL 60452
$-1,143
Cash flow
-16.3%
Cash-on-Cash Return
2.5%
Cap rate
0.7%
Rent to Value Ratio