Illinois Investment Properties for Sale
Browse homes for sale and investment properties in Illinois. Refine your search by price, property type, or more.
Best cash flowing properties in Illinois
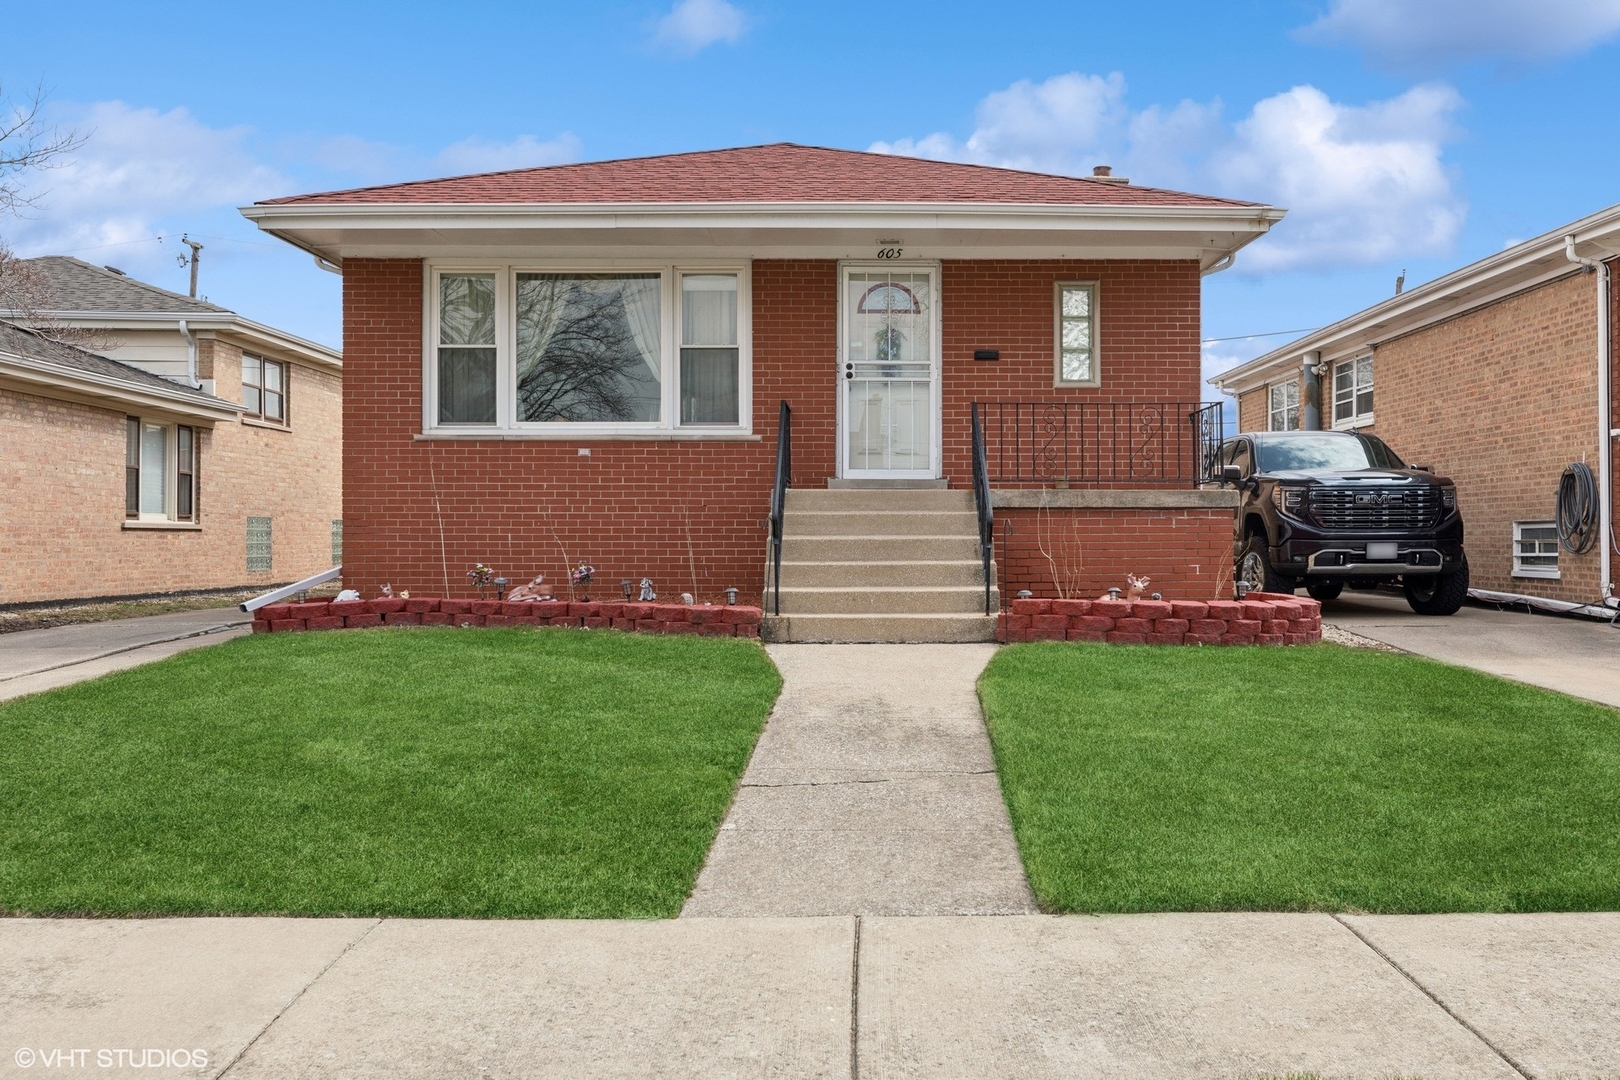
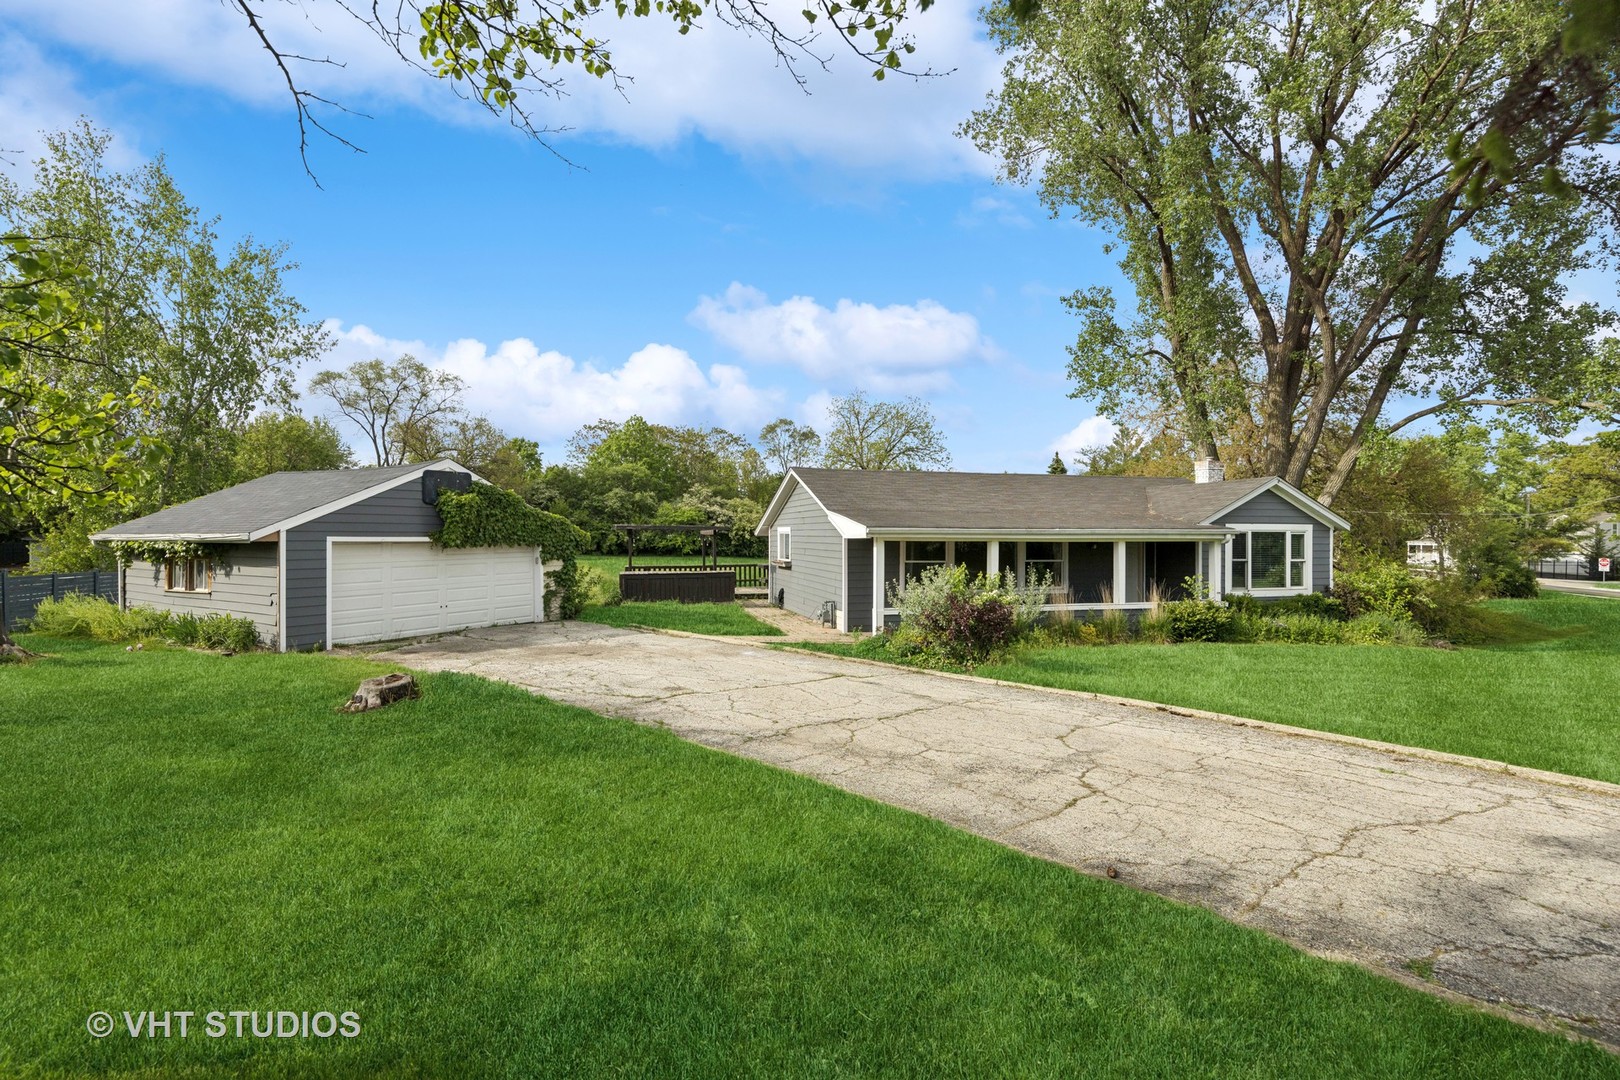
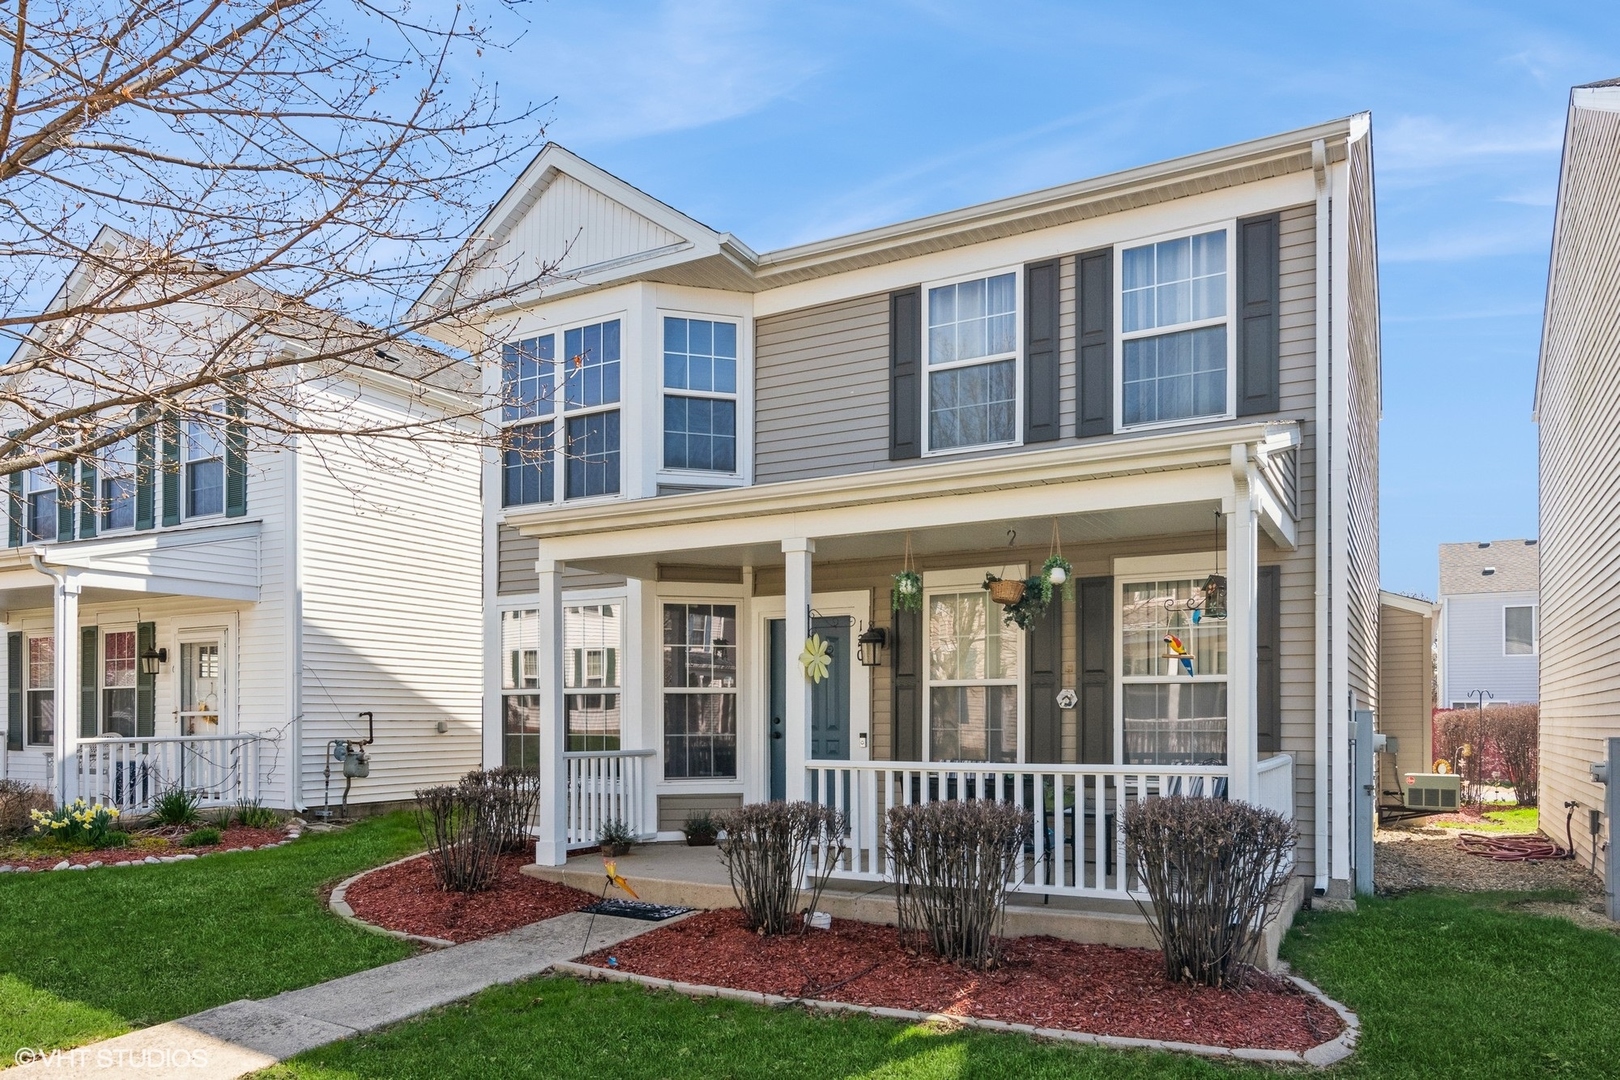
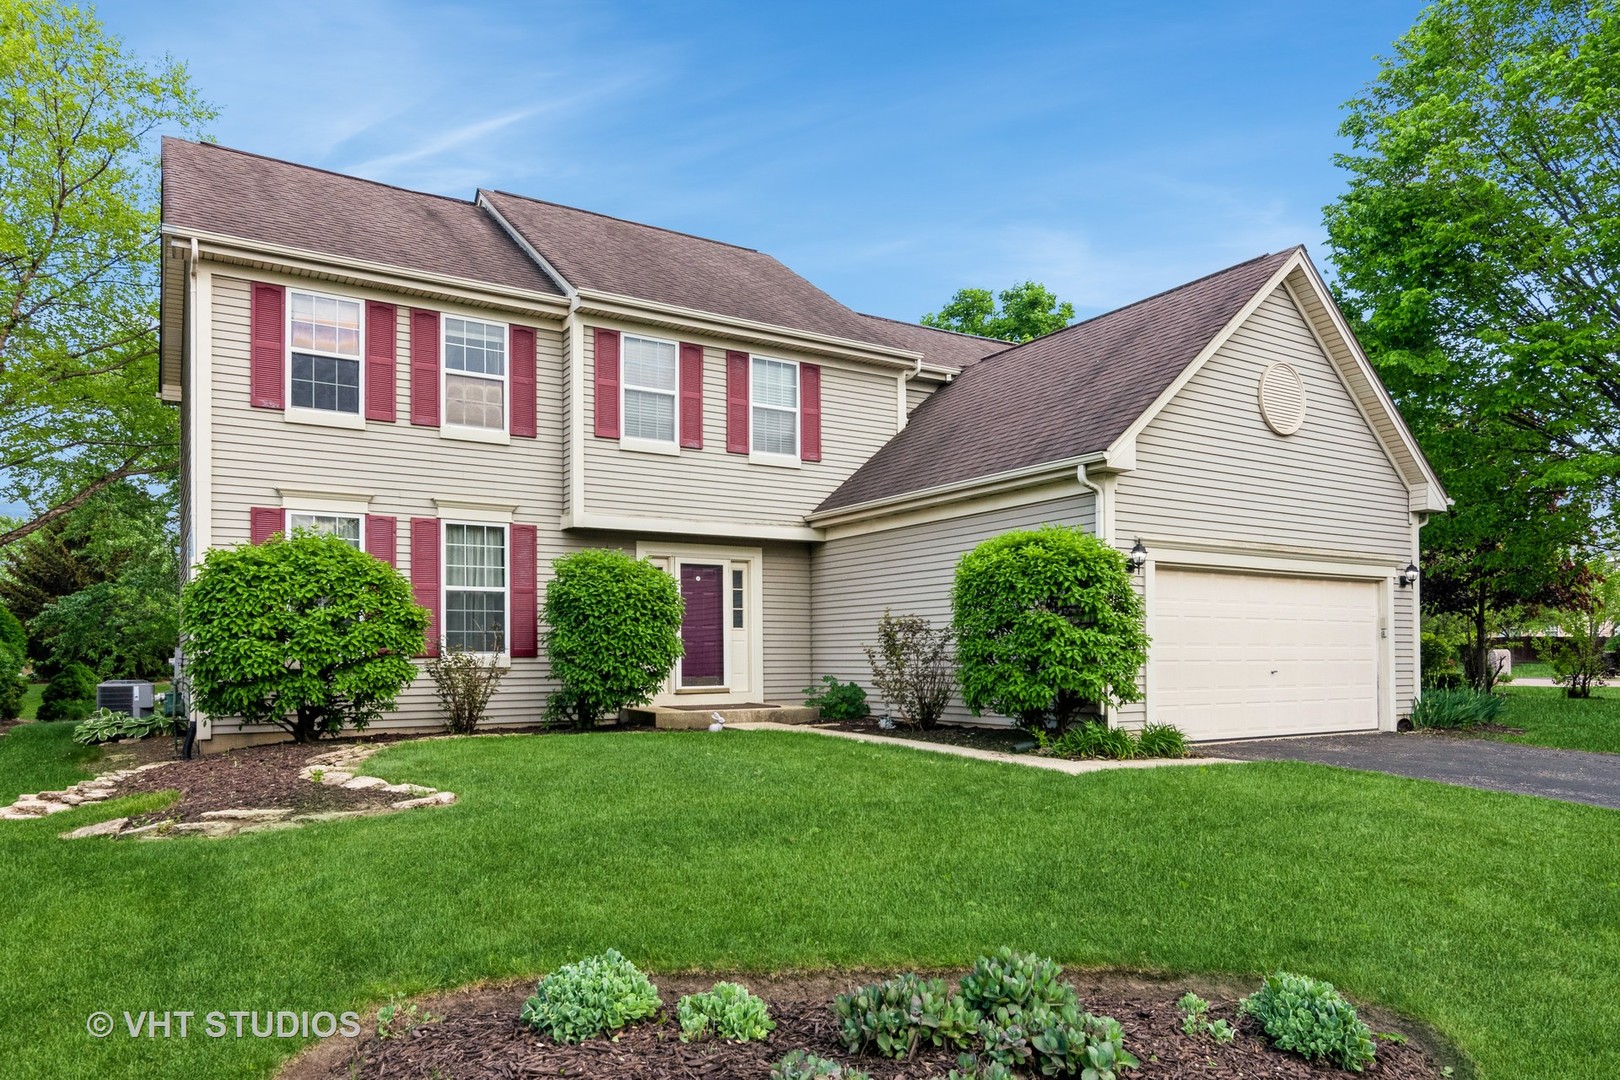
Active
$210,000
3
bds
|
2
ba
|
1,250
sqft
|
built
1969
605 Saginaw Ave, Calumet City, IL 60409
$401
Cash flow
10.0%
Cash-on-Cash Return
8.0%
Cap rate
1.0%
Rent to Value Ratio
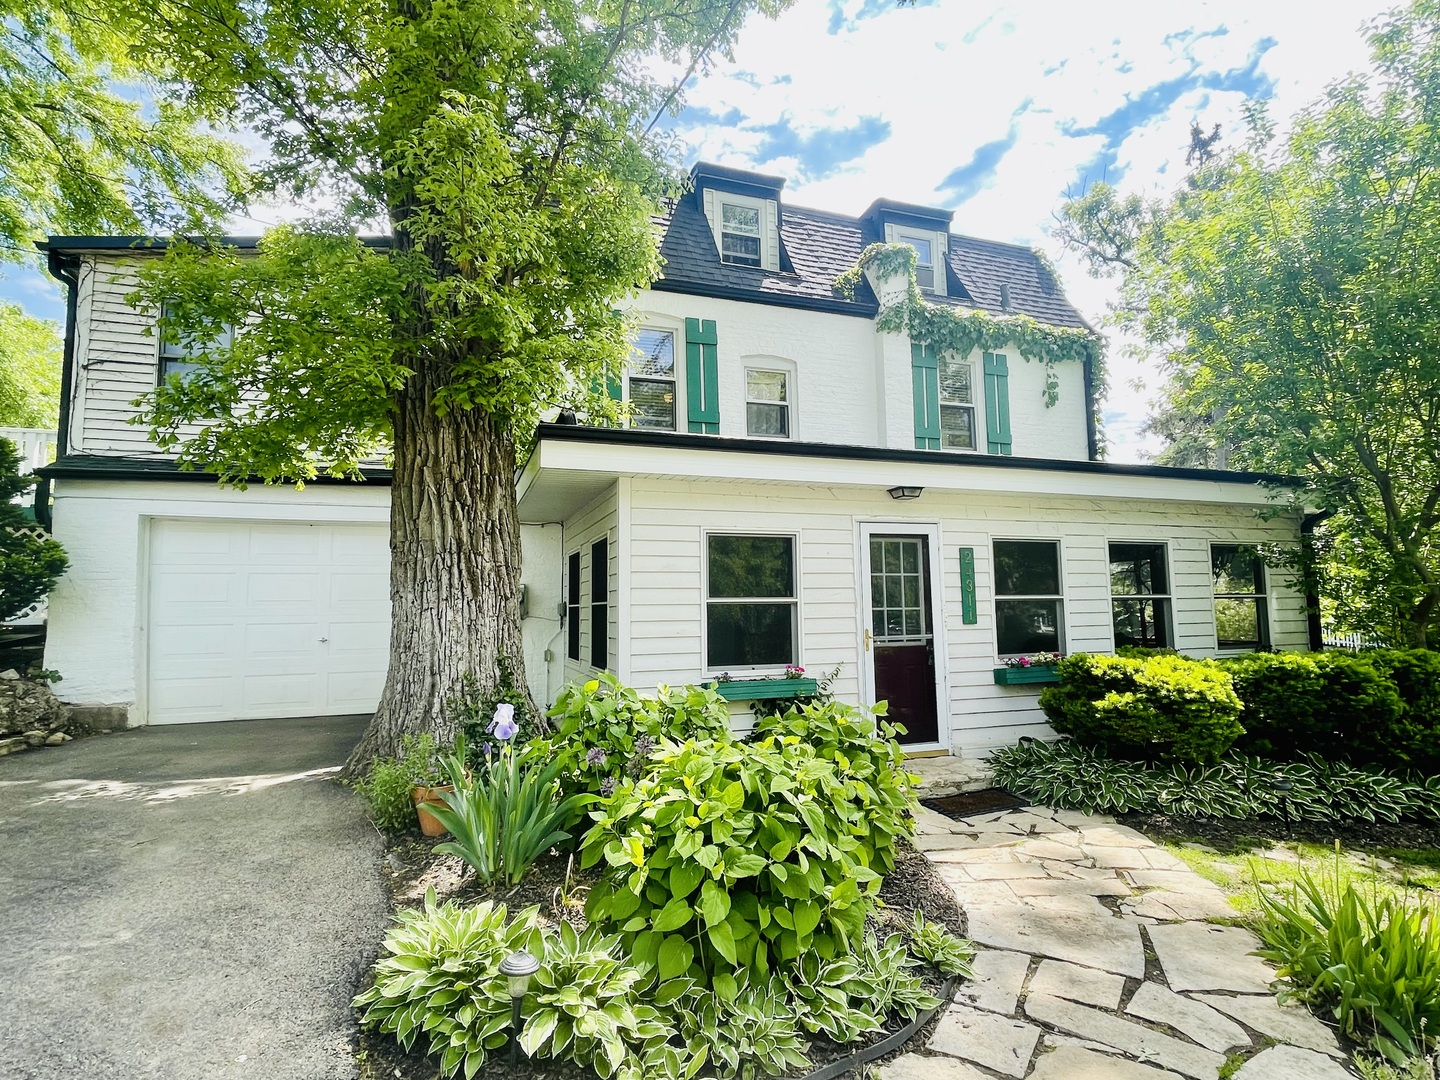
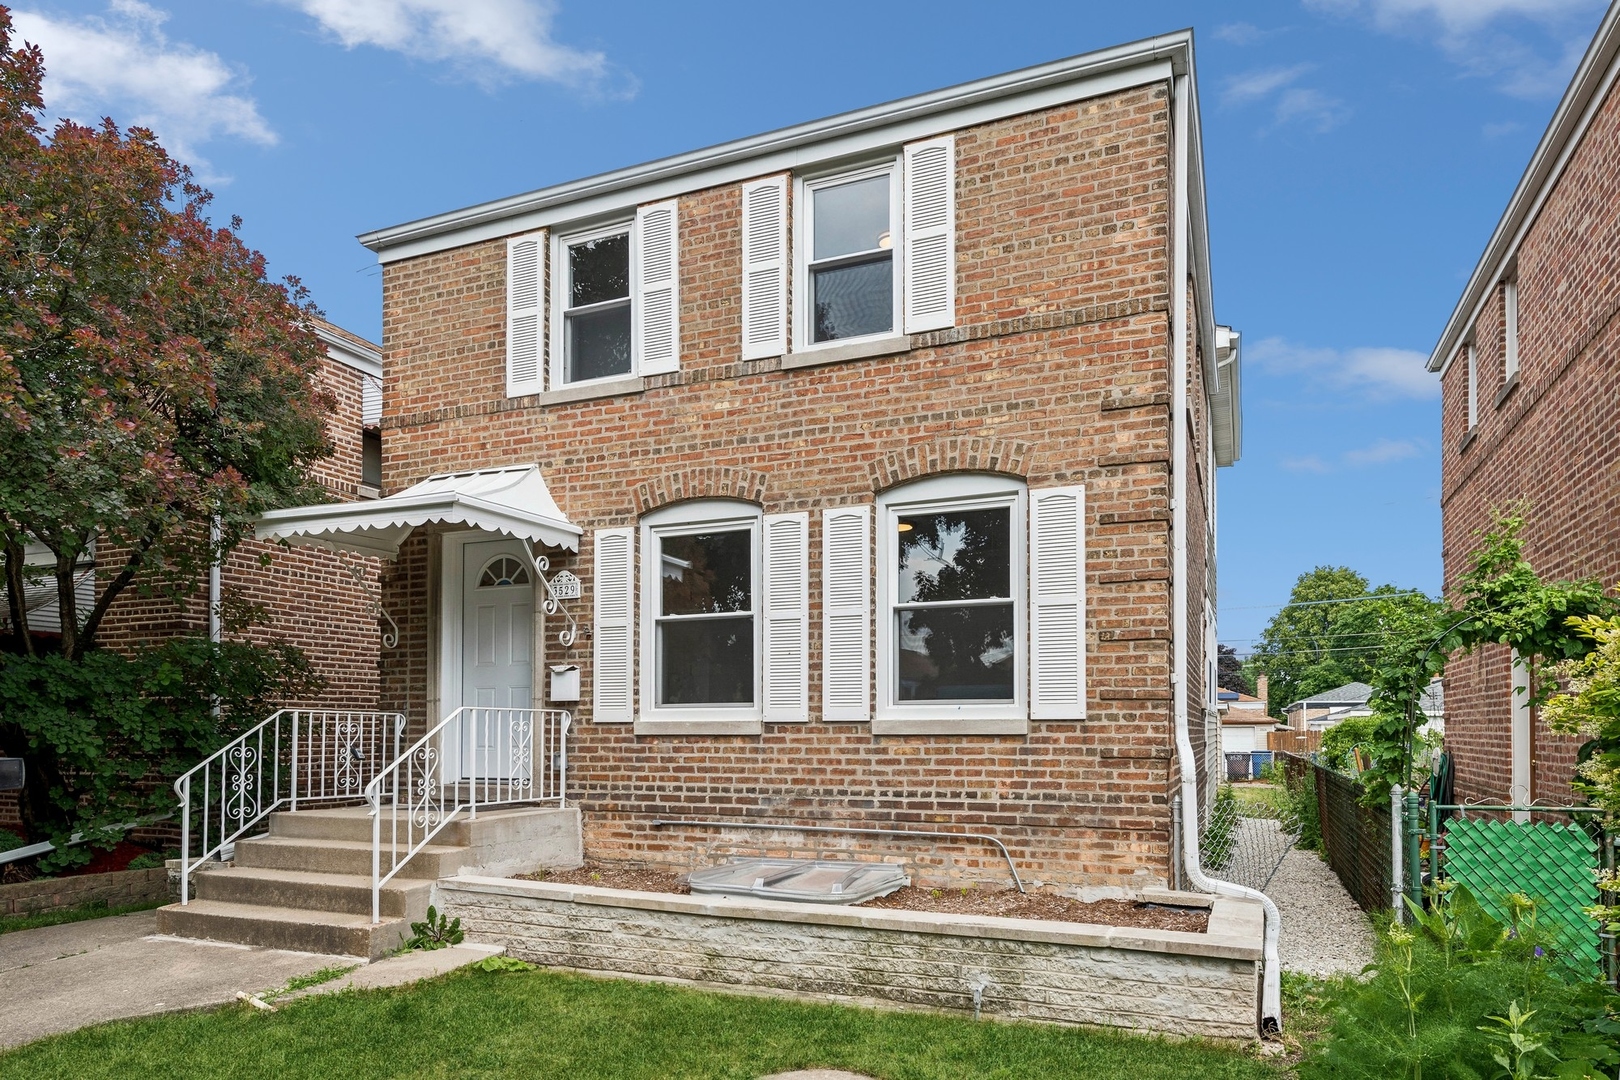
Active
$349,000
4
bds
|
3
ba
|
2,091
sqft
|
built
1938
24311 N Bonnie Ln, Lake Zurich, IL 60047
$232
Cash flow
3.5%
Cash-on-Cash Return
6.5%
Cap rate
1.0%
Rent to Value Ratio
10,000 out of 16,071 properties for sale in Illinois
Limited Results Shown
Create a free account, or log in to reveal all property listings and enjoy the complete experience.
Active
$175,000
3
bds
|
2
ba
|
1,120
sqft
|
built
1974
4918 Montery Dr, Richton Park, IL 60471
$-78
Cash flow
-2.3%
Cash-on-Cash Return
5.1%
Cap rate
1.1%
Rent to Value Ratio
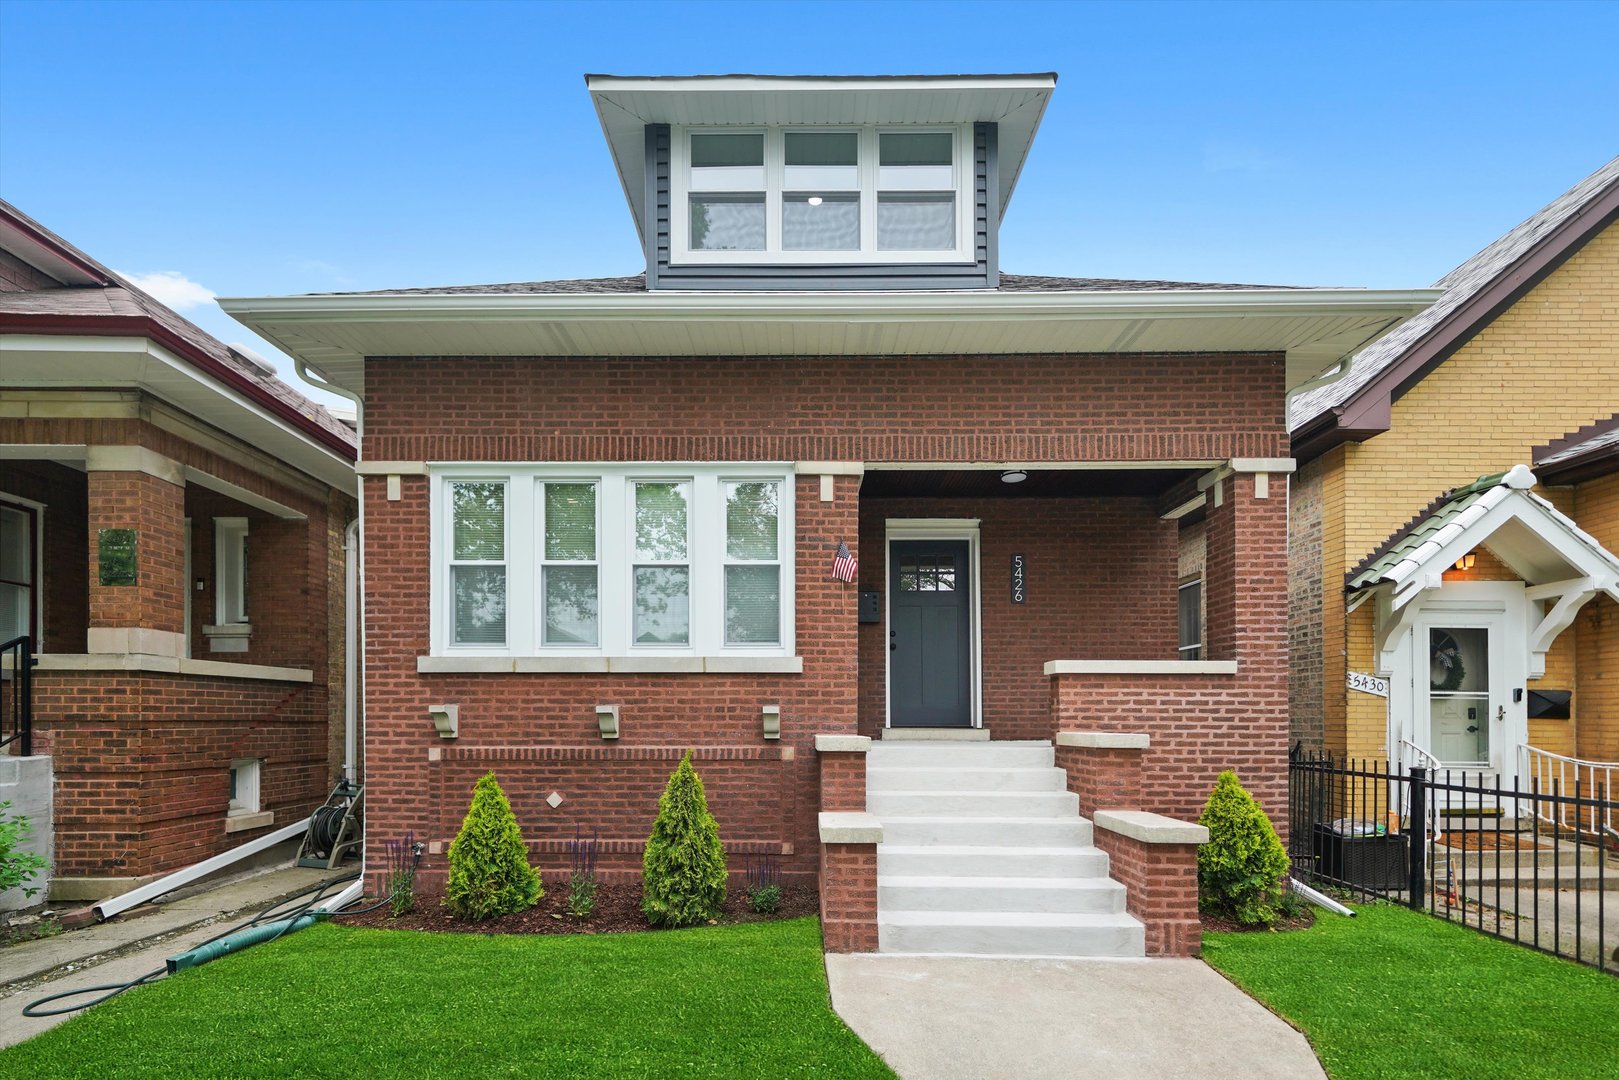
Active
$819,900
4
bds
|
3
ba
|
3,160
sqft
|
built
1924
5426 N Bernard St, Chicago, IL 60625
$-2,548
Cash flow
-16.2%
Cash-on-Cash Return
1.9%
Cap rate
0.3%
Rent to Value Ratio
Active
$375,000
3
bds
|
1
ba
|
1,131
sqft
|
built
1952
21W534 Bemis Rd, Glen Ellyn, IL 60137
$-346
Cash flow
-4.8%
Cash-on-Cash Return
4.6%
Cap rate
0.7%
Rent to Value Ratio
Active
$474,500
4
bds
|
3
ba
|
2,075
sqft
|
built
1949
3529 S 54th Ave, Cicero, IL 60804
$-670
Cash flow
-7.4%
Cash-on-Cash Return
4.0%
Cap rate
0.7%
Rent to Value Ratio
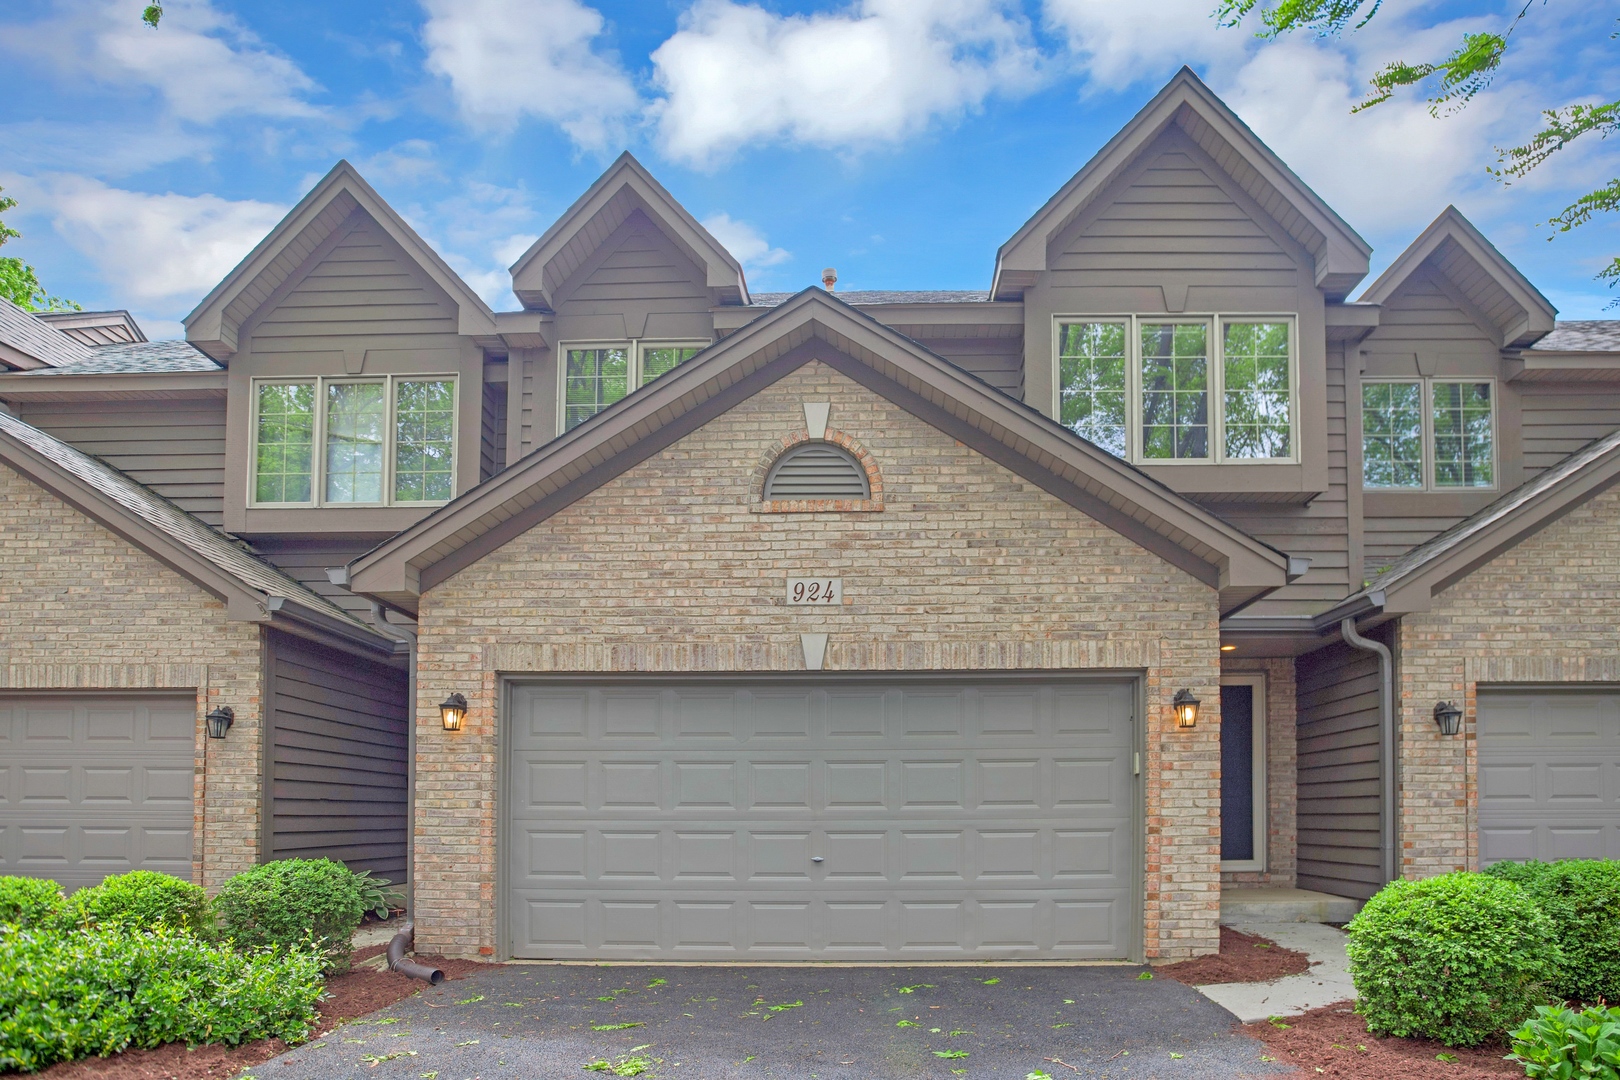
Active
$299,000
2
bds
|
2
ba
|
1,449
sqft
|
built
1993
924 Millcreek Cir, Elgin, IL 60123
$-559
Cash flow
-9.8%
Cash-on-Cash Return
3.4%
Cap rate
0.8%
Rent to Value Ratio
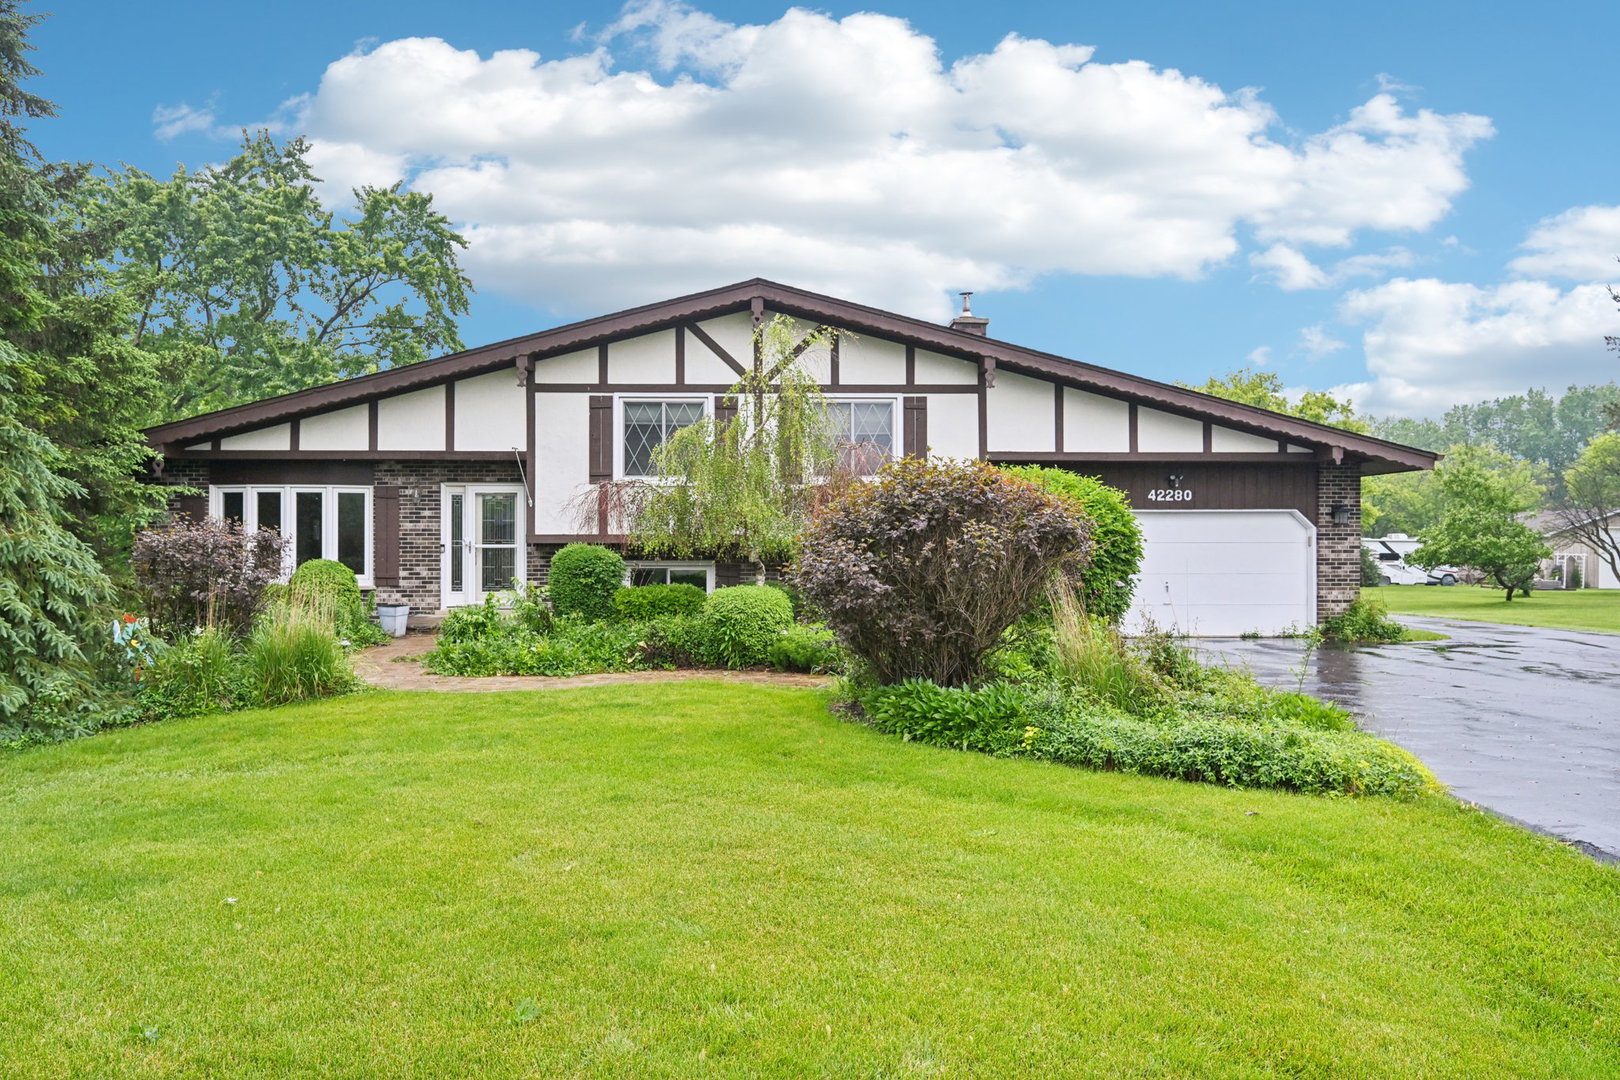
Active
$670,000
3
bds
|
3
ba
|
1,740
sqft
|
built
1978
42280 N Center St, Antioch, IL 60002
$-2,002
Cash flow
-15.6%
Cash-on-Cash Return
2.1%
Cap rate
0.4%
Rent to Value Ratio
Active
$285,000
3
bds
|
3
ba
|
1,701
sqft
|
built
2001
120 Presidential Blvd, Oswego, IL 60543
$-400
Cash flow
-7.3%
Cash-on-Cash Return
4.0%
Cap rate
0.8%
Rent to Value Ratio
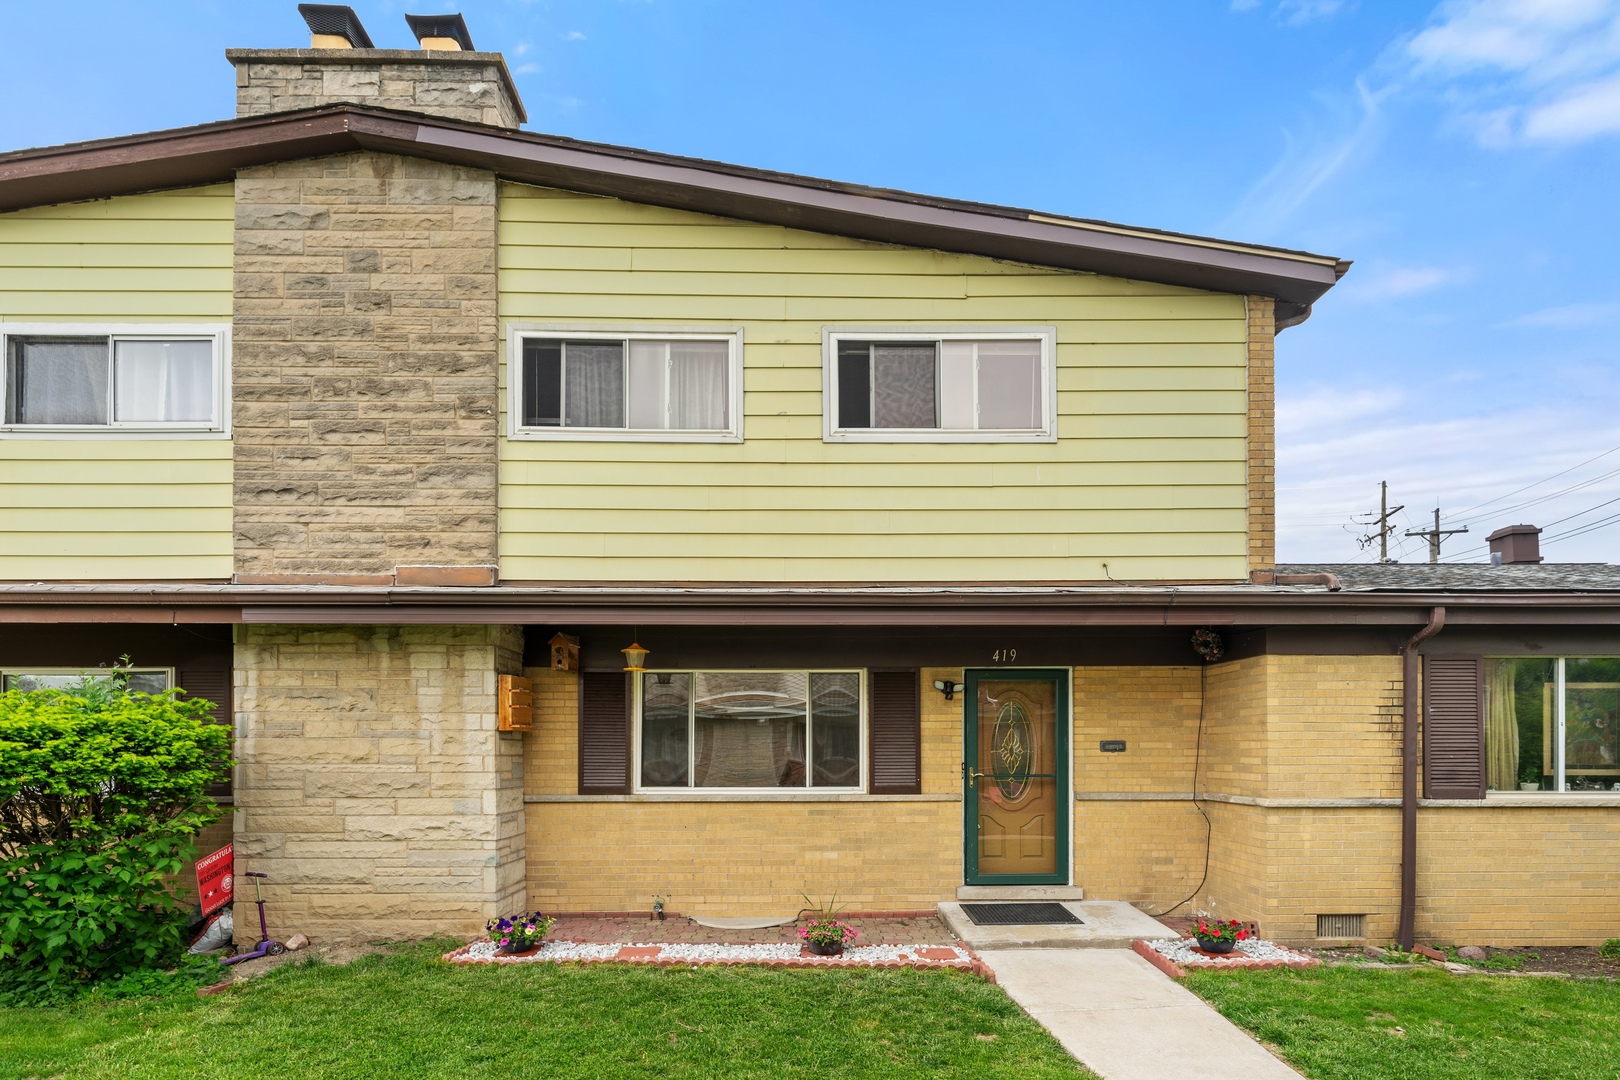
Active
$345,000
3
bds
|
3
ba
|
1,812
sqft
|
built
1962
419 Glenshire Rd, Glenview, IL 60025
$-231
Cash flow
-3.5%
Cash-on-Cash Return
4.9%
Cap rate
0.8%
Rent to Value Ratio
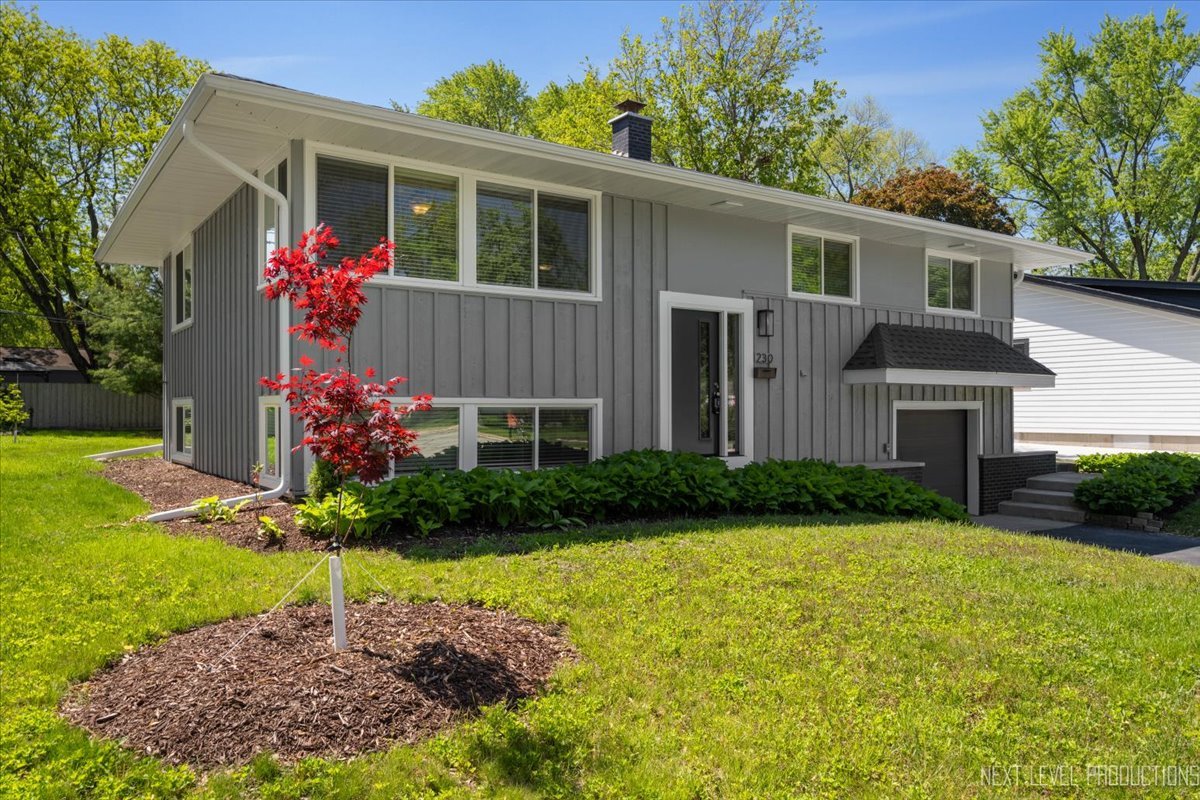
Active
$624,900
5
bds
|
3
ba
|
2,896
sqft
|
built
1959
230 Elmwood Dr, Naperville, IL 60540
$-1,239
Cash flow
-10.3%
Cash-on-Cash Return
3.3%
Cap rate
0.6%
Rent to Value Ratio
Active
$479,900
4
bds
|
4
ba
|
4,149
sqft
|
built
1973
10751 S Nashville Ave, Worth, IL 60482
$-870
Cash flow
-9.5%
Cash-on-Cash Return
3.5%
Cap rate
0.7%
Rent to Value Ratio
Active
$524,999
3
bds
|
3
ba
|
2,050
sqft
|
built
2024
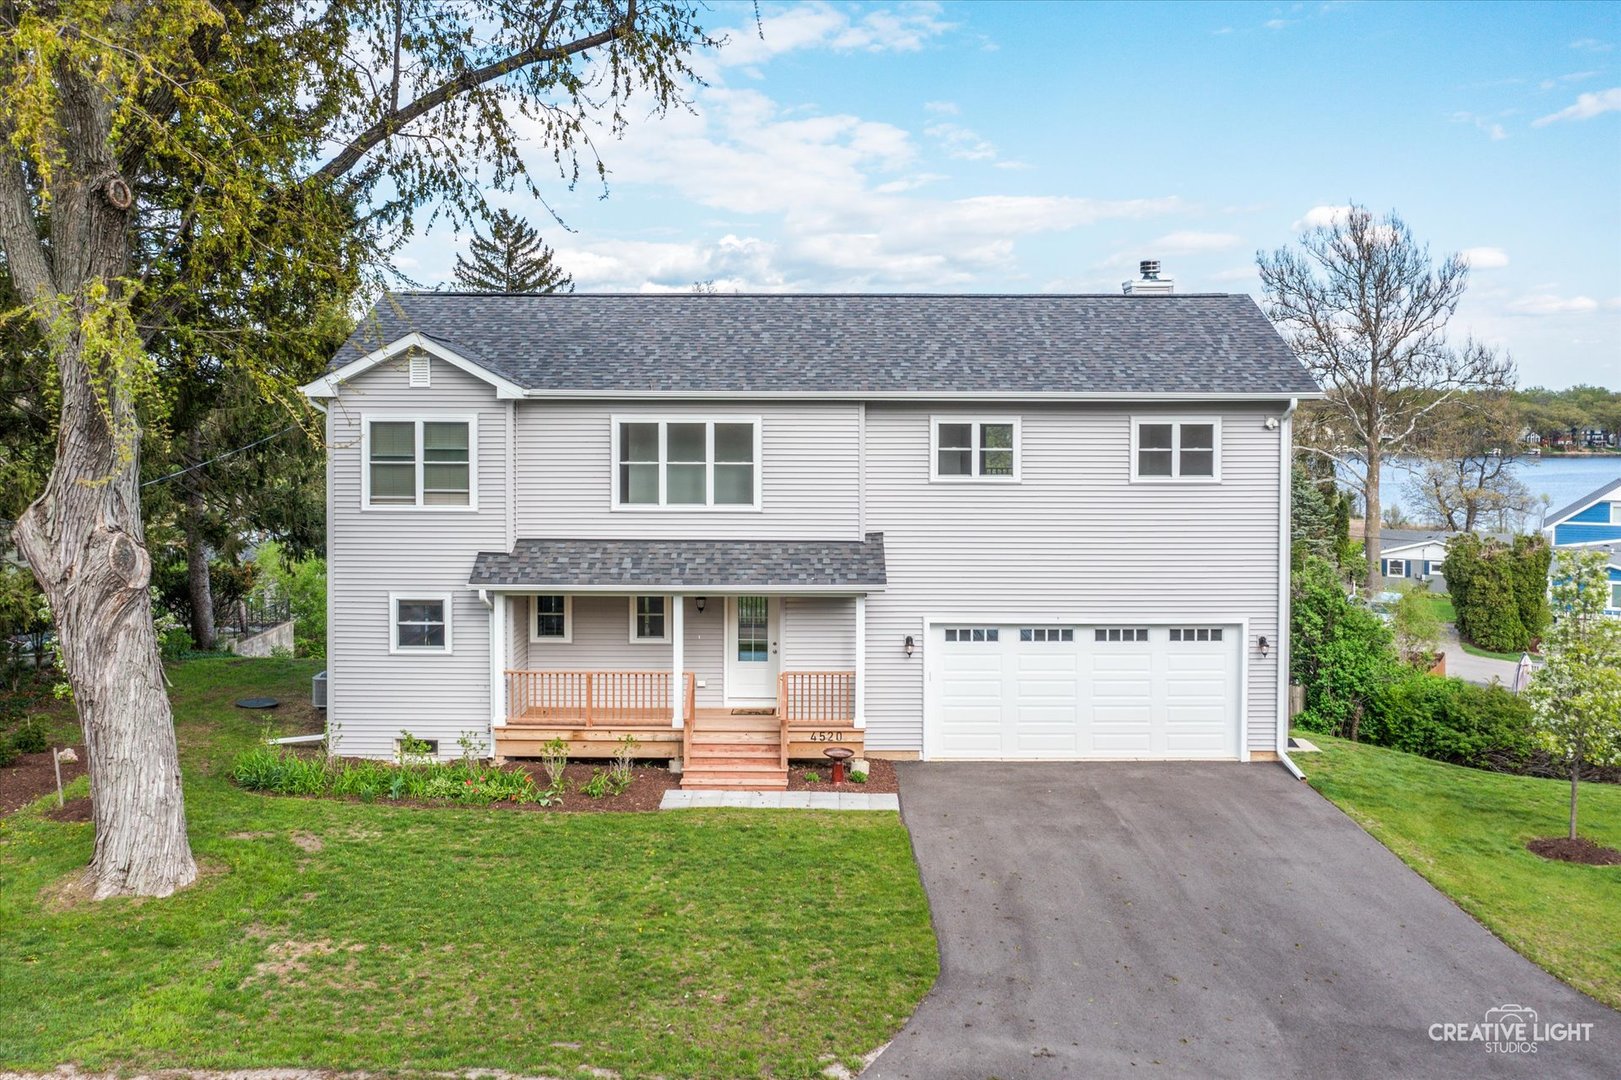
4520 W Shore Dr, Wonder Lake, IL 60097
$-388
Cash flow
-3.9%
Cash-on-Cash Return
4.8%
Cap rate
0.7%
Rent to Value Ratio
Active
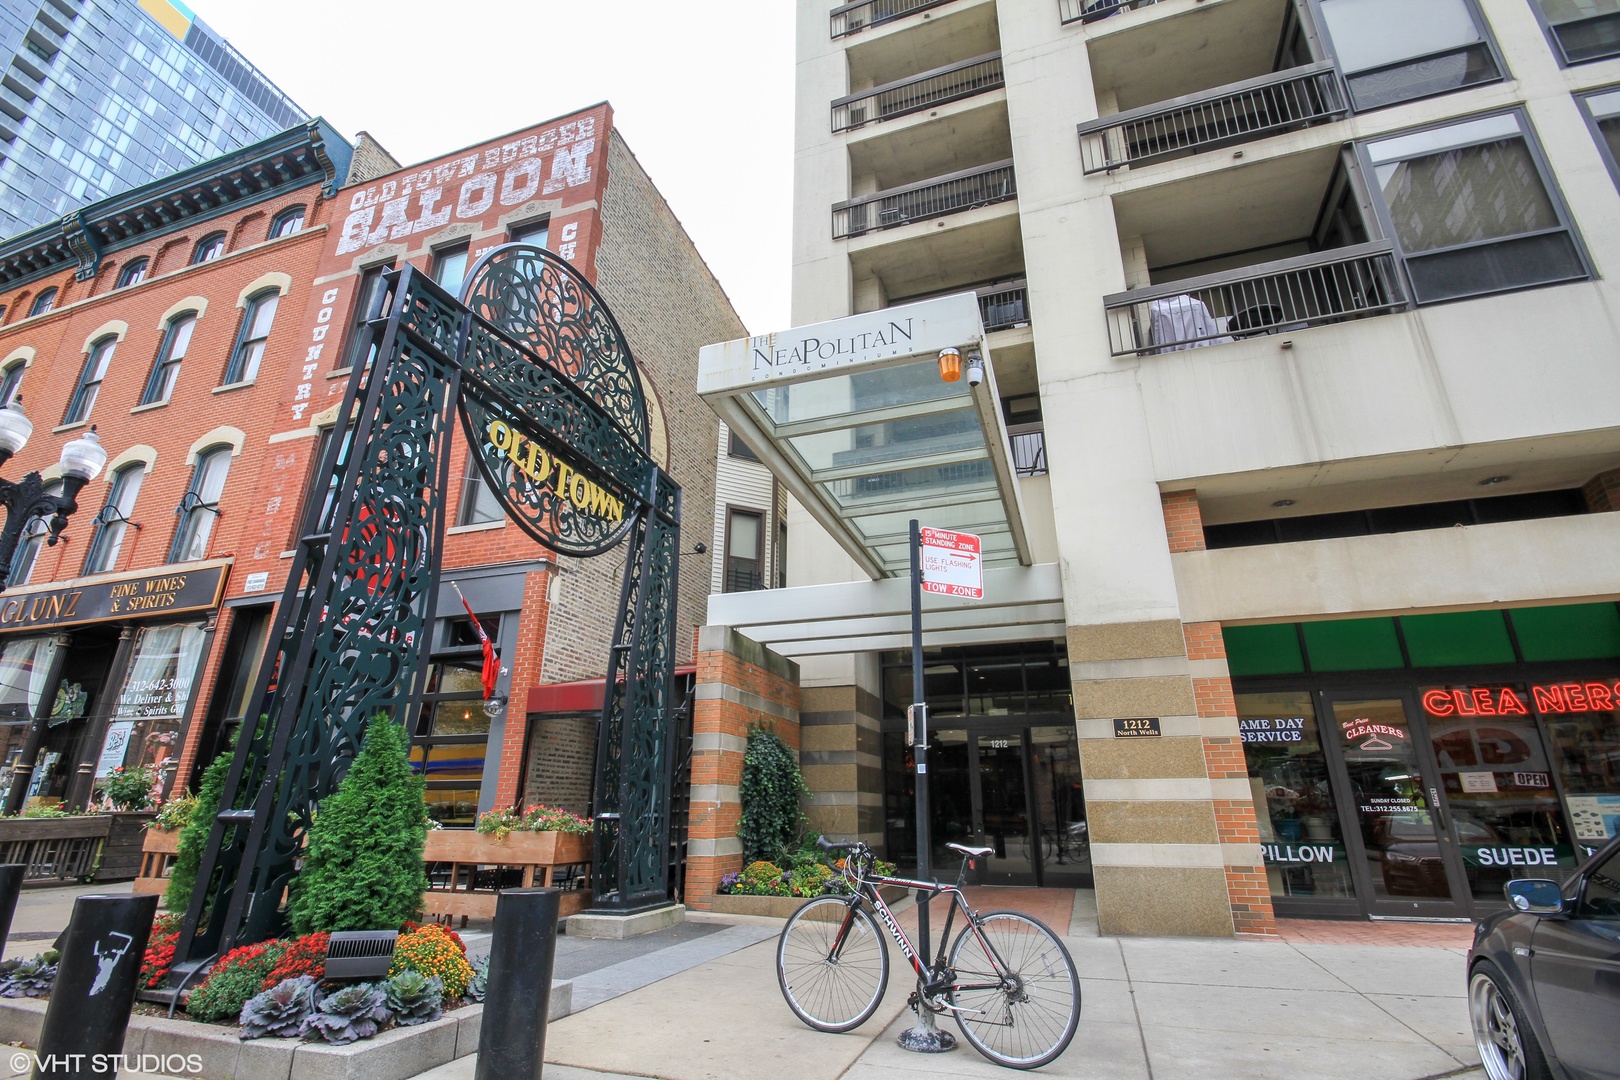
$485,000
2
bds
|
2
ba
|
1,450
sqft
|
built
2001
1212 N Wells St, Chicago, IL 60610
$-1,060
Cash flow
-11.4%
Cash-on-Cash Return
3.1%
Cap rate
0.8%
Rent to Value Ratio
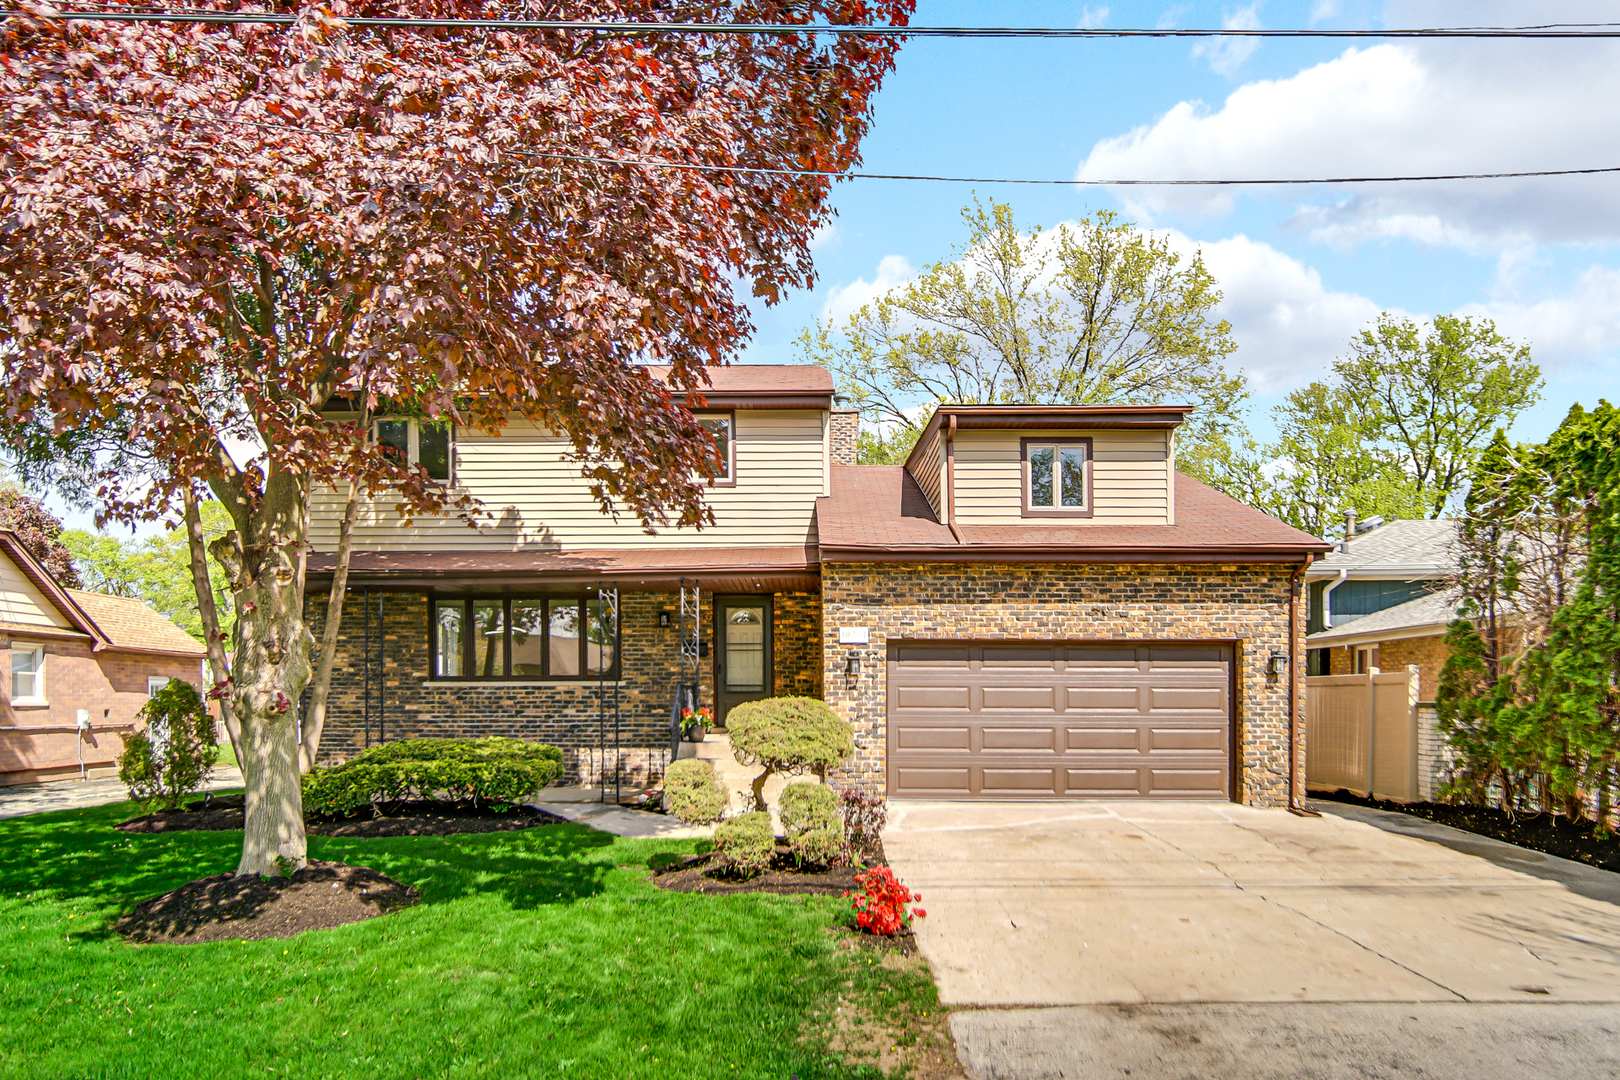
Active
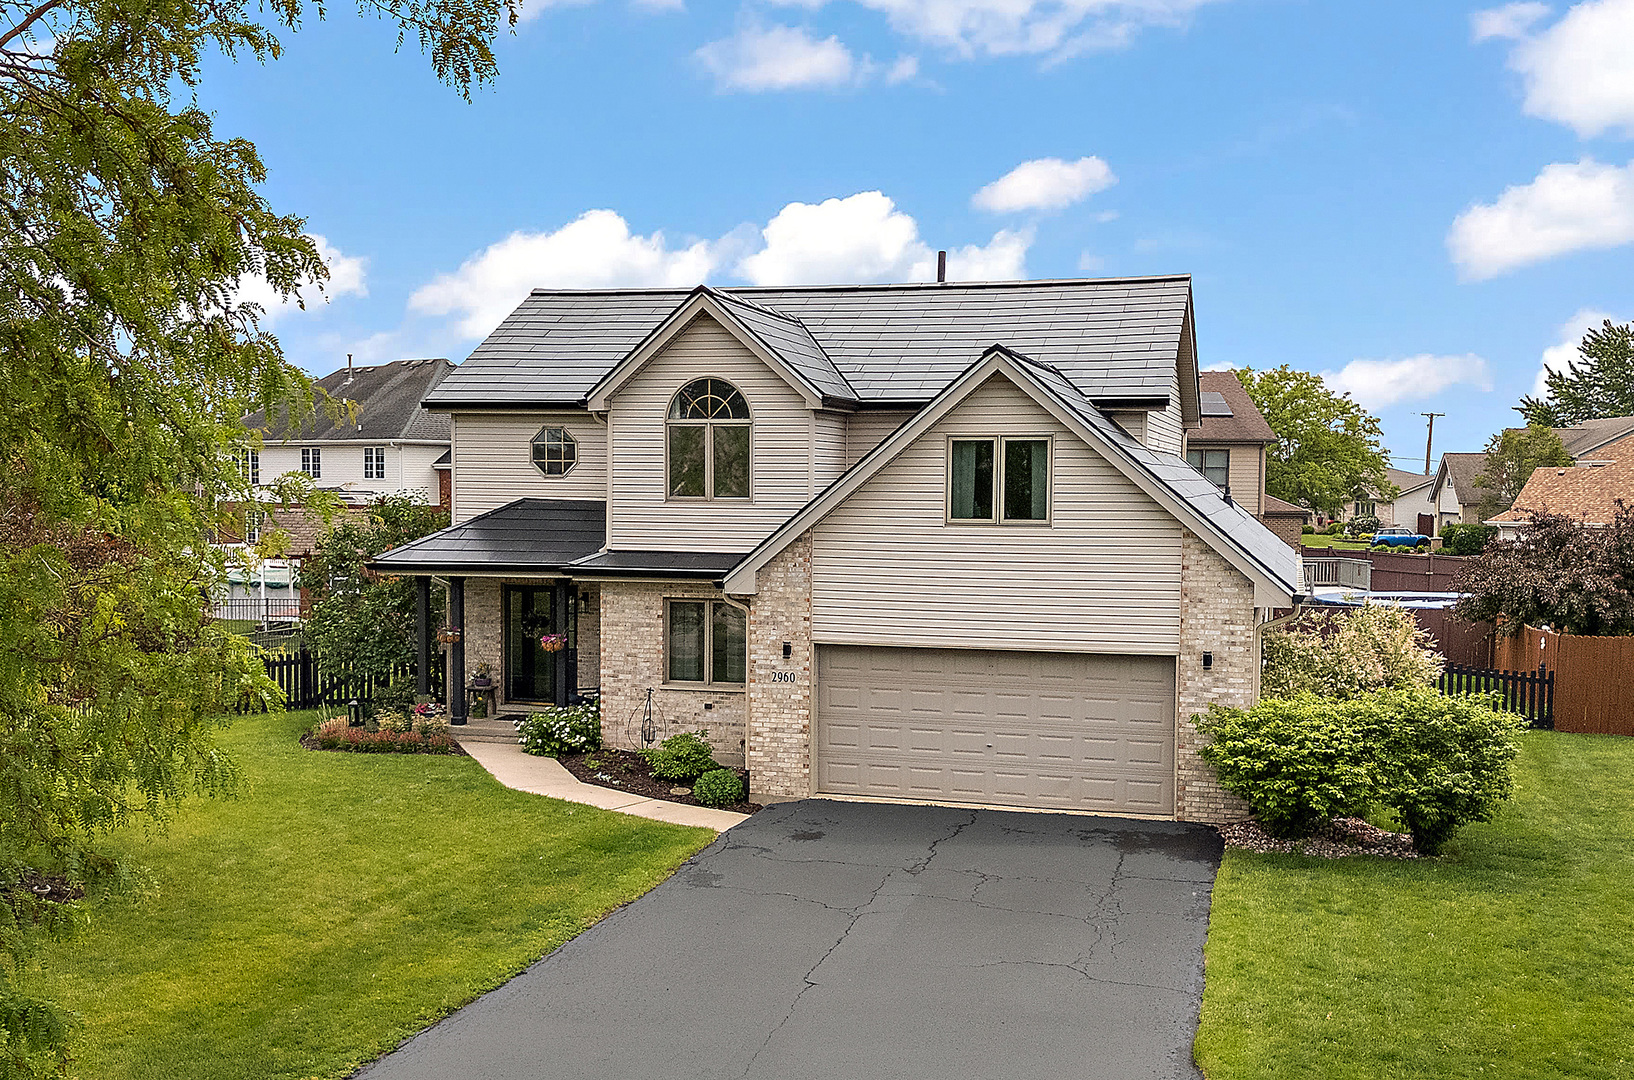
$475,000
3
bds
|
3
ba
|
2,540
sqft
|
built
2000
2960 Royal Ct, New Lenox, IL 60451
$-1,211
Cash flow
-13.3%
Cash-on-Cash Return
2.6%
Cap rate
0.6%
Rent to Value Ratio
Active
$2,490,000
6
bds
|
5
ba
|
5,900
sqft
|
built
2012
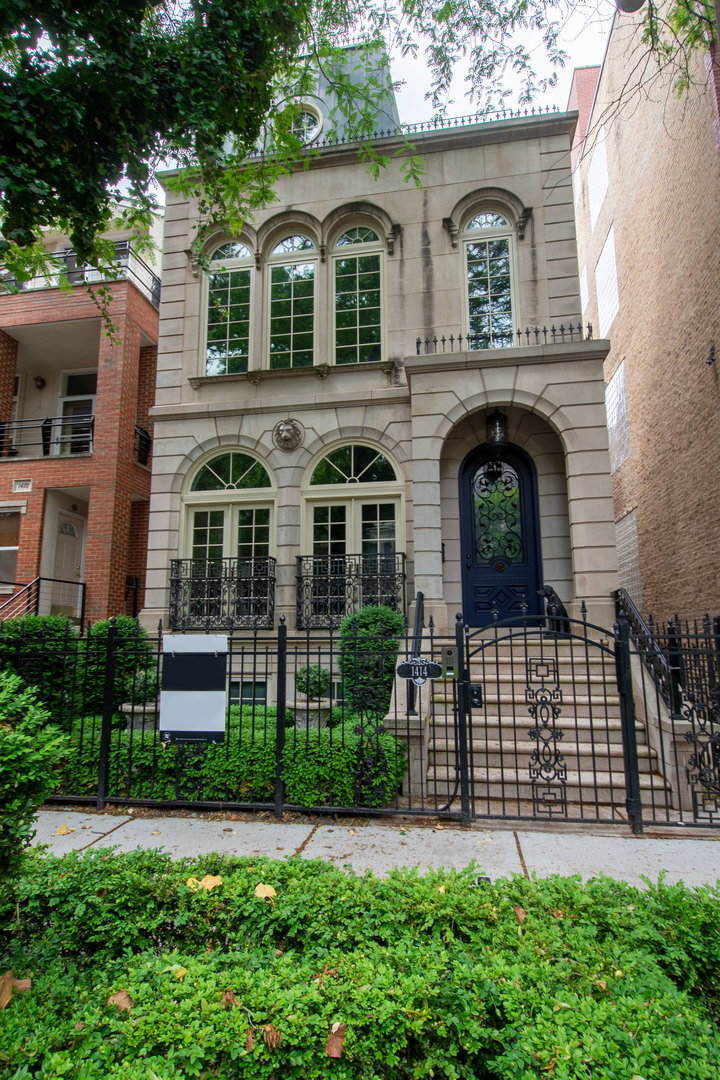
1414 N Mohawk St, Chicago, IL 60610
$-9,001
Cash flow
-18.9%
Cash-on-Cash Return
1.3%
Cap rate
0.4%
Rent to Value Ratio
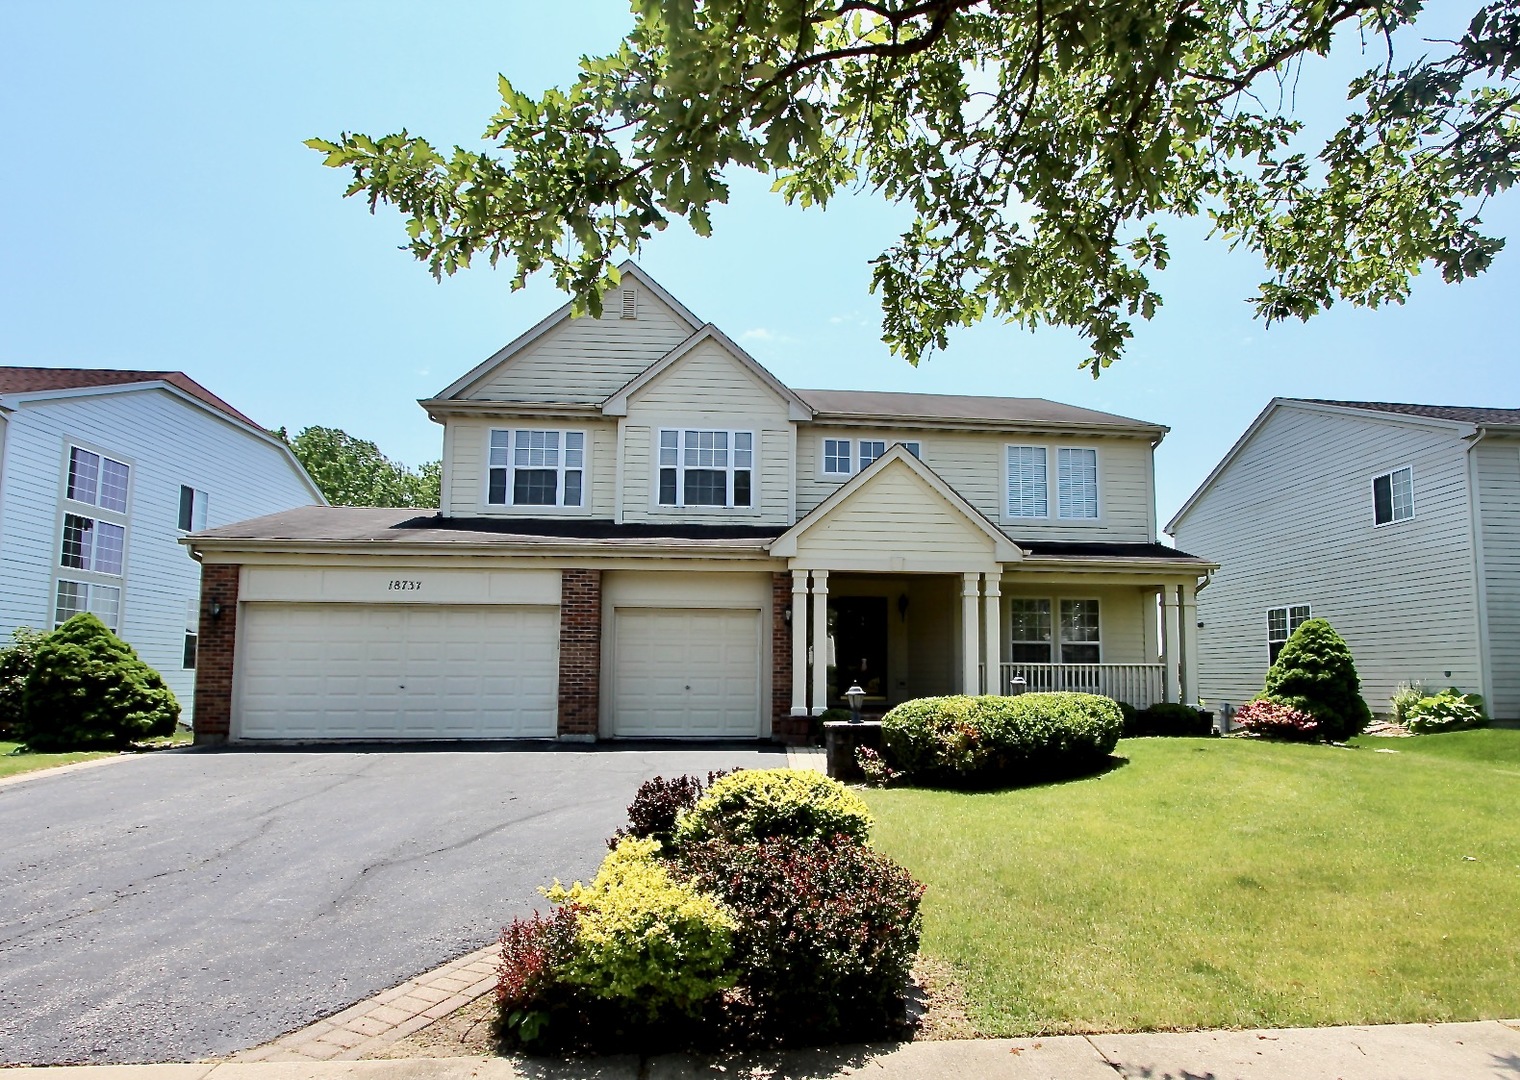
Active
$540,000
5
bds
|
4
ba
|
5,152
sqft
|
built
2004
18737 W Ash Dr, Lake Villa, IL 60046
$-1,237
Cash flow
-12.0%
Cash-on-Cash Return
2.9%
Cap rate
0.6%
Rent to Value Ratio
Active
$584,900
4
bds
|
4
ba
|
4,000
sqft
|
built
1990
172 Hamilton Ave, Frankfort, IL 60423
$-1,036
Cash flow
-9.2%
Cash-on-Cash Return
3.6%
Cap rate
0.7%
Rent to Value Ratio
Active
$889,000
5
bds
|
3
ba
|
4,252
sqft
|
built
2006
484 W Haleys Hill Ct, Palatine, IL 60074
$-1,740
Cash flow
-10.2%
Cash-on-Cash Return
3.3%
Cap rate
0.6%
Rent to Value Ratio
Active under contract
$299,900
2
bds
|
1
ba
|
1,311
sqft
|
built
1949
22628 W Silver Lake Ave, Antioch, IL 60002
$-569
Cash flow
-9.9%
Cash-on-Cash Return
3.4%
Cap rate
0.6%
Rent to Value Ratio
Active
$450,000
4
bds
|
3
ba
|
2,264
sqft
|
built
1998
2909 Savannah Dr, Aurora, IL 60502
$-840
Cash flow
-9.7%
Cash-on-Cash Return
3.4%
Cap rate
0.7%
Rent to Value Ratio
Active
$495,000
3
bds
|
2
ba
|
1,500
sqft
|
built
1955
1709 S Grace Ave, Park Ridge, IL 60068
$-1,005
Cash flow
-10.6%
Cash-on-Cash Return
3.2%
Cap rate
0.6%
Rent to Value Ratio
Active under contract
$194,900
2
bds
|
2
ba
|
1,200
sqft
|
built
1980
1717 W Crystal Ln, Mount Prospect, IL 60056
$-182
Cash flow
-4.9%
Cash-on-Cash Return
4.6%
Cap rate
1.0%
Rent to Value Ratio
Active
$300,000
2
bds
|
2
ba
|
1,100
sqft
|
built
1913
8 W Monroe St, Chicago, IL 60603
$-986
Cash flow
-17.1%
Cash-on-Cash Return
1.7%
Cap rate
0.9%
Rent to Value Ratio
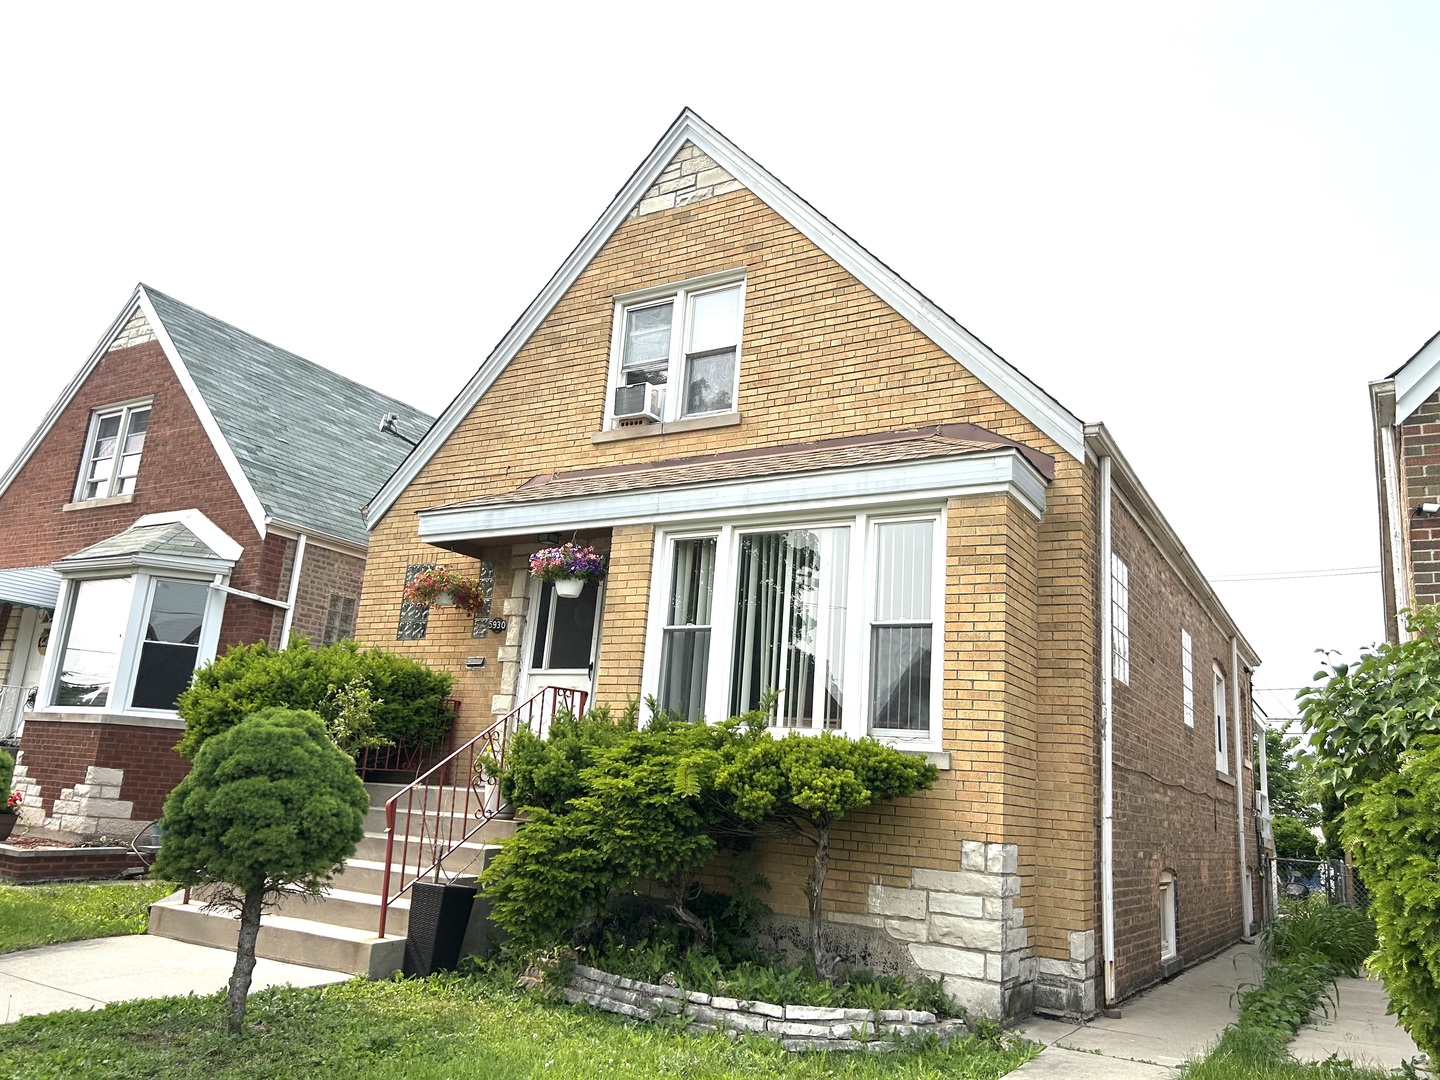
Active
$369,900
4
bds
|
3
ba
|
1,480
sqft
|
built
1954
5930 W School St, Chicago, IL 60634
$-100
Cash flow
-1.4%
Cash-on-Cash Return
5.4%
Cap rate
0.8%
Rent to Value Ratio
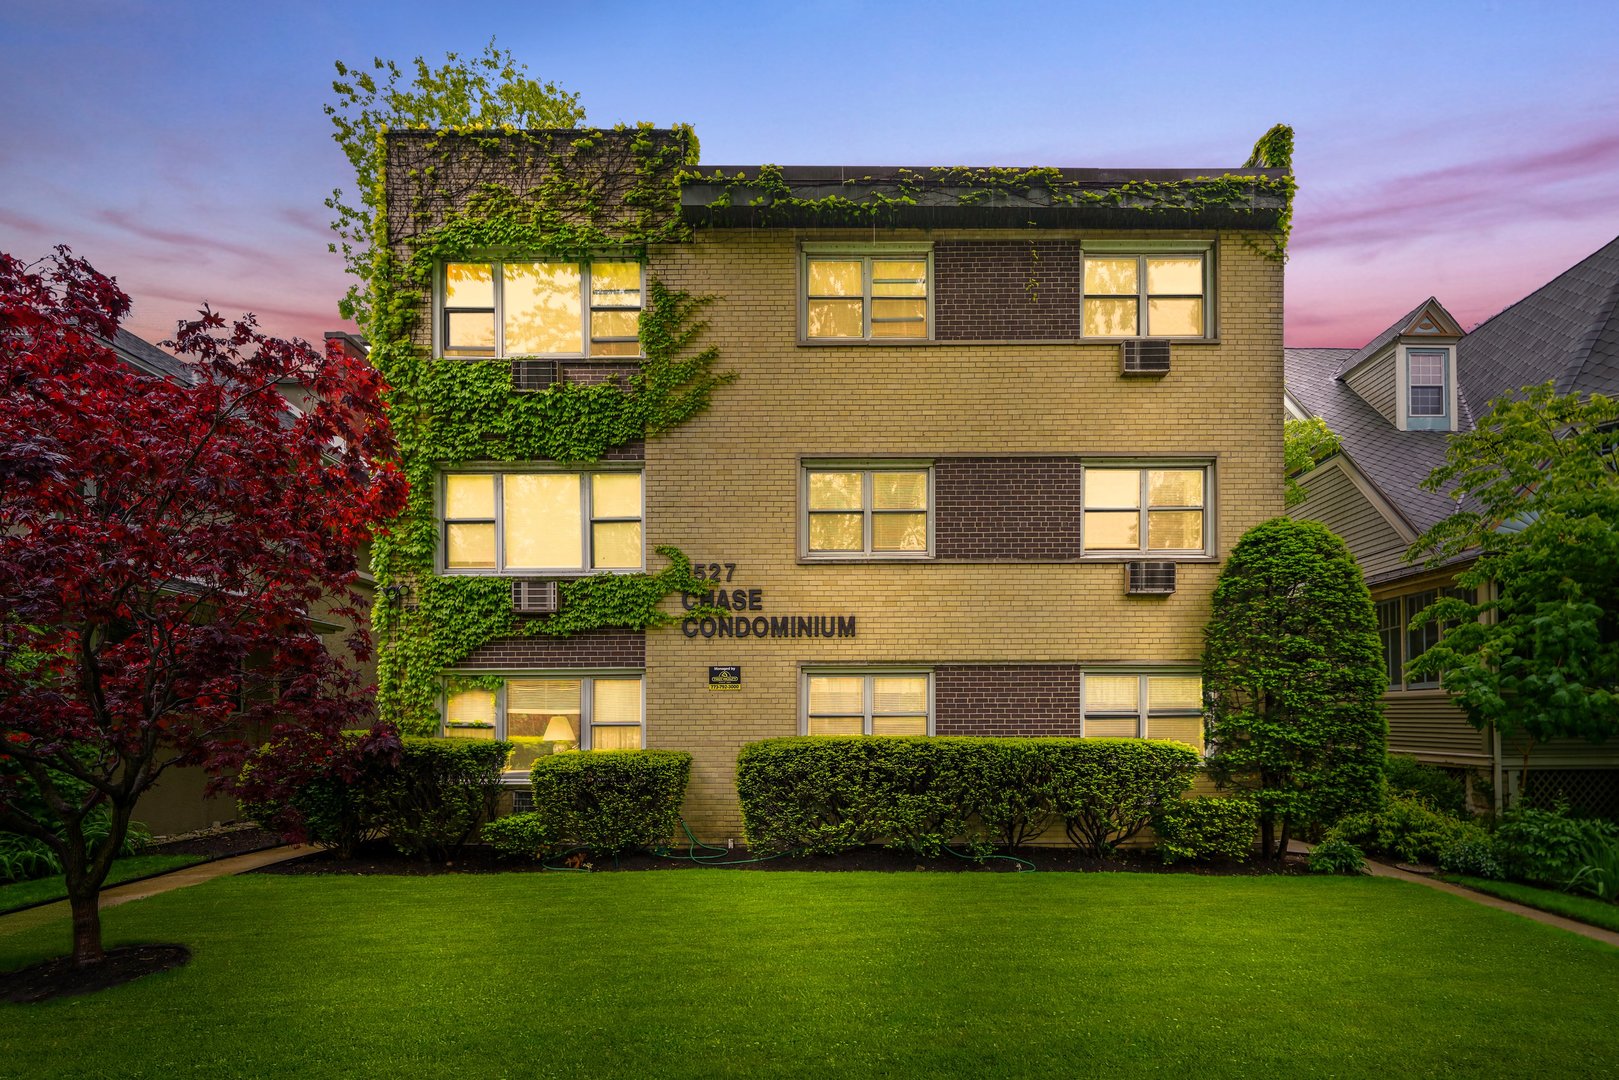
Active
$229,900
2
bds
|
2
ba
|
1,028
sqft
|
built
1971
1527 W Chase Ave, Chicago, IL 60626
$-16
Cash flow
-0.4%
Cash-on-Cash Return
5.6%
Cap rate
0.8%
Rent to Value Ratio
Active
$1,150,000
7
bds
|
3
ba
|
0
sqft
|
built
1891
2014 N Whipple St, Chicago, IL 60647
$-4,099
Cash flow
-18.6%
Cash-on-Cash Return
1.4%
Cap rate
0.3%
Rent to Value Ratio
Active
$369,000
3
bds
|
2
ba
|
1,290
sqft
|
built
1929
14 E Madison St, Villa Park, IL 60181
$-322
Cash flow
-4.6%
Cash-on-Cash Return
4.6%
Cap rate
0.8%
Rent to Value Ratio
Active
$167,000
1
bds
|
1
ba
|
900
sqft
|
built
1962
4250 N Marine Dr, Chicago, IL 60613
$-443
Cash flow
-13.8%
Cash-on-Cash Return
2.5%
Cap rate
1.2%
Rent to Value Ratio
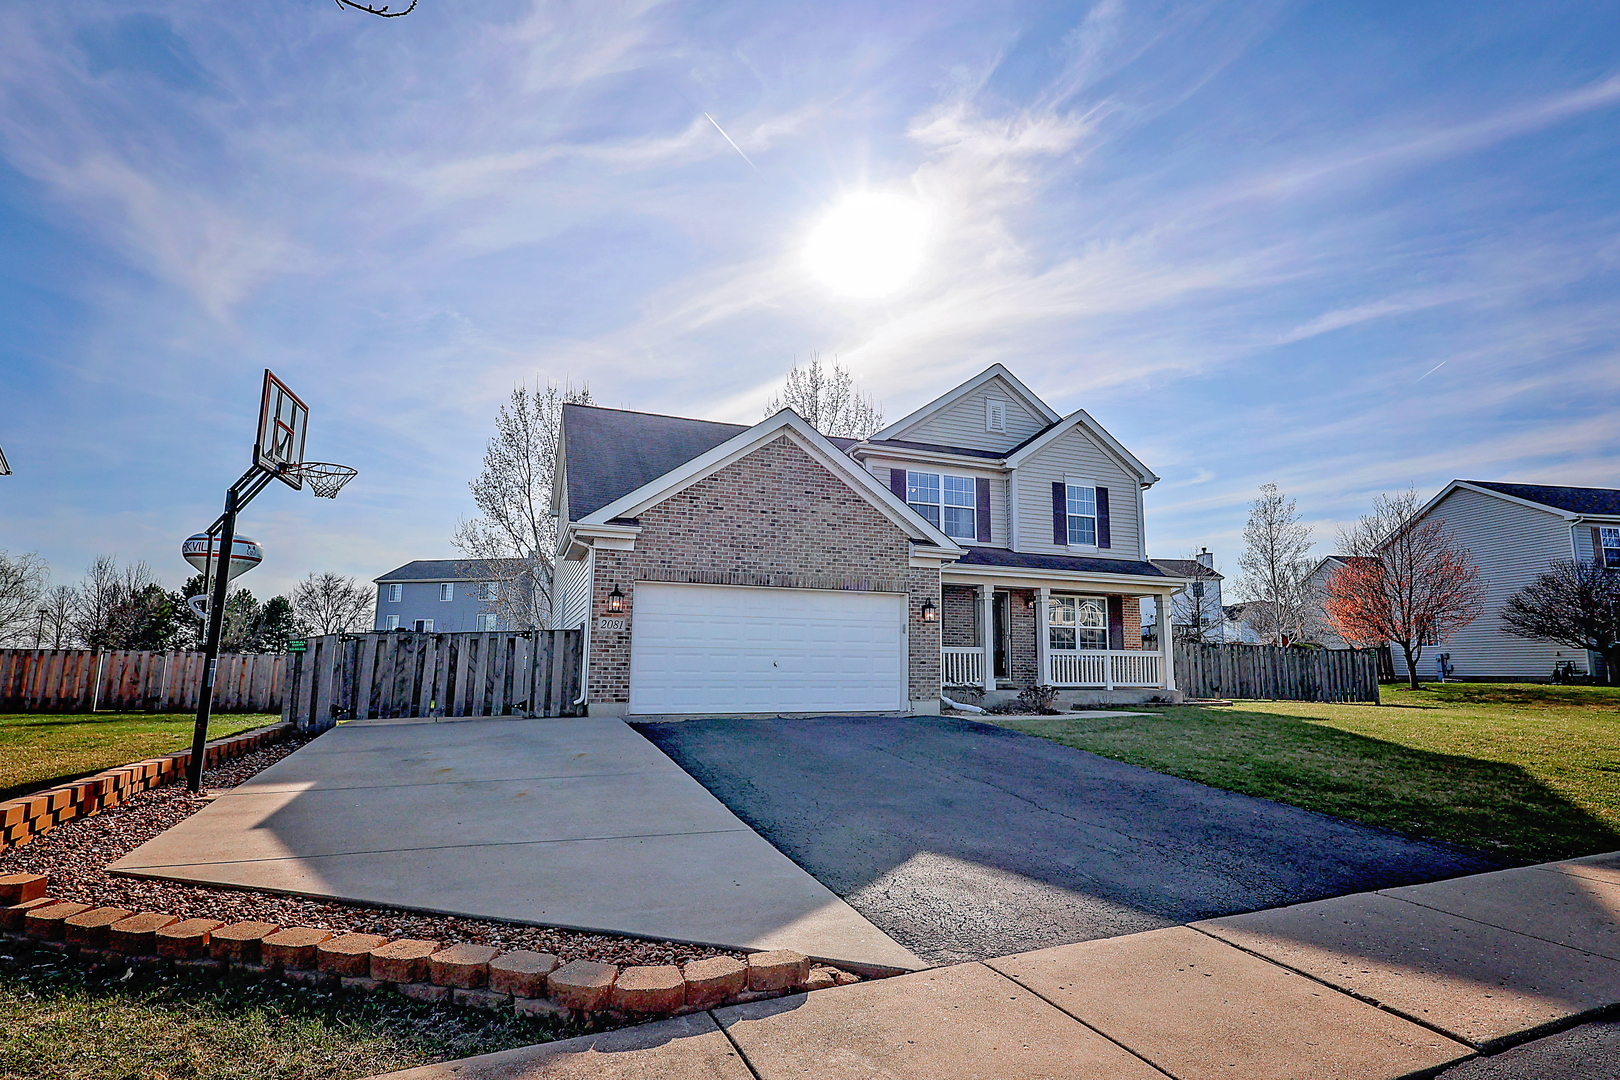
Active
$439,900
4
bds
|
4
ba
|
2,509
sqft
|
built
2006
2081 Ingemunson Ln, Yorkville, IL 60560
$-860
Cash flow
-10.2%
Cash-on-Cash Return
3.3%
Cap rate
0.7%
Rent to Value Ratio
Active
$210,000
3
bds
|
2
ba
|
1,250
sqft
|
built
1969
605 Saginaw Ave, Calumet City, IL 60409
$401
Cash flow
10.0%
Cash-on-Cash Return
8.0%
Cap rate
1.0%
Rent to Value Ratio
Active
$349,000
4
bds
|
3
ba
|
2,091
sqft
|
built
1938
24311 N Bonnie Ln, Lake Zurich, IL 60047
$232
Cash flow
3.5%
Cash-on-Cash Return
6.5%
Cap rate
1.0%
Rent to Value Ratio

Pending
$190,000
3
bds
|
2
ba
|
1,160
sqft
|
built
1982
347 Meadow Green Ln, Round Lake Beach, IL 60073
$-182
Cash flow
-5.0%
Cash-on-Cash Return
4.5%
Cap rate
1.0%
Rent to Value Ratio
Active
$380,000
4
bds
|
3
ba
|
2,133
sqft
|
built
2005
838 Valley Stream Dr, Pingree Grove, IL 60140
$-580
Cash flow
-8.0%
Cash-on-Cash Return
3.8%
Cap rate
0.8%
Rent to Value Ratio
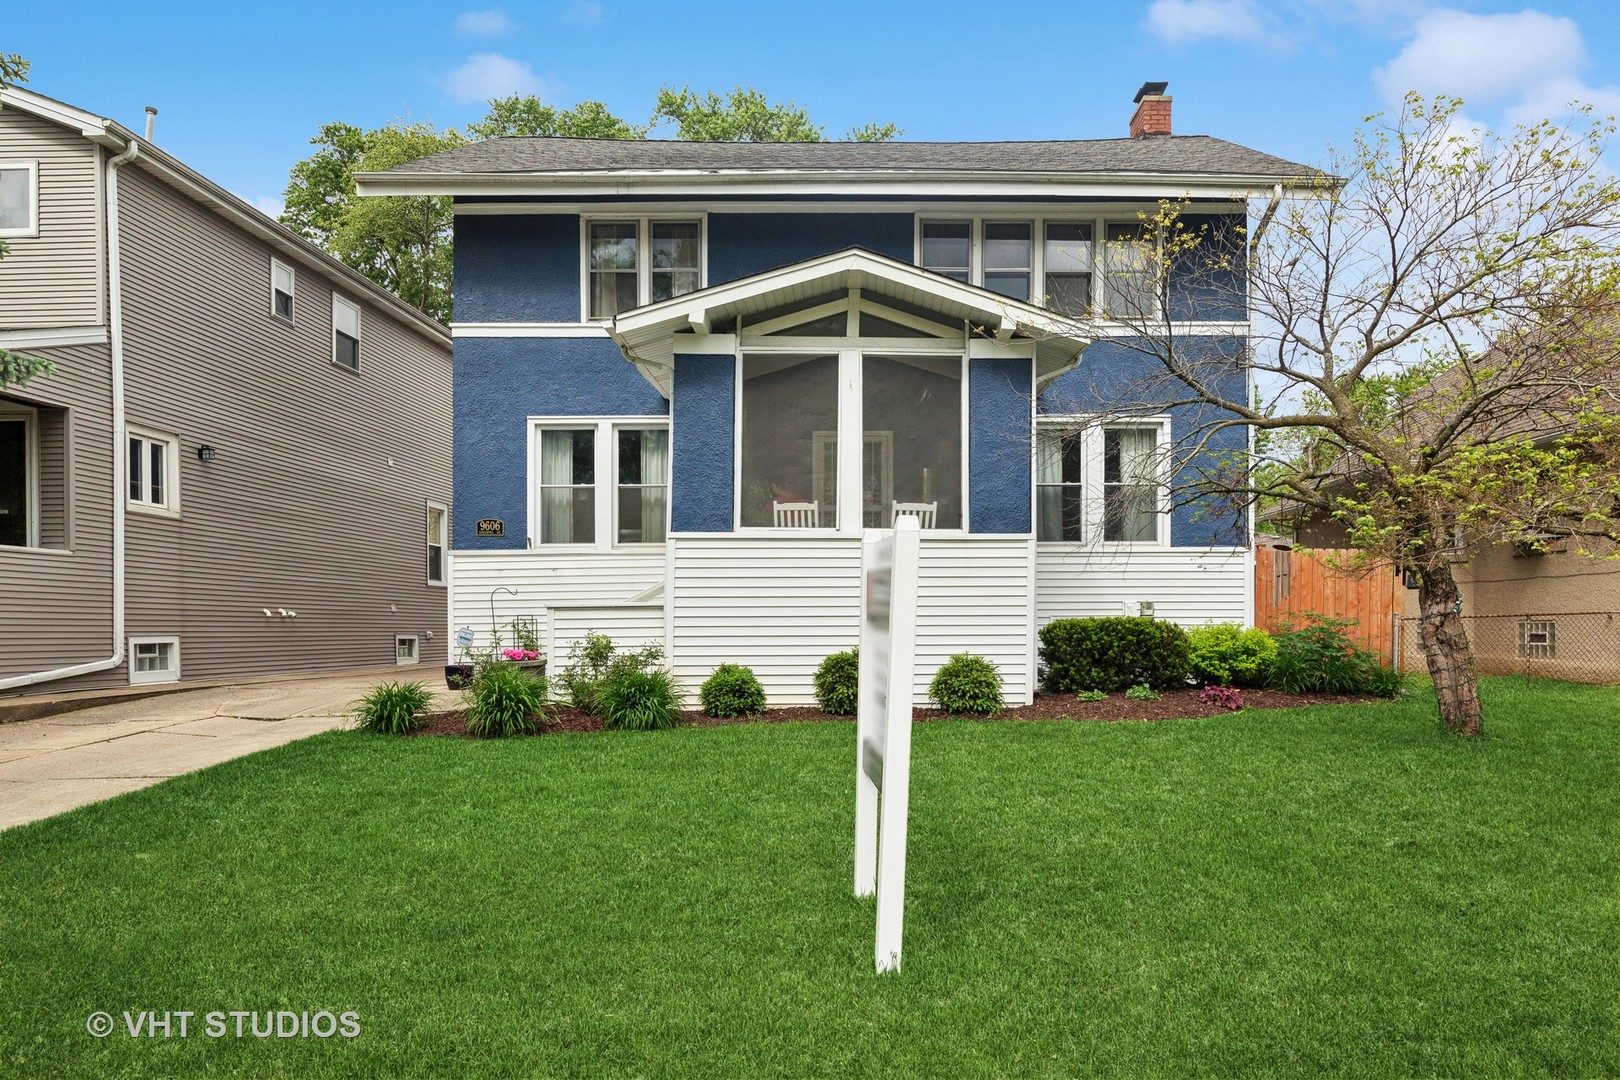
Active
$445,000
4
bds
|
2
ba
|
2,182
sqft
|
built
1911
9606 S Vanderpoel Ave, Chicago, IL 60643
$-145
Cash flow
-1.7%
Cash-on-Cash Return
5.3%
Cap rate
0.8%
Rent to Value Ratio
Active under contract
$2,850,000
6
bds
|
6
ba
|
6,868
sqft
|
built
1989
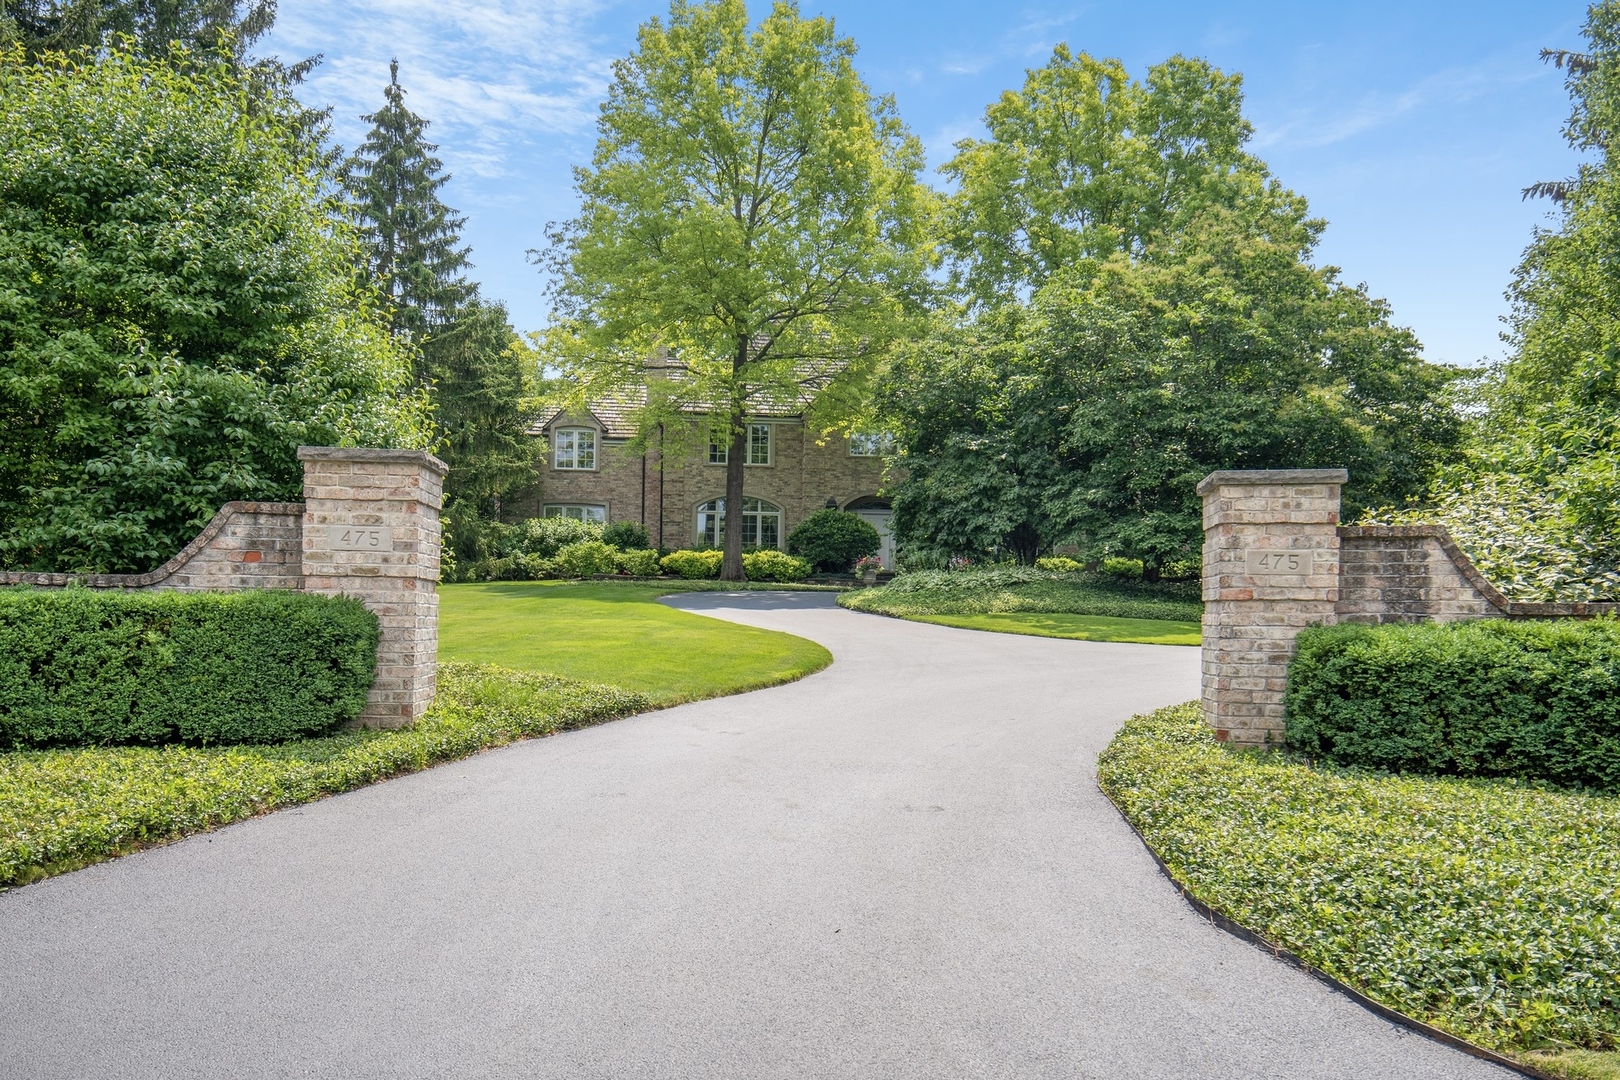
475 Red Fox Ln, Lake Forest, IL 60045
$-10,284
Cash flow
-18.8%
Cash-on-Cash Return
1.3%
Cap rate
0.4%
Rent to Value Ratio
Active
$620,000
4
bds
|
3
ba
|
0
sqft
|
built
1950
2417 Lyons St, Evanston, IL 60201
$-1,296
Cash flow
-10.9%
Cash-on-Cash Return
3.2%
Cap rate
0.6%
Rent to Value Ratio
Active
$245,000
3
bds
|
2
ba
|
1,302
sqft
|
built
1970
110 W Butterfield Rd, Elmhurst, IL 60126
$-619
Cash flow
-13.2%
Cash-on-Cash Return
2.6%
Cap rate
1.0%
Rent to Value Ratio
Active
$849,000
3
bds
|
2
ba
|
1,800
sqft
|
built
2006
849 N Franklin St, Chicago, IL 60610
$-2,858
Cash flow
-17.6%
Cash-on-Cash Return
1.6%
Cap rate
0.6%
Rent to Value Ratio
Active
$289,900
3
bds
|
2
ba
|
0
sqft
|
built
1919
7633 N Greenview Ave, Chicago, IL 60626
$-344
Cash flow
-6.2%
Cash-on-Cash Return
4.3%
Cap rate
0.9%
Rent to Value Ratio
Active
$364,900
2
bds
|
3
ba
|
1,373
sqft
|
built
2007
19242 104th Ave, Mokena, IL 60448
$-400
Cash flow
-5.7%
Cash-on-Cash Return
4.4%
Cap rate
0.8%
Rent to Value Ratio
Active
$180,000
1
bds
|
1
ba
|
800
sqft
|
built
1932
6171 N Sheridan Rd, Chicago, IL 60660
$-430
Cash flow
-12.5%
Cash-on-Cash Return
2.8%
Cap rate
1.1%
Rent to Value Ratio