Illinois Investment Properties for Sale
Browse homes for sale and investment properties in Illinois. Refine your search by price, property type, or more.
Best cash flowing properties in Illinois
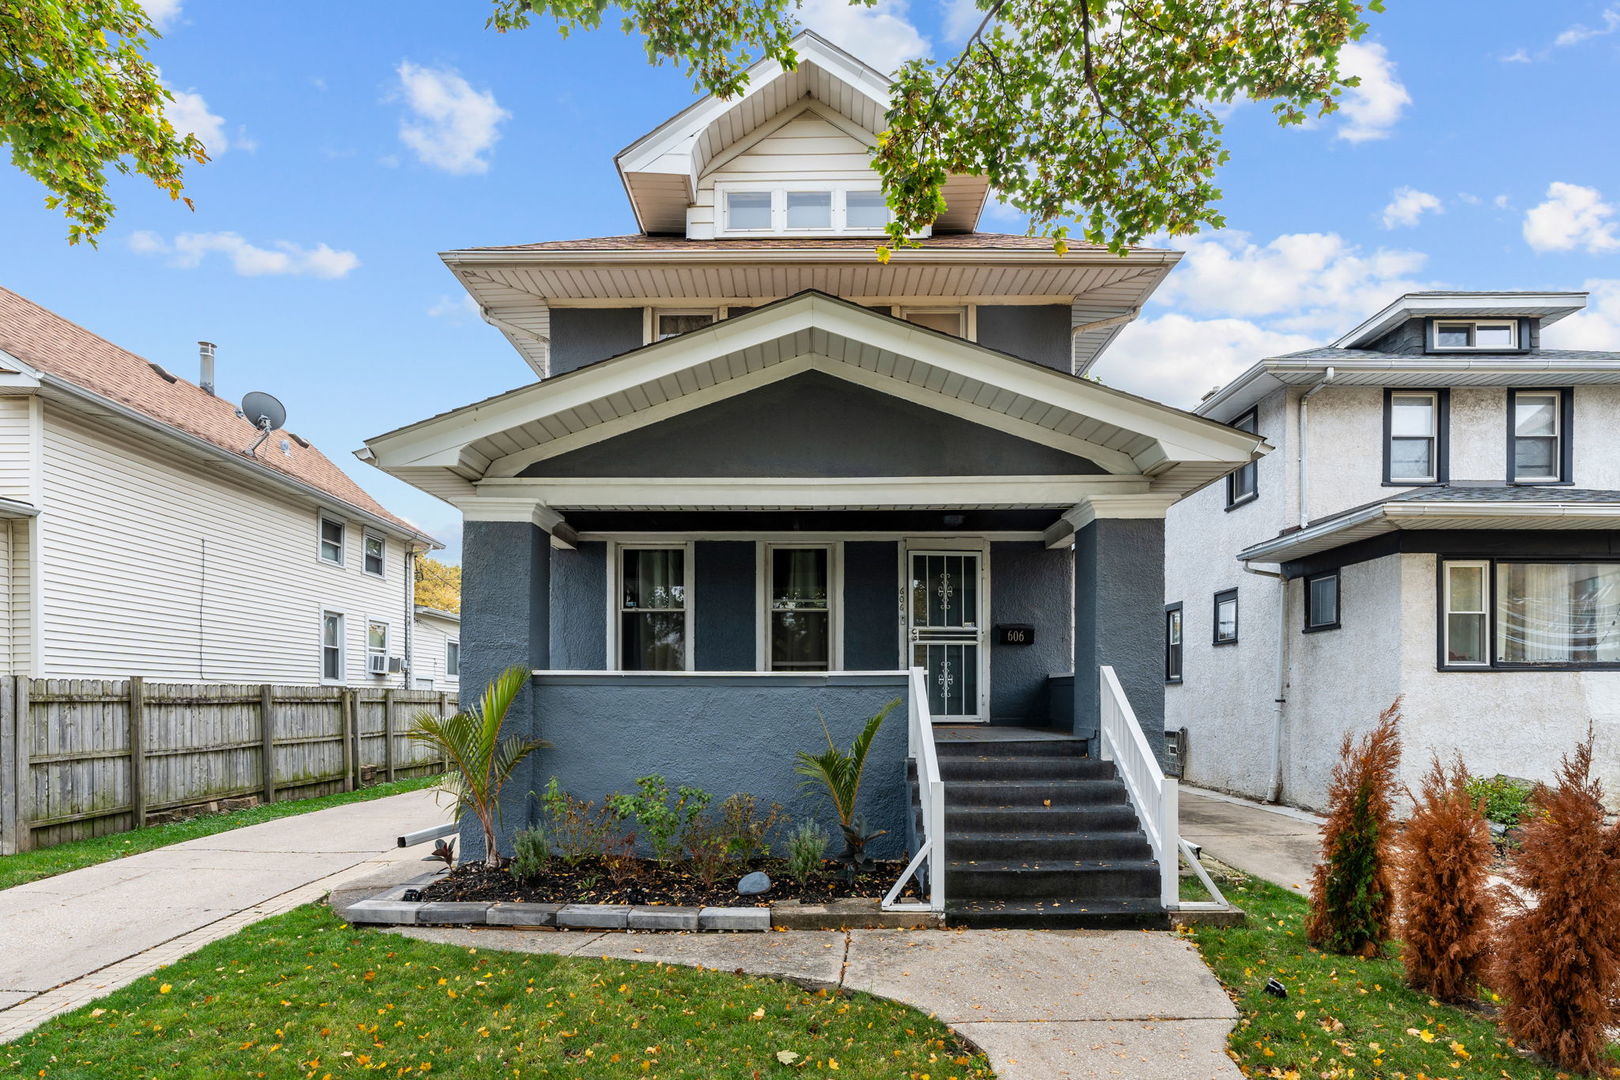
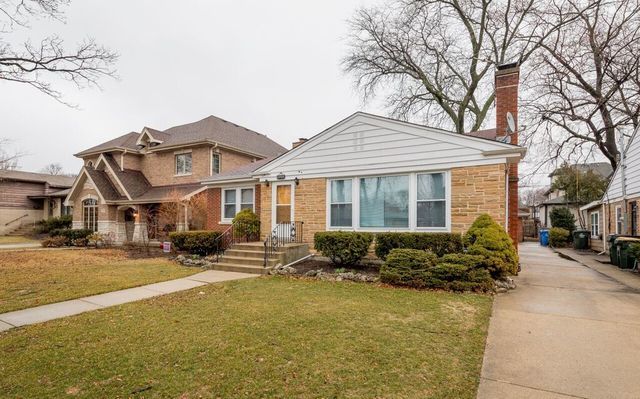
Active
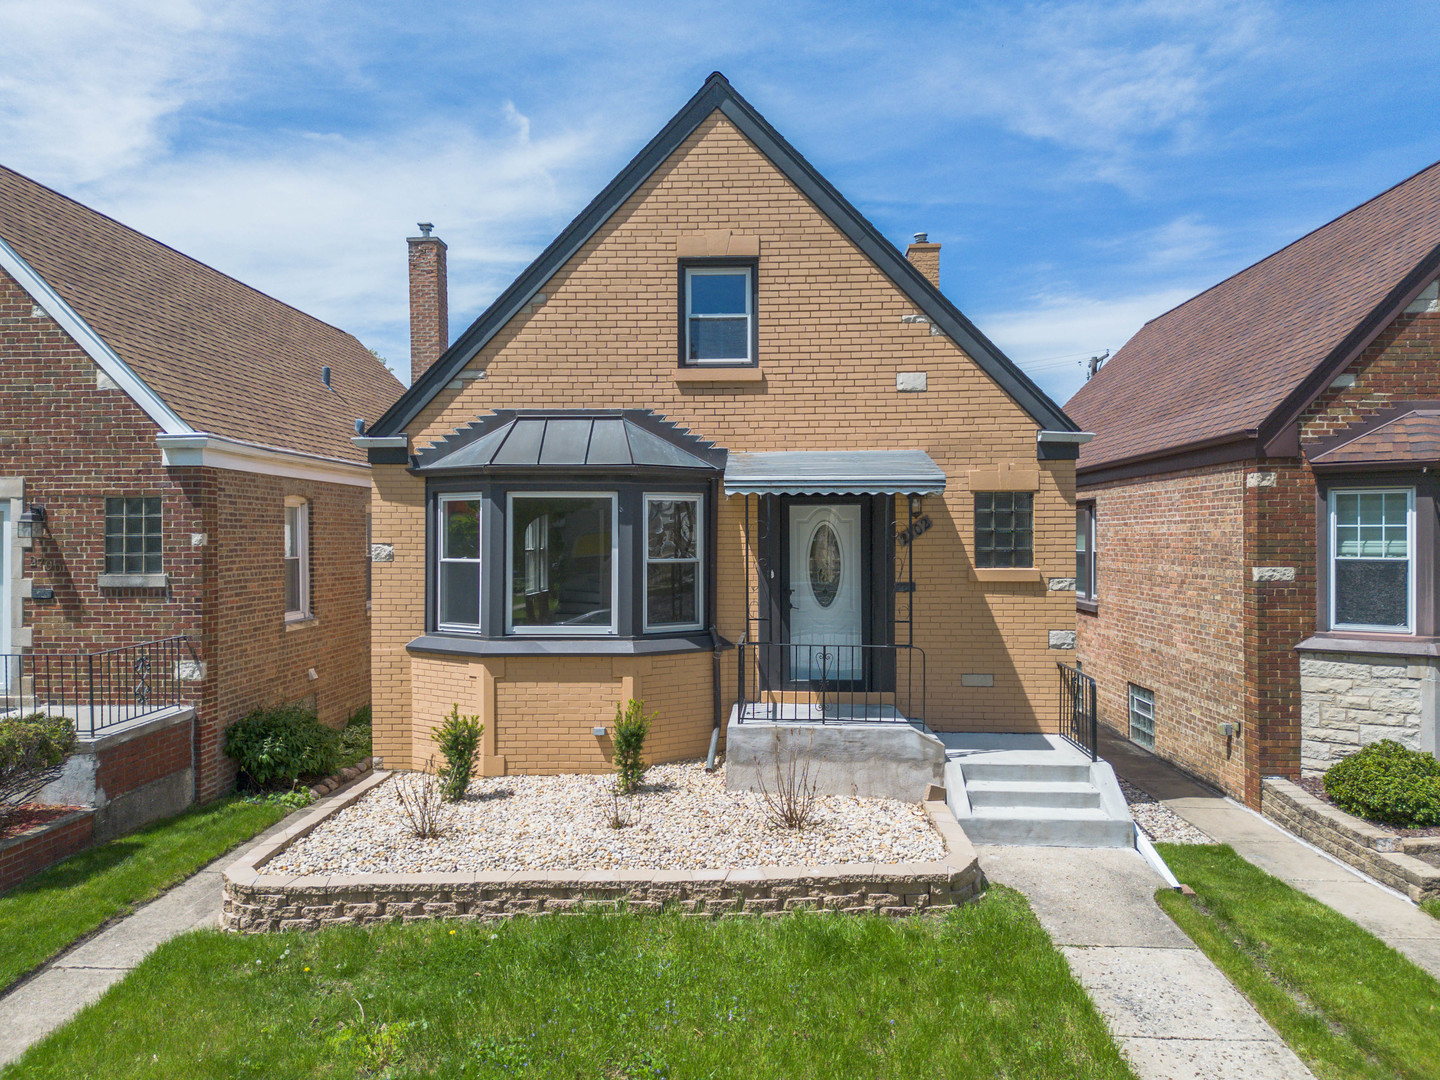
$385,000
3
bds
|
3
ba
|
2,000
sqft
|
built
1918
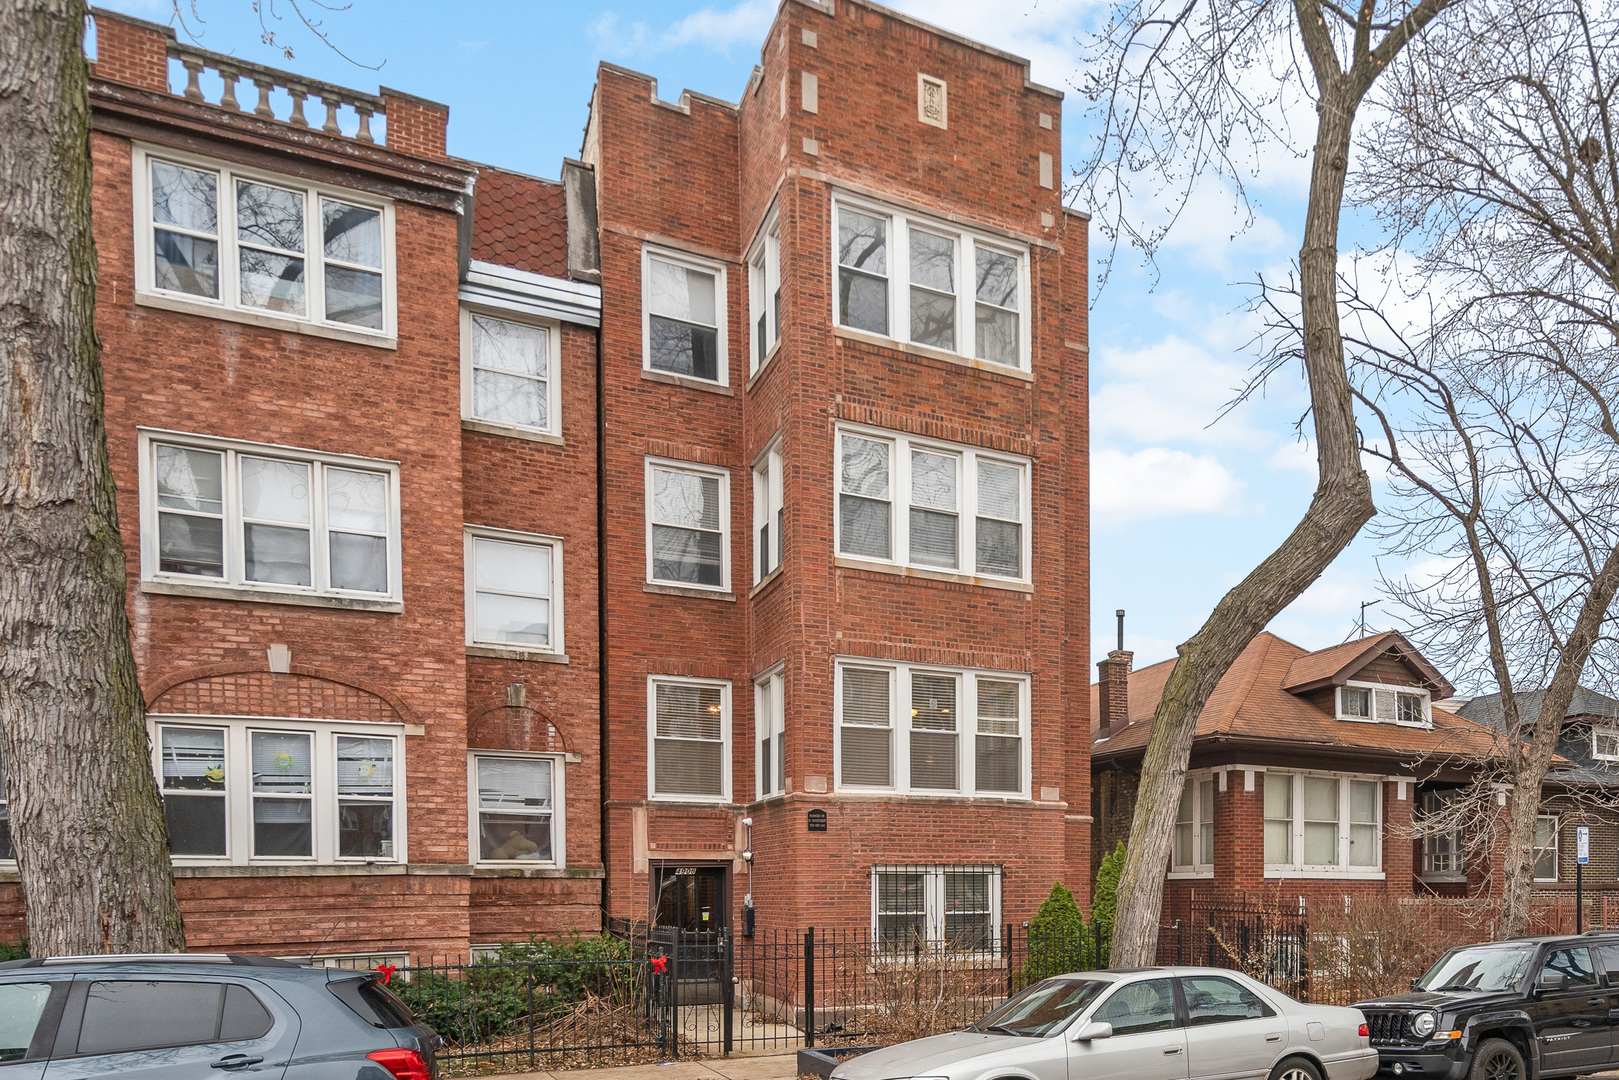
606 S 2nd Ave, Maywood, IL 60153
$224
Cash flow
3.0%
Cash-on-Cash Return
6.4%
Cap rate
0.9%
Rent to Value Ratio
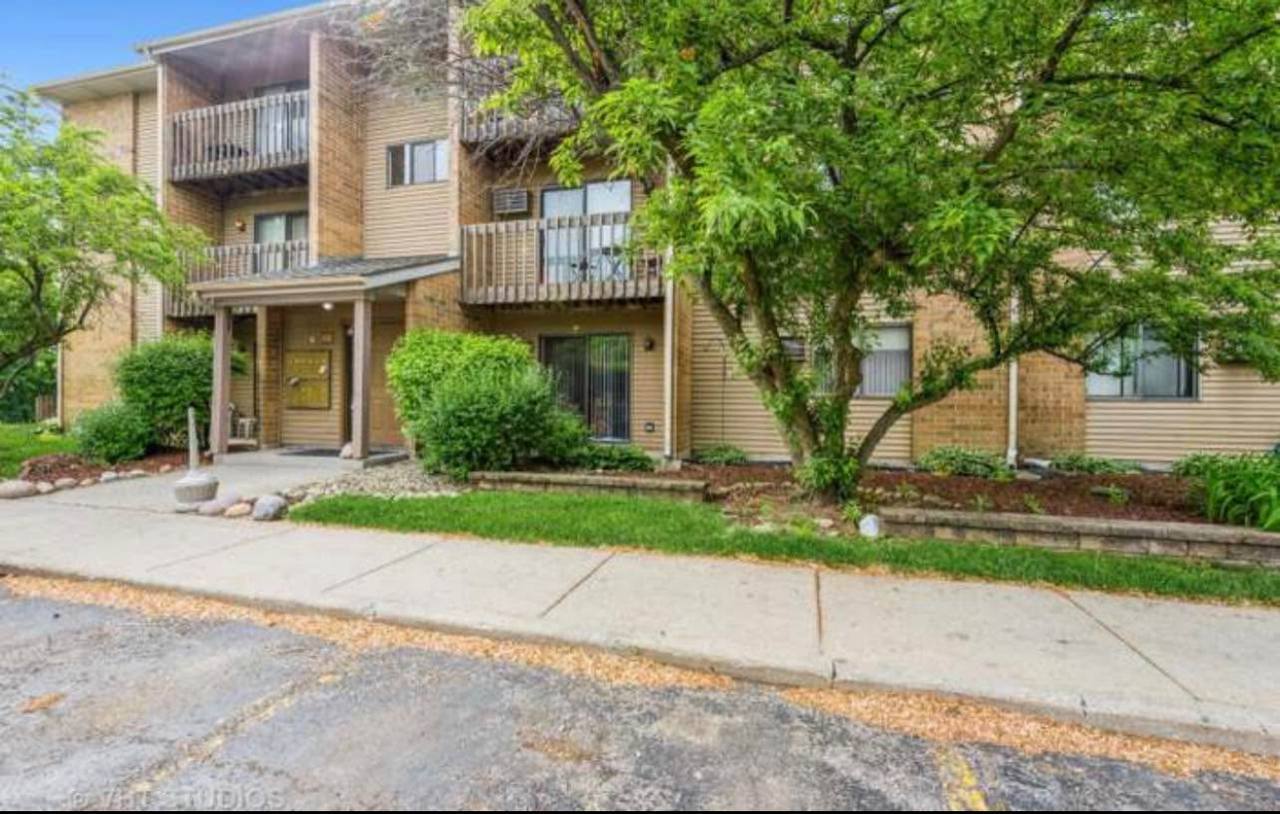
Active
$259,900
4
bds
|
3
ba
|
3,138
sqft
|
built
1950
255 Irving Blvd, Chicago Heights, IL 60411
$180
Cash flow
3.6%
Cash-on-Cash Return
6.5%
Cap rate
1.2%
Rent to Value Ratio
10,000 out of 16,132 properties for sale in Illinois
Limited Results Shown
Create a free account, or log in to reveal all property listings and enjoy the complete experience.
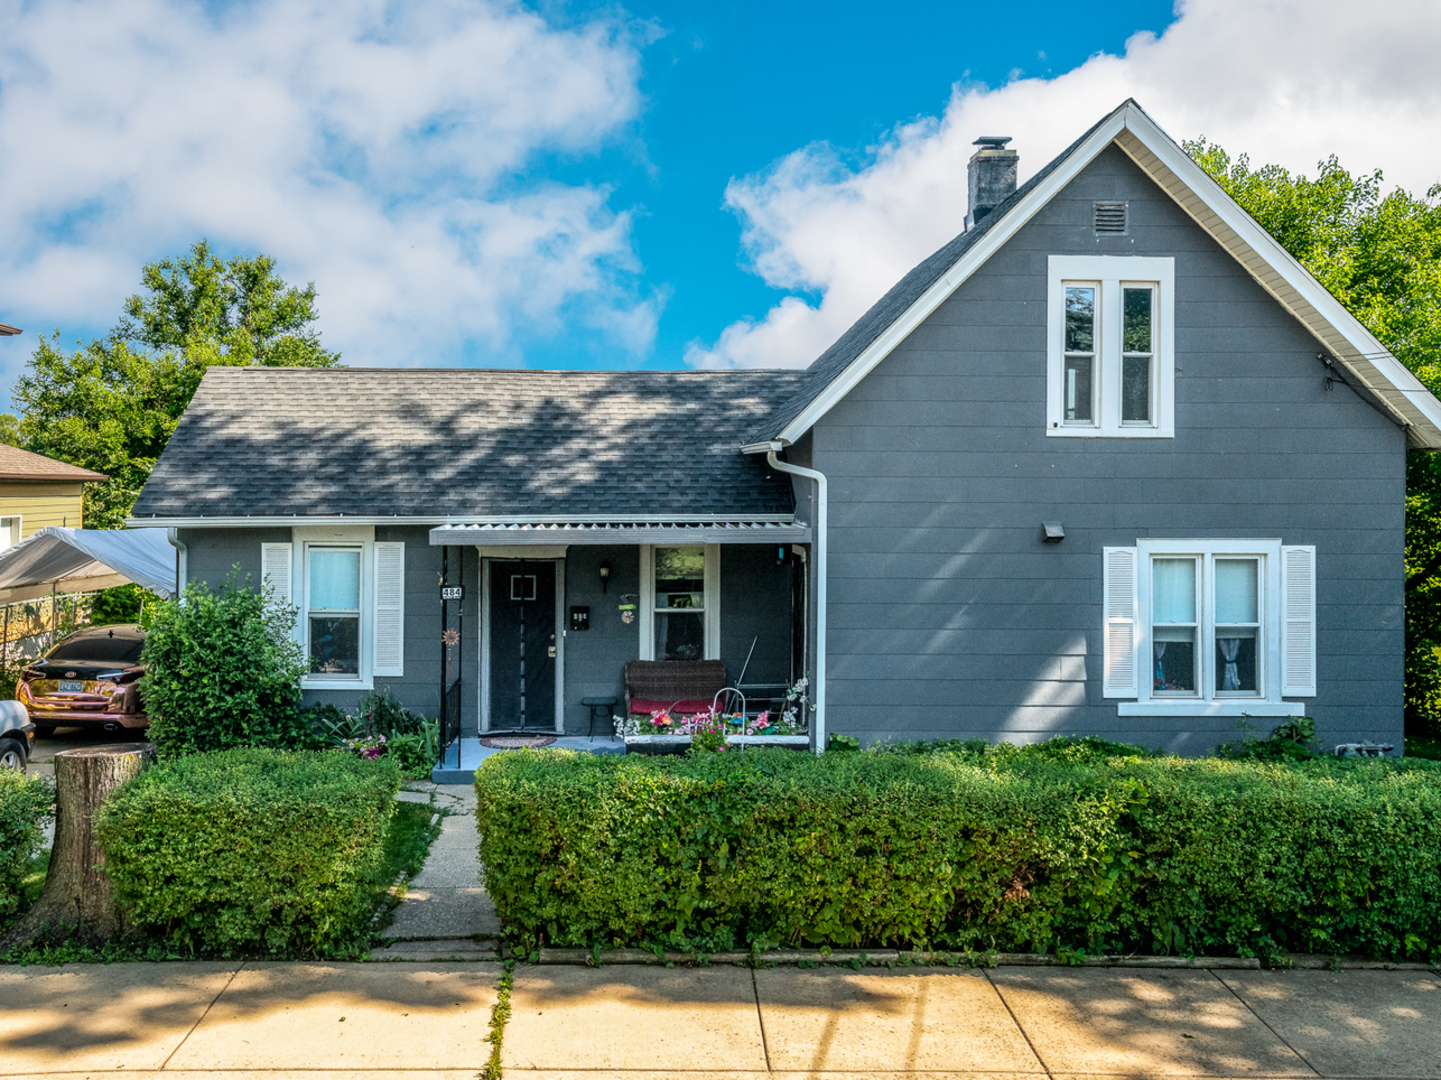
Active
$265,500
3
bds
|
2
ba
|
2,136
sqft
|
built
1890
484 Hickory Pl, Elgin, IL 60120
$-200
Cash flow
-3.9%
Cash-on-Cash Return
4.8%
Cap rate
0.8%
Rent to Value Ratio
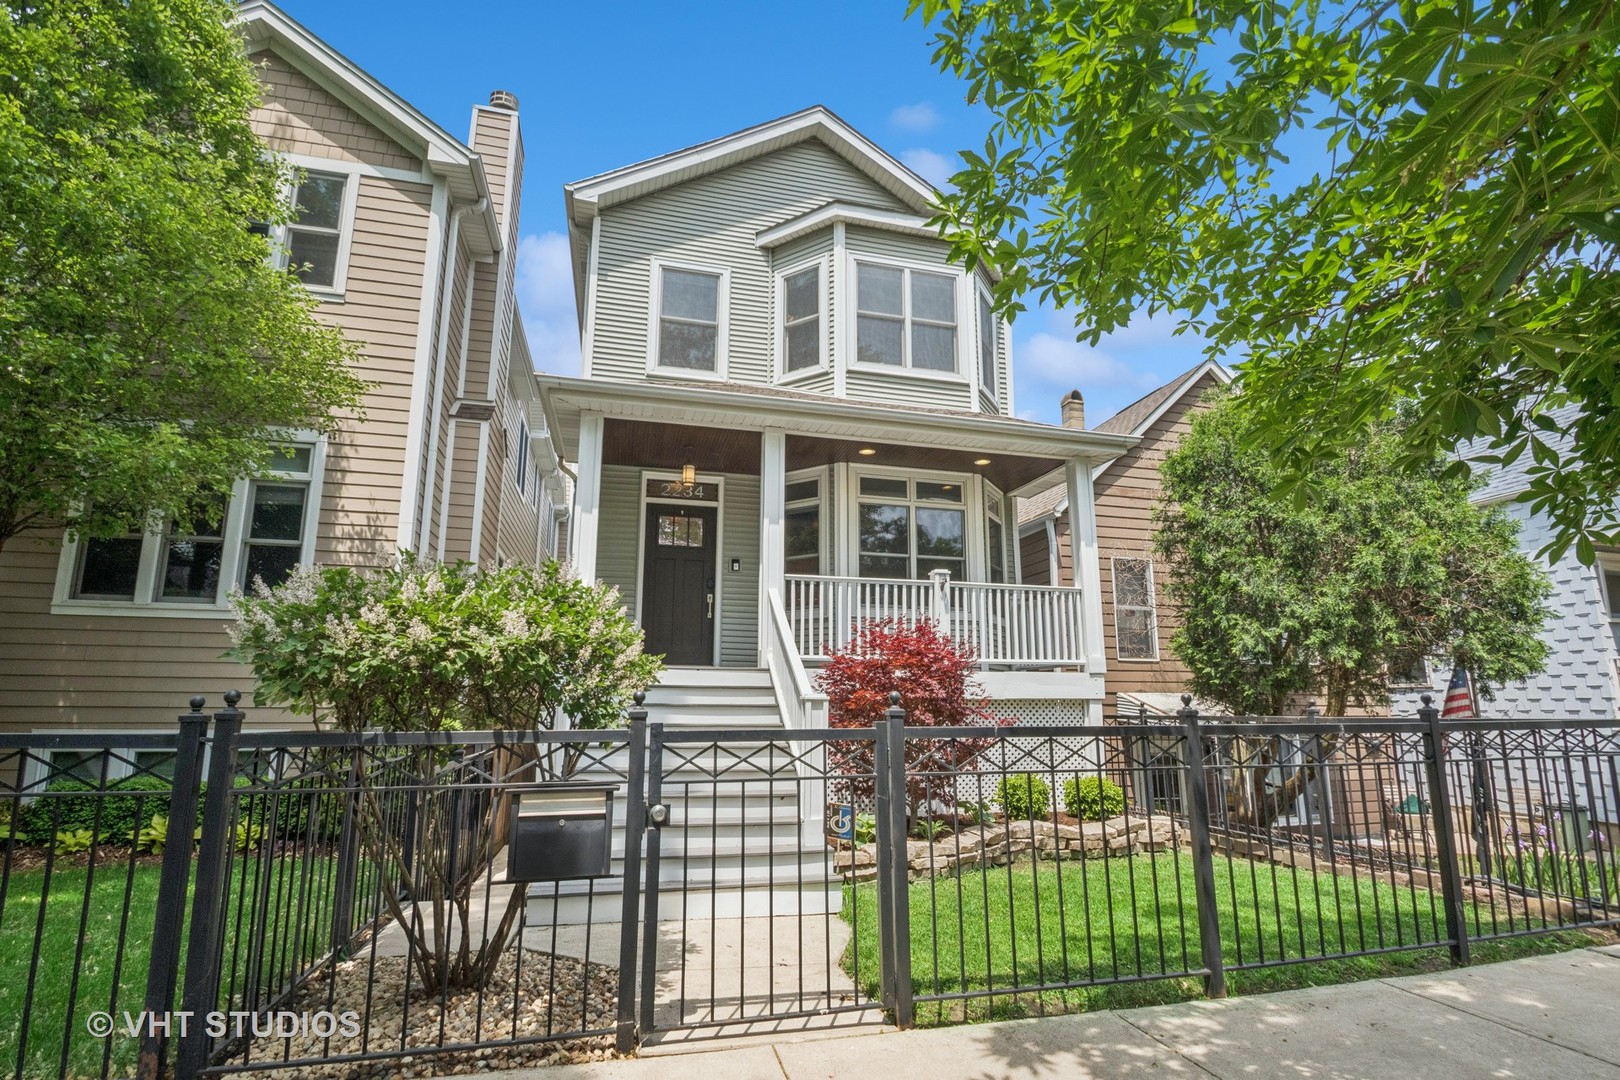
Active
$1,475,000
5
bds
|
4
ba
|
4,140
sqft
|
built
2005
2234 W Fletcher St, Chicago, IL 60618
$-4,270
Cash flow
-15.1%
Cash-on-Cash Return
2.2%
Cap rate
0.4%
Rent to Value Ratio
Active
$140,000
1
bds
|
1
ba
|
700
sqft
|
built
1988
633 Virginia Rd, Crystal Lake, IL 60014
$-182
Cash flow
-6.8%
Cash-on-Cash Return
4.1%
Cap rate
0.9%
Rent to Value Ratio
Active
$670,000
4
bds
|
4
ba
|
3,228
sqft
|
built
2000
644 N Franklin Ave, Palatine, IL 60067
$-1,380
Cash flow
-10.7%
Cash-on-Cash Return
3.2%
Cap rate
0.6%
Rent to Value Ratio
Active
$345,000
3
bds
|
2
ba
|
2,550
sqft
|
built
1942
16910 Lincoln St, Hazel Crest, IL 60429
$-791
Cash flow
-12.0%
Cash-on-Cash Return
2.9%
Cap rate
0.5%
Rent to Value Ratio
Active
$259,900
4
bds
|
3
ba
|
3,138
sqft
|
built
1950
255 Irving Blvd, Chicago Heights, IL 60411
$180
Cash flow
3.6%
Cash-on-Cash Return
6.5%
Cap rate
1.2%
Rent to Value Ratio
Active
$625,000
4
bds
|
3
ba
|
2,137
sqft
|
built
1907
325 2nd St, Downers Grove, IL 60515
$-872
Cash flow
-7.3%
Cash-on-Cash Return
4.0%
Cap rate
0.6%
Rent to Value Ratio
Active
$435,000
3
bds
|
3
ba
|
2,400
sqft
|
built
2013
90 Legacy Ln, Wheeling, IL 60090
$-1,079
Cash flow
-12.9%
Cash-on-Cash Return
2.7%
Cap rate
0.7%
Rent to Value Ratio
Active
$369,900
3
bds
|
2
ba
|
1,540
sqft
|
built
1976
160 E Terra Cotta Ave, Crystal Lake, IL 60014
$-270
Cash flow
-3.8%
Cash-on-Cash Return
4.8%
Cap rate
0.8%
Rent to Value Ratio
Active under contract
$285,000
3
bds
|
2
ba
|
1,389
sqft
|
built
1985
354 W Birchwood Ave, Palatine, IL 60067
$-109
Cash flow
-2.0%
Cash-on-Cash Return
5.2%
Cap rate
0.9%
Rent to Value Ratio
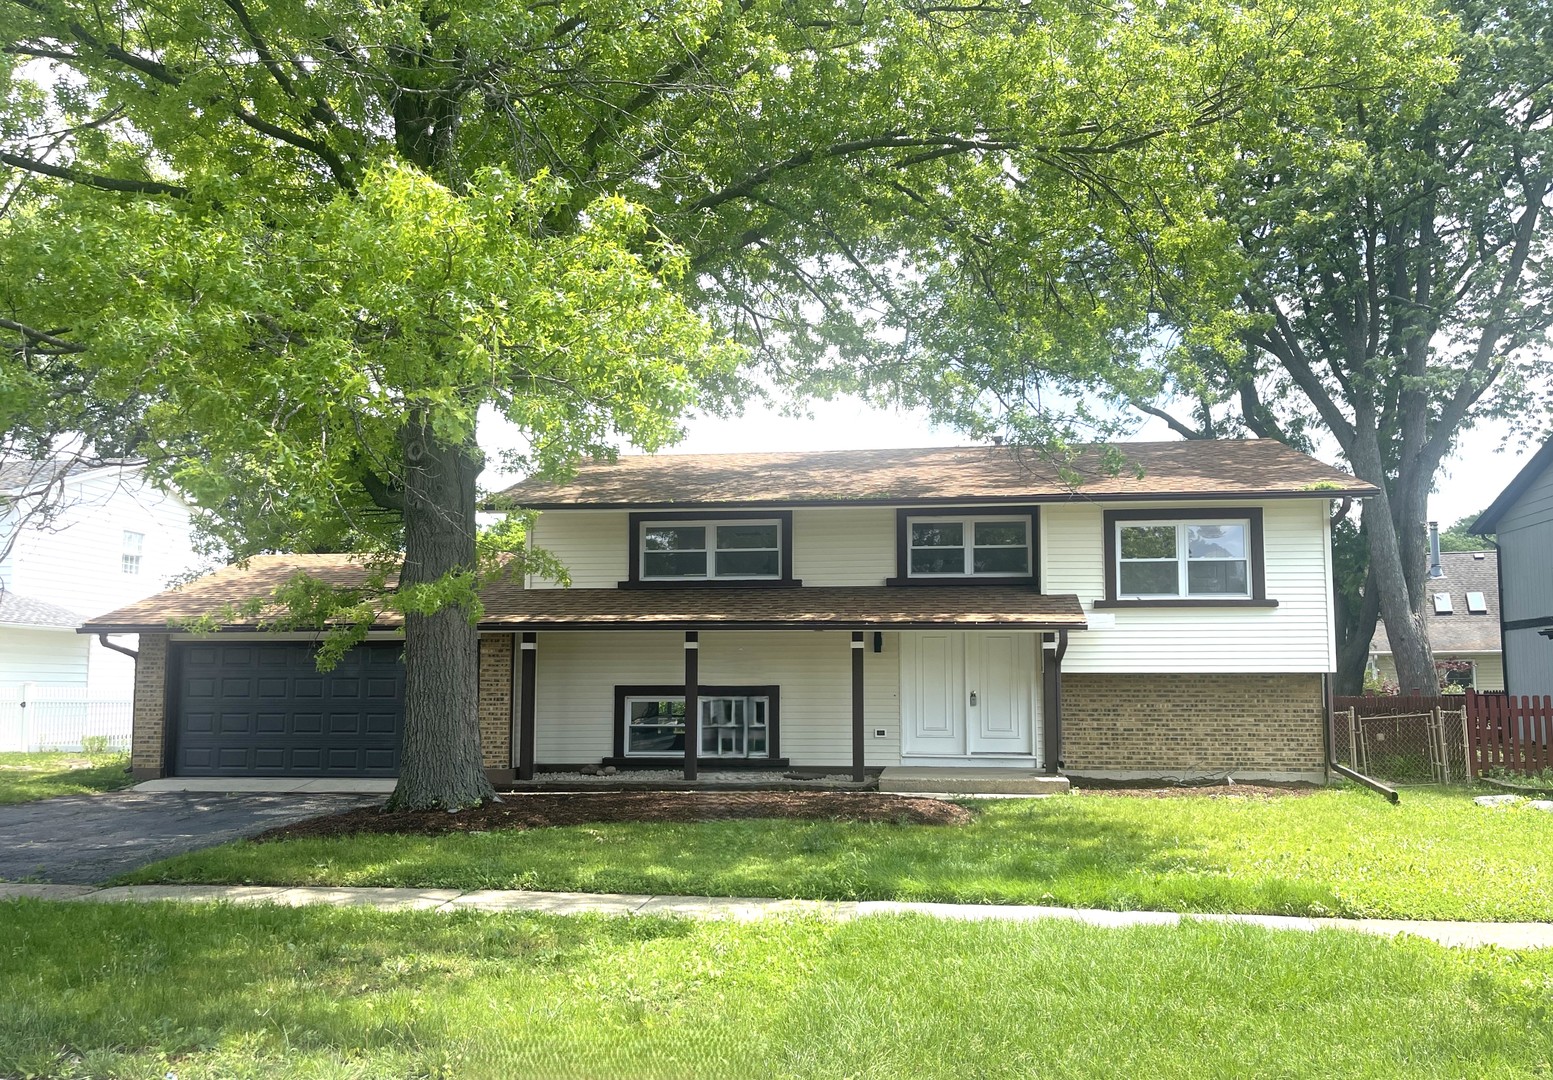
Pending
$215,000
3
bds
|
2
ba
|
1,170
sqft
|
built
1955
303 Shawnee St, Park Forest, IL 60466
$-471
Cash flow
-11.4%
Cash-on-Cash Return
3.0%
Cap rate
0.9%
Rent to Value Ratio
Active
$489,000
3
bds
|
2
ba
|
1,400
sqft
|
built
1953
1705 S Crescent Ave, Park Ridge, IL 60068
$-1,062
Cash flow
-11.3%
Cash-on-Cash Return
3.1%
Cap rate
0.6%
Rent to Value Ratio
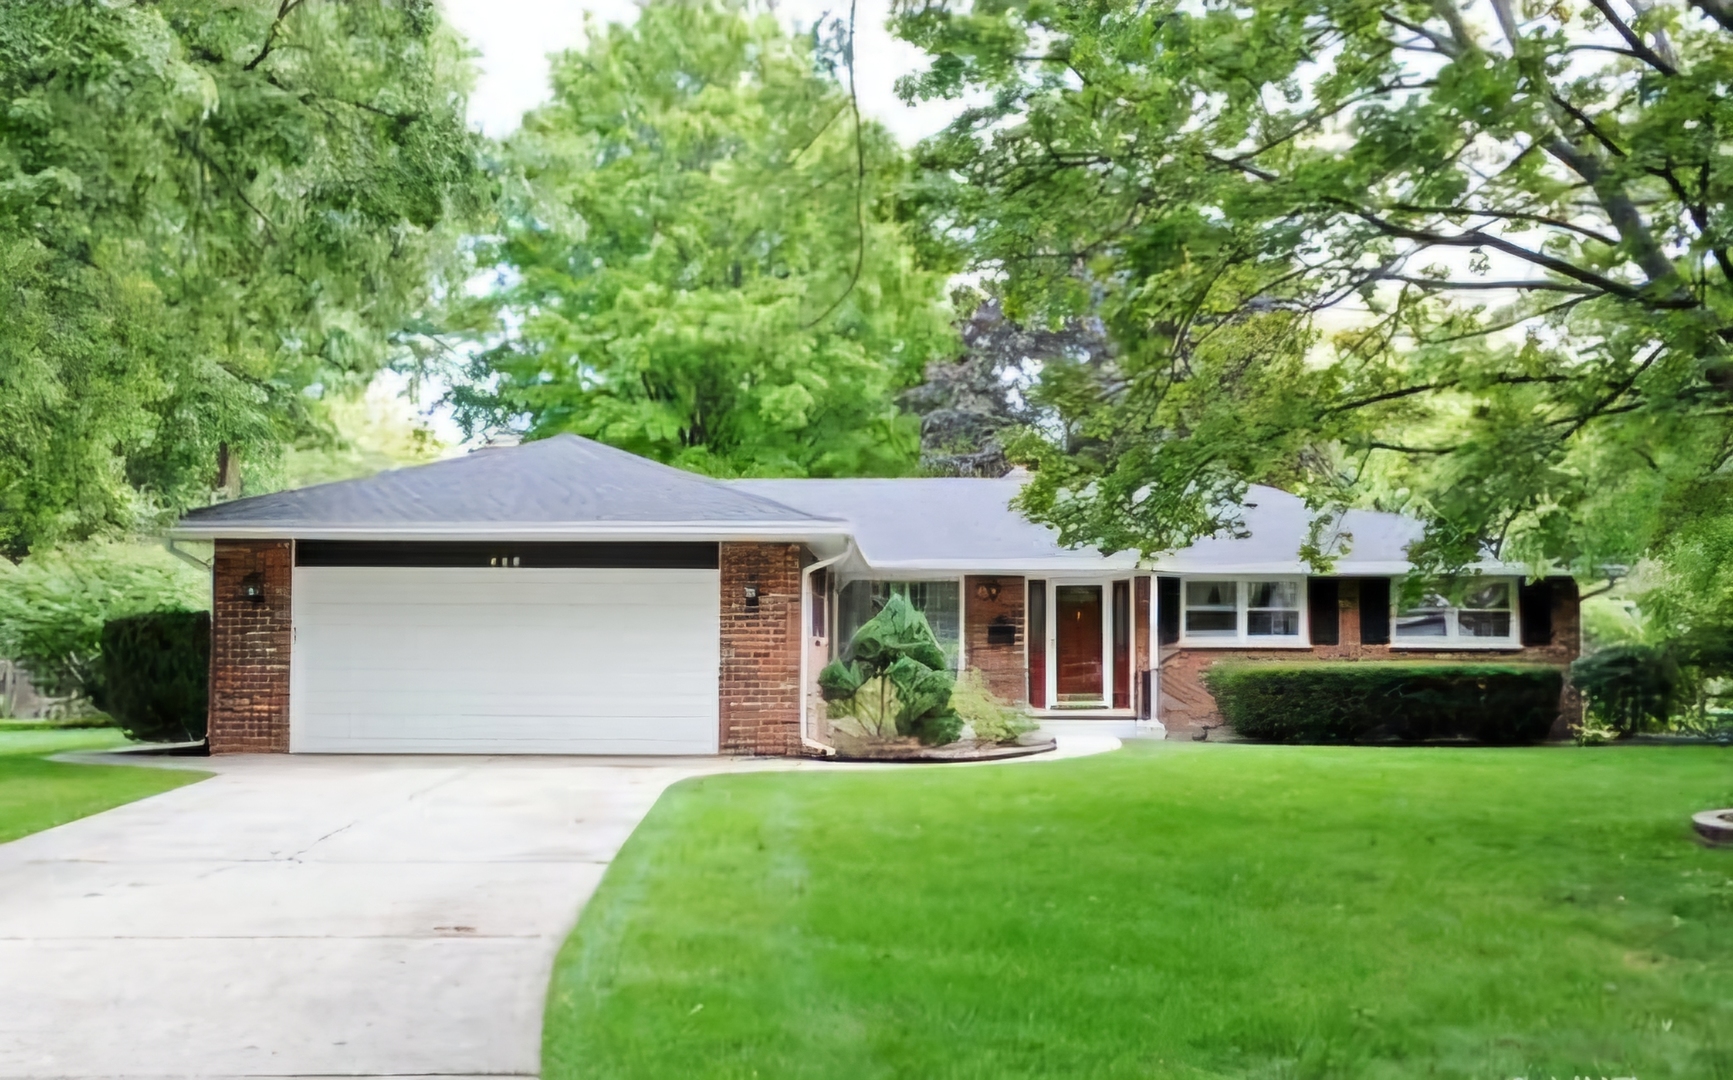
Active
$385,000
3
bds
|
3
ba
|
2,000
sqft
|
built
1918
606 S 2nd Ave, Maywood, IL 60153
$224
Cash flow
3.0%
Cash-on-Cash Return
6.4%
Cap rate
0.9%
Rent to Value Ratio
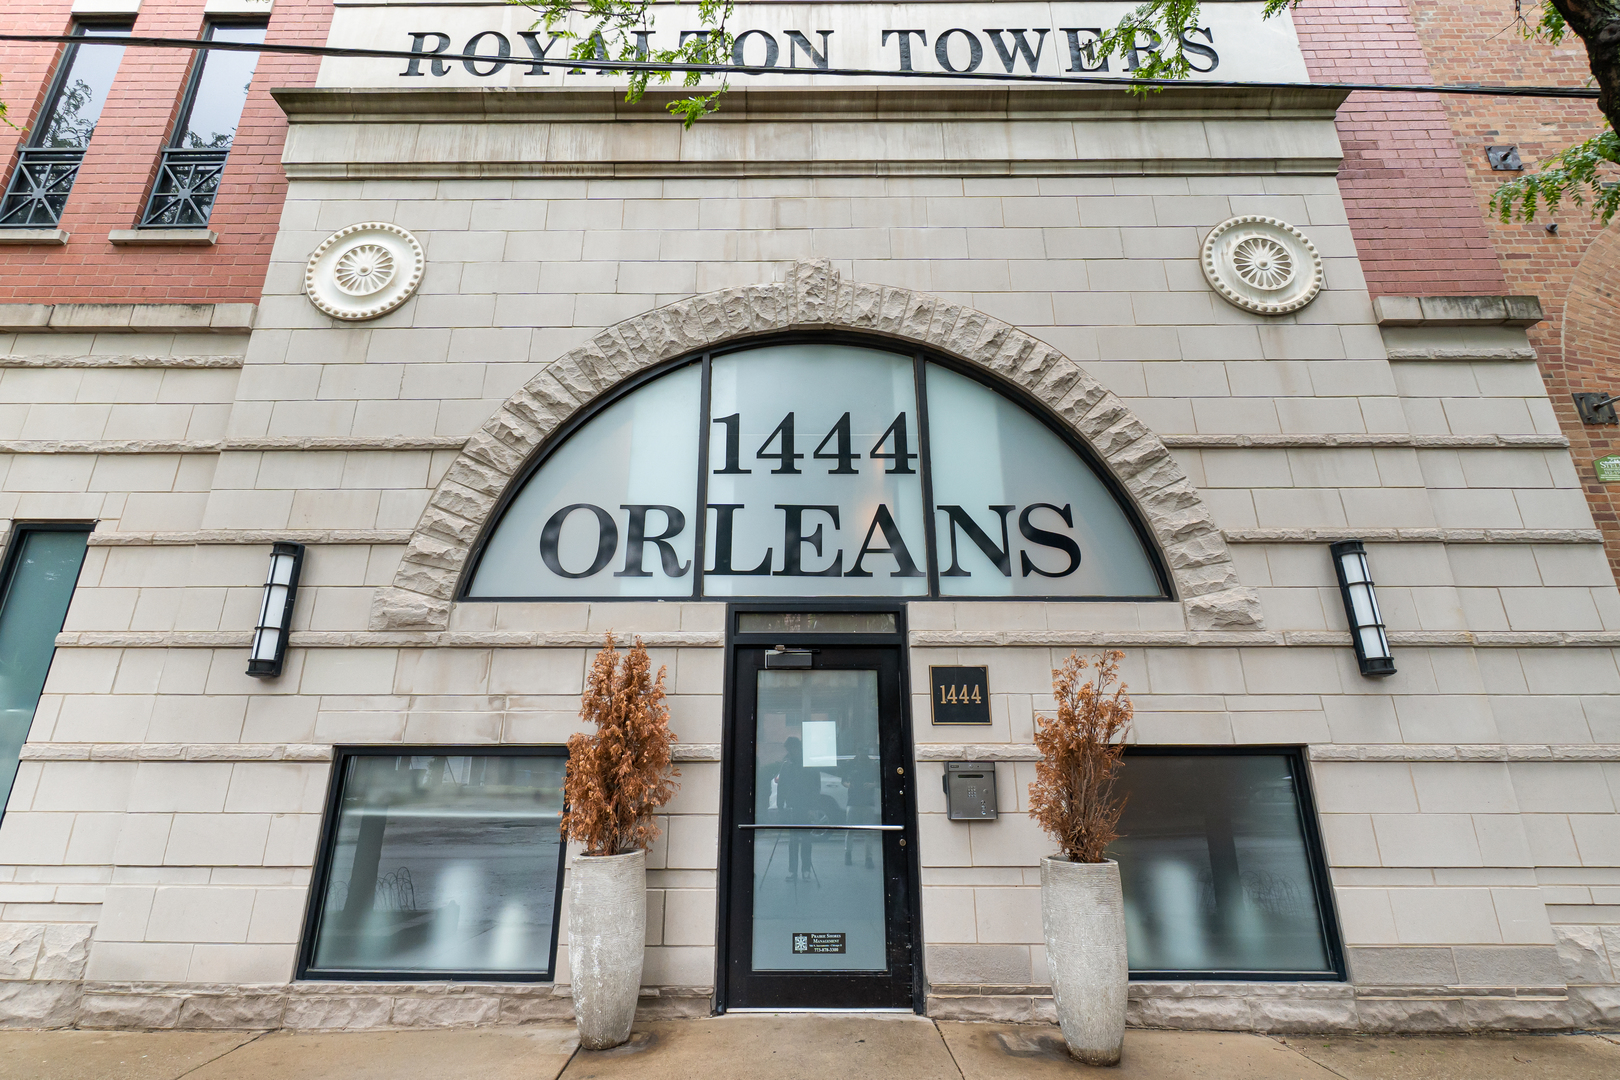
Active
$449,500
2
bds
|
2
ba
|
1,300
sqft
|
built
2002
1444 N Orleans St, Chicago, IL 60610
$-490
Cash flow
-5.7%
Cash-on-Cash Return
4.4%
Cap rate
0.9%
Rent to Value Ratio
Active
$229,900
2
bds
|
1
ba
|
1,486
sqft
|
built
1957
2422 E Grand Ave, Lindenhurst, IL 60046
$81
Cash flow
1.8%
Cash-on-Cash Return
6.1%
Cap rate
1.1%
Rent to Value Ratio
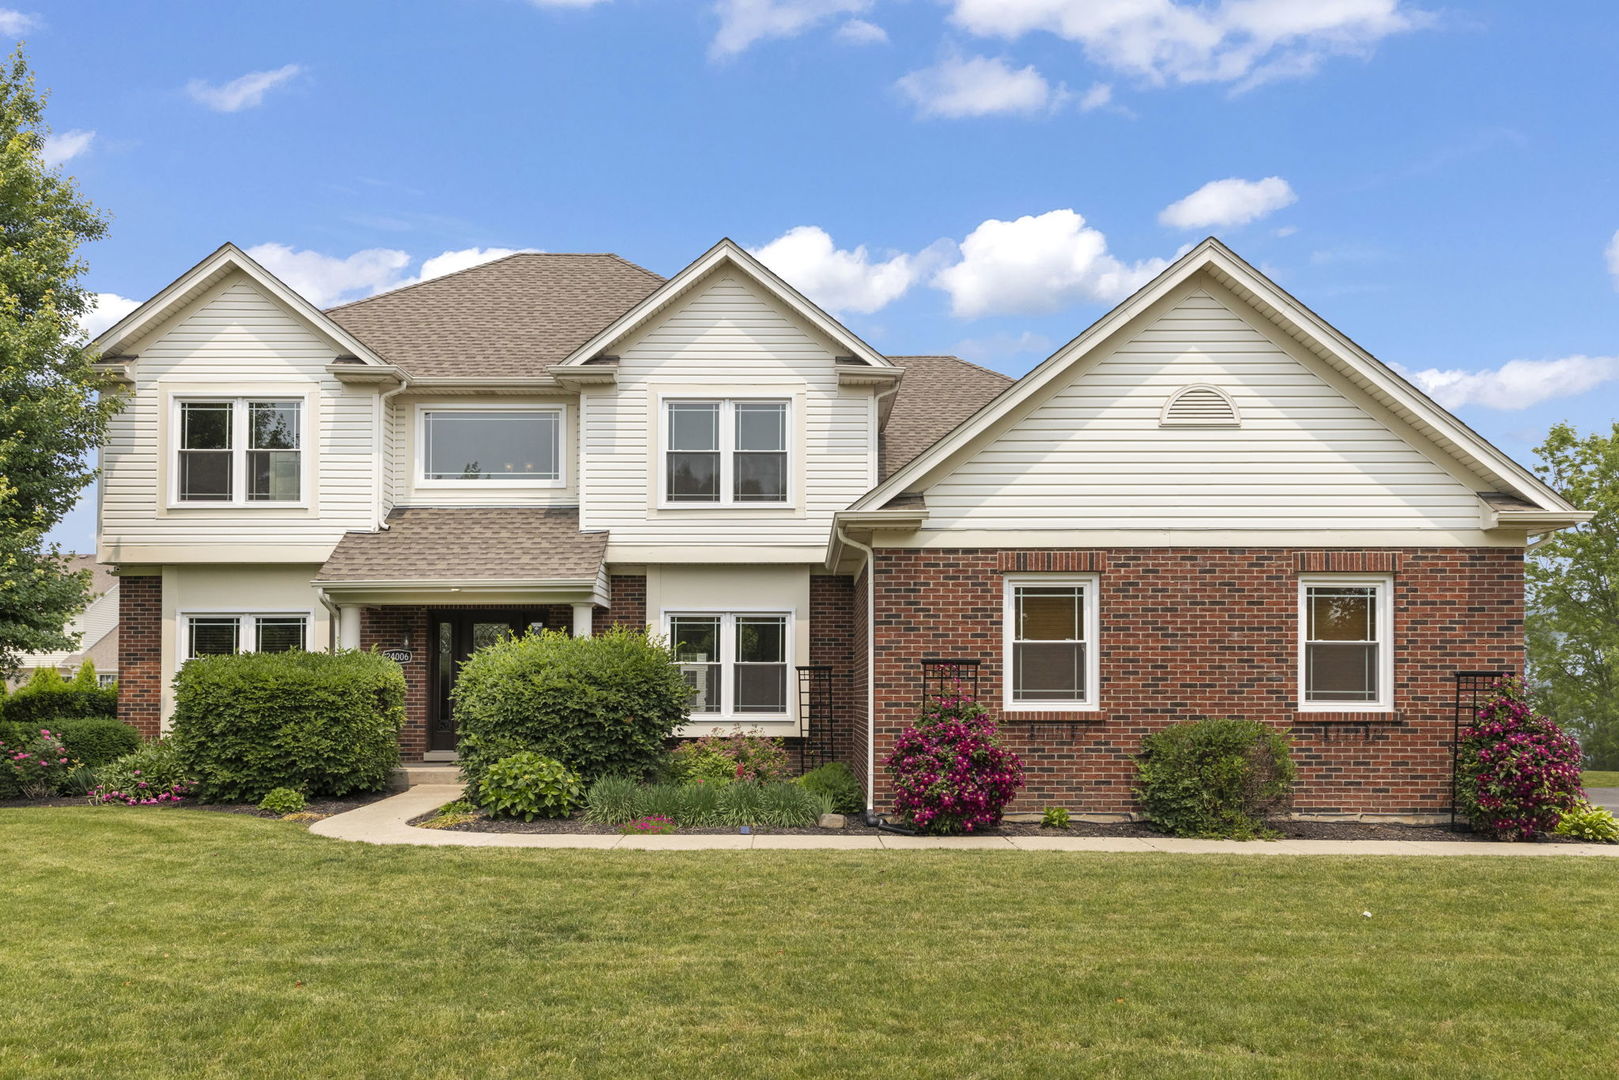
Active
$572,500
5
bds
|
4
ba
|
2,836
sqft
|
built
2004
24006 Skyler Ln, Plainfield, IL 60586
$-1,180
Cash flow
-10.8%
Cash-on-Cash Return
3.2%
Cap rate
0.6%
Rent to Value Ratio
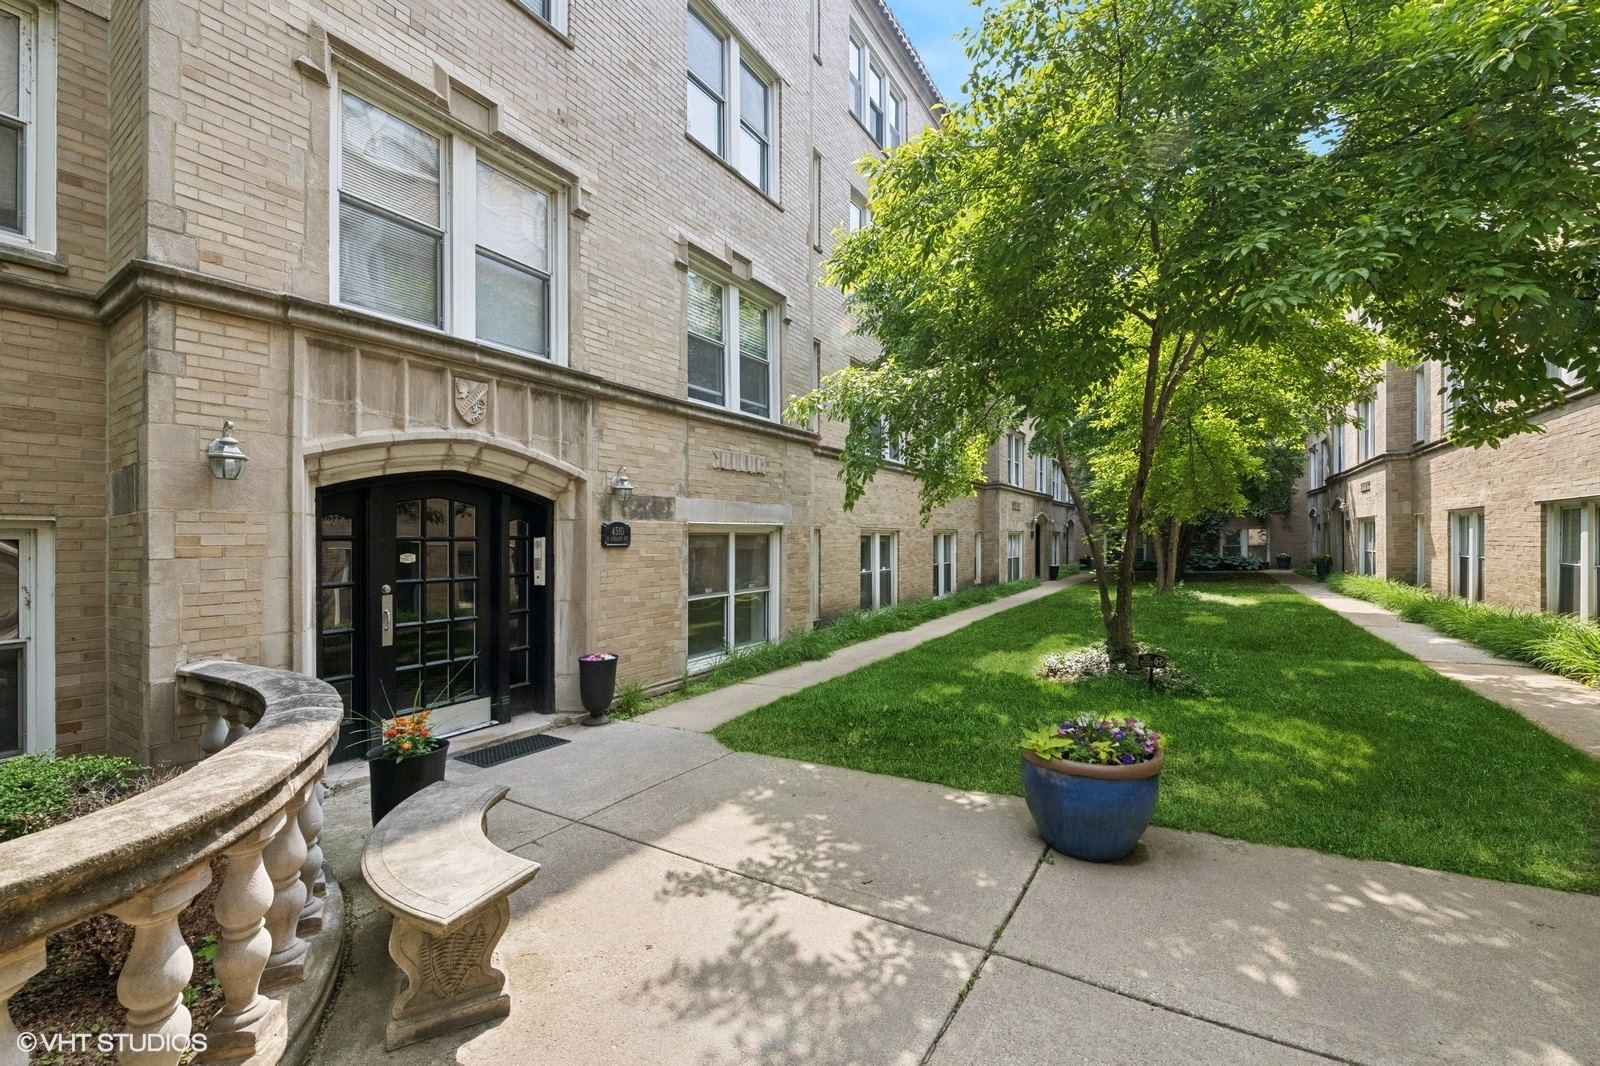
Active
$265,000
2
bds
|
1
ba
|
0
sqft
|
built
1920
4510 N Ashland Ave, Chicago, IL 60640
$-345
Cash flow
-6.8%
Cash-on-Cash Return
4.1%
Cap rate
0.8%
Rent to Value Ratio
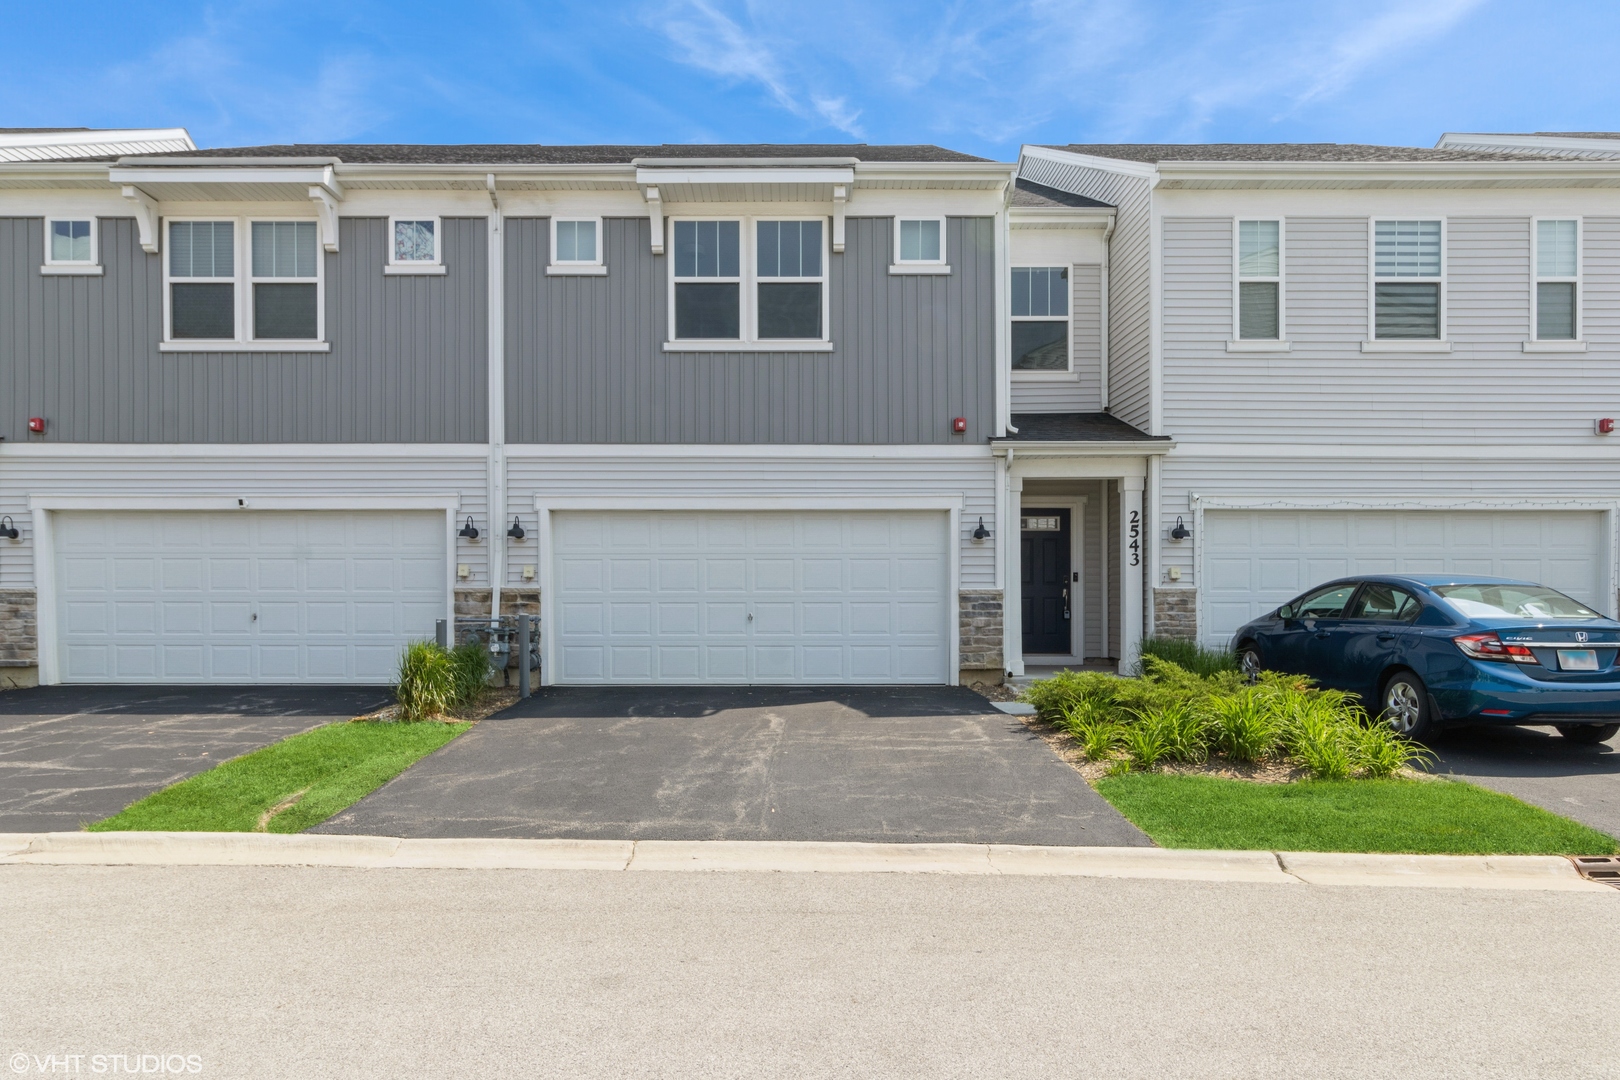
Active under contract
$450,000
3
bds
|
3
ba
|
1,966
sqft
|
built
2021
2543 Geranium Way, Rolling Meadows, IL 60008
$-1,527
Cash flow
-17.7%
Cash-on-Cash Return
1.6%
Cap rate
0.6%
Rent to Value Ratio
Active
$499,000
4
bds
|
2
ba
|
2,016
sqft
|
built
1967
215 Brighton Rd, Elk Grove Village, IL 60007
$-1,328
Cash flow
-13.9%
Cash-on-Cash Return
2.5%
Cap rate
0.5%
Rent to Value Ratio
Active
$170,000
2
bds
|
2
ba
|
900
sqft
|
built
1980
256 Canterbury Ln, Bolingbrook, IL 60440
$56
Cash flow
1.7%
Cash-on-Cash Return
6.1%
Cap rate
1.2%
Rent to Value Ratio
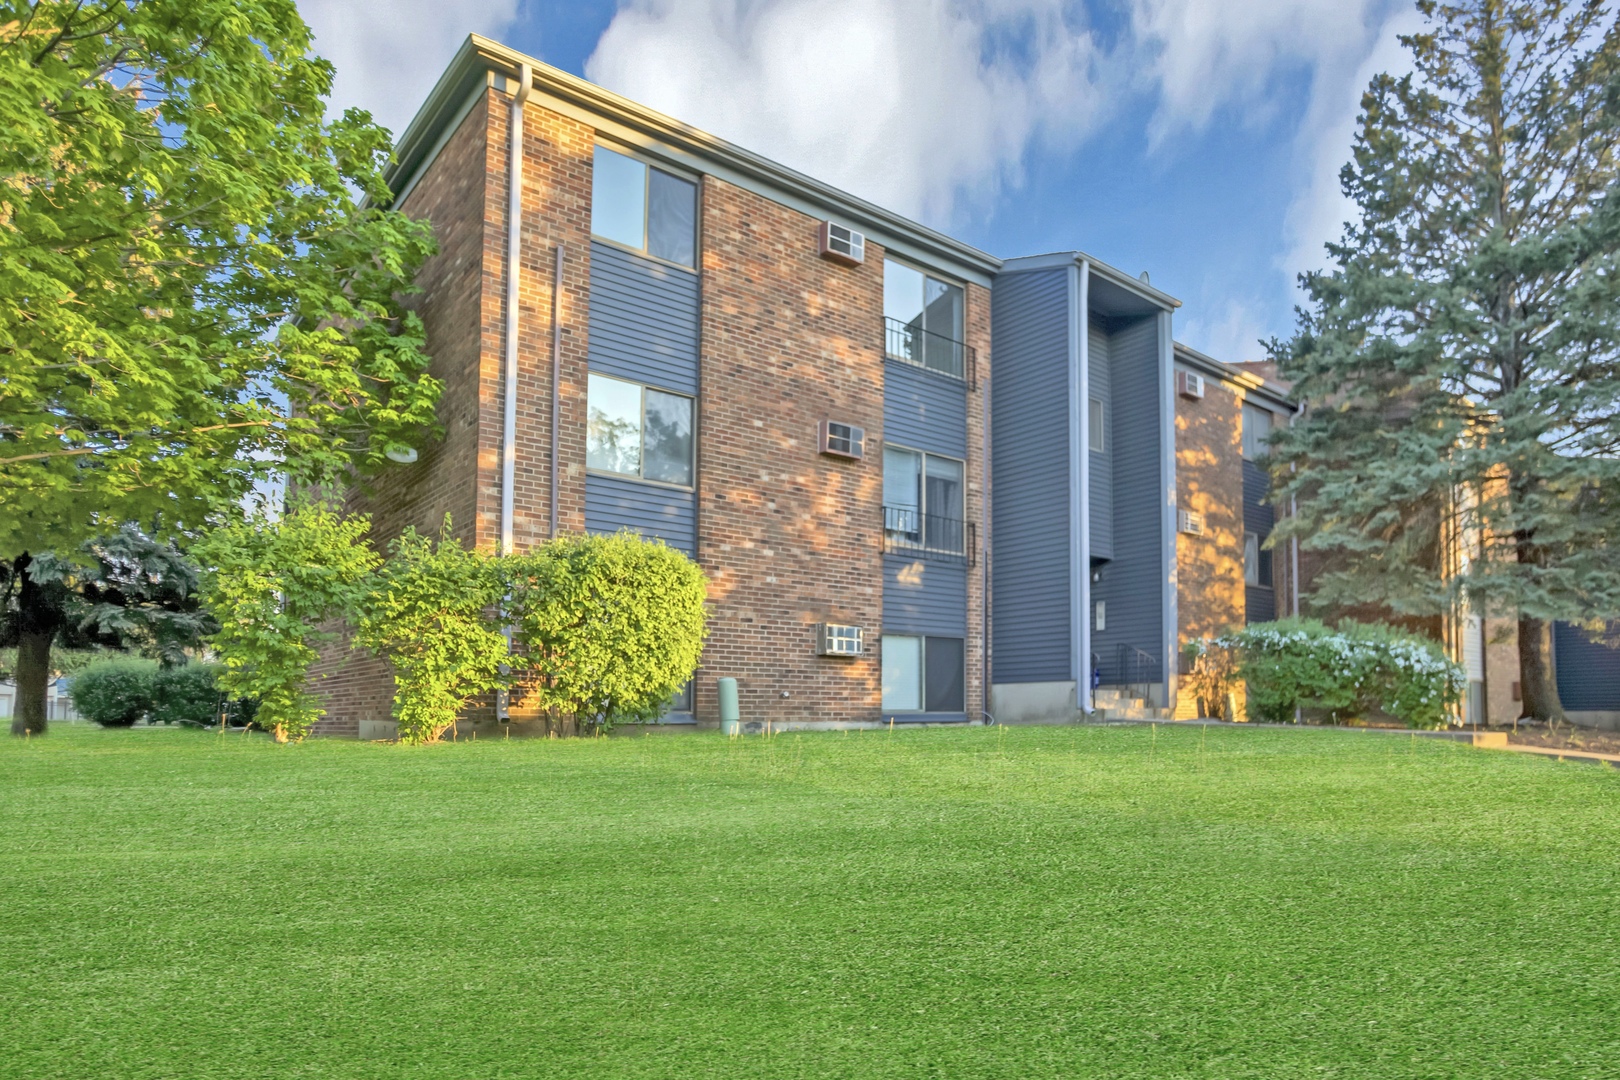
Active
$219,900
2
bds
|
2
ba
|
1,259
sqft
|
built
1969
1601 N 76th Ct, Elmwood Park, IL 60707
$-259
Cash flow
-6.1%
Cash-on-Cash Return
4.3%
Cap rate
0.9%
Rent to Value Ratio
Active
$769,000
9
bds
|
4
ba
|
0
sqft
|
built
1906
1630 N Avers Ave, Chicago, IL 60647
$-2,642
Cash flow
-17.9%
Cash-on-Cash Return
1.6%
Cap rate
0.3%
Rent to Value Ratio
Active
$719,000
4
bds
|
3
ba
|
2,101
sqft
|
built
1960
389 Forest Ave, Glen Ellyn, IL 60137
$-1,872
Cash flow
-13.6%
Cash-on-Cash Return
2.6%
Cap rate
0.5%
Rent to Value Ratio
Active
$1,350,000
3
bds
|
4
ba
|
4,200
sqft
|
built
2006
2128 N Winchester Ave, Chicago, IL 60614
$-2,669
Cash flow
-10.3%
Cash-on-Cash Return
3.3%
Cap rate
0.6%
Rent to Value Ratio
Active
$439,000
4
bds
|
2
ba
|
1,600
sqft
|
built
1947
2702 N 76th Ave, Elmwood Park, IL 60707
$-807
Cash flow
-9.6%
Cash-on-Cash Return
3.5%
Cap rate
0.7%
Rent to Value Ratio
Active
$1,750,000
4
bds
|
3
ba
|
3,000
sqft
|
built
2021
1469 W Byron St, Chicago, IL 60613
$-2,749
Cash flow
-8.2%
Cash-on-Cash Return
3.8%
Cap rate
0.5%
Rent to Value Ratio
Active
$575,000
7
bds
|
2
ba
|
0
sqft
|
built
1911
6111 S Eberhart Ave, Chicago, IL 60637
$-1,528
Cash flow
-13.9%
Cash-on-Cash Return
2.5%
Cap rate
0.3%
Rent to Value Ratio
Active
$599,900
3
bds
|
4
ba
|
2,046
sqft
|
built
1977
40 Portwine Rd, Willowbrook, IL 60527
$-1,775
Cash flow
-15.4%
Cash-on-Cash Return
2.1%
Cap rate
0.5%
Rent to Value Ratio
Active
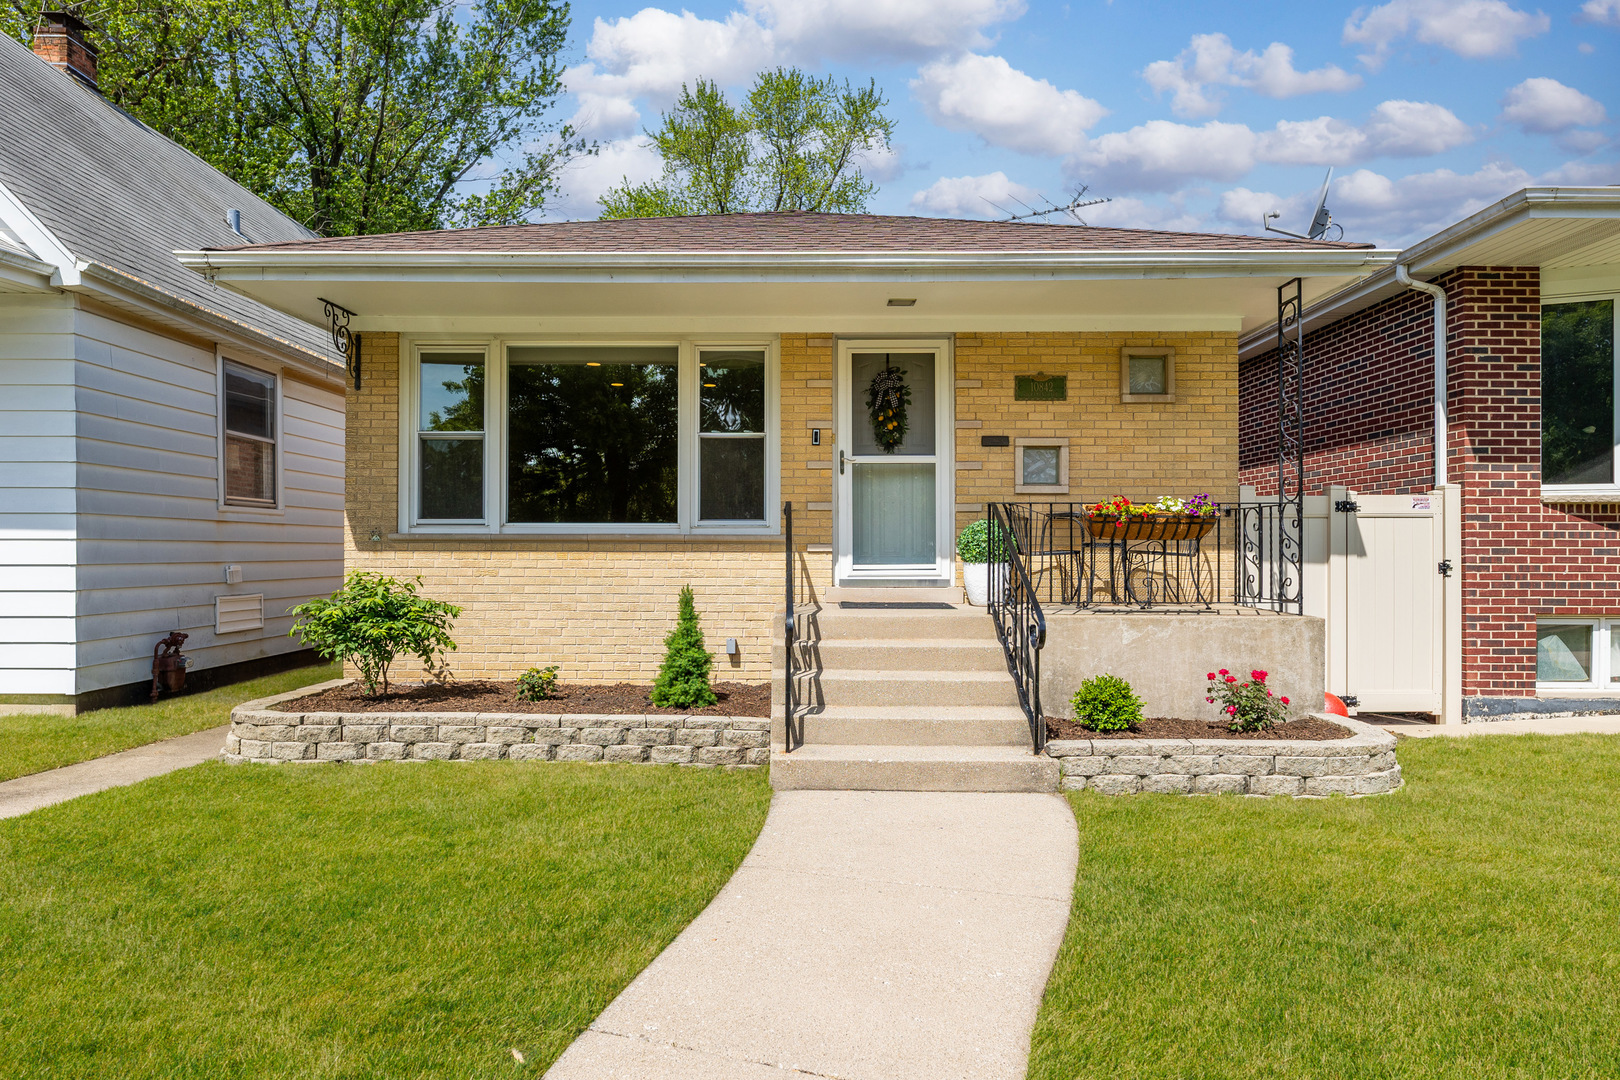
$374,900
3
bds
|
2
ba
|
1,128
sqft
|
built
1963
10842 S Sacramento Ave, Chicago, IL 60655
$-292
Cash flow
-4.1%
Cash-on-Cash Return
4.7%
Cap rate
0.7%
Rent to Value Ratio
Active
$349,900
2
bds
|
2
ba
|
0
sqft
|
built
2007
1122 W Catalpa Ave, Chicago, IL 60640
$-1,188
Cash flow
-17.7%
Cash-on-Cash Return
1.6%
Cap rate
0.8%
Rent to Value Ratio
Active
$645,000
7
bds
|
4
ba
|
0
sqft
|
built
1948
7133 16th St, Berwyn, IL 60402
$-1,976
Cash flow
-16.0%
Cash-on-Cash Return
2.0%
Cap rate
0.4%
Rent to Value Ratio
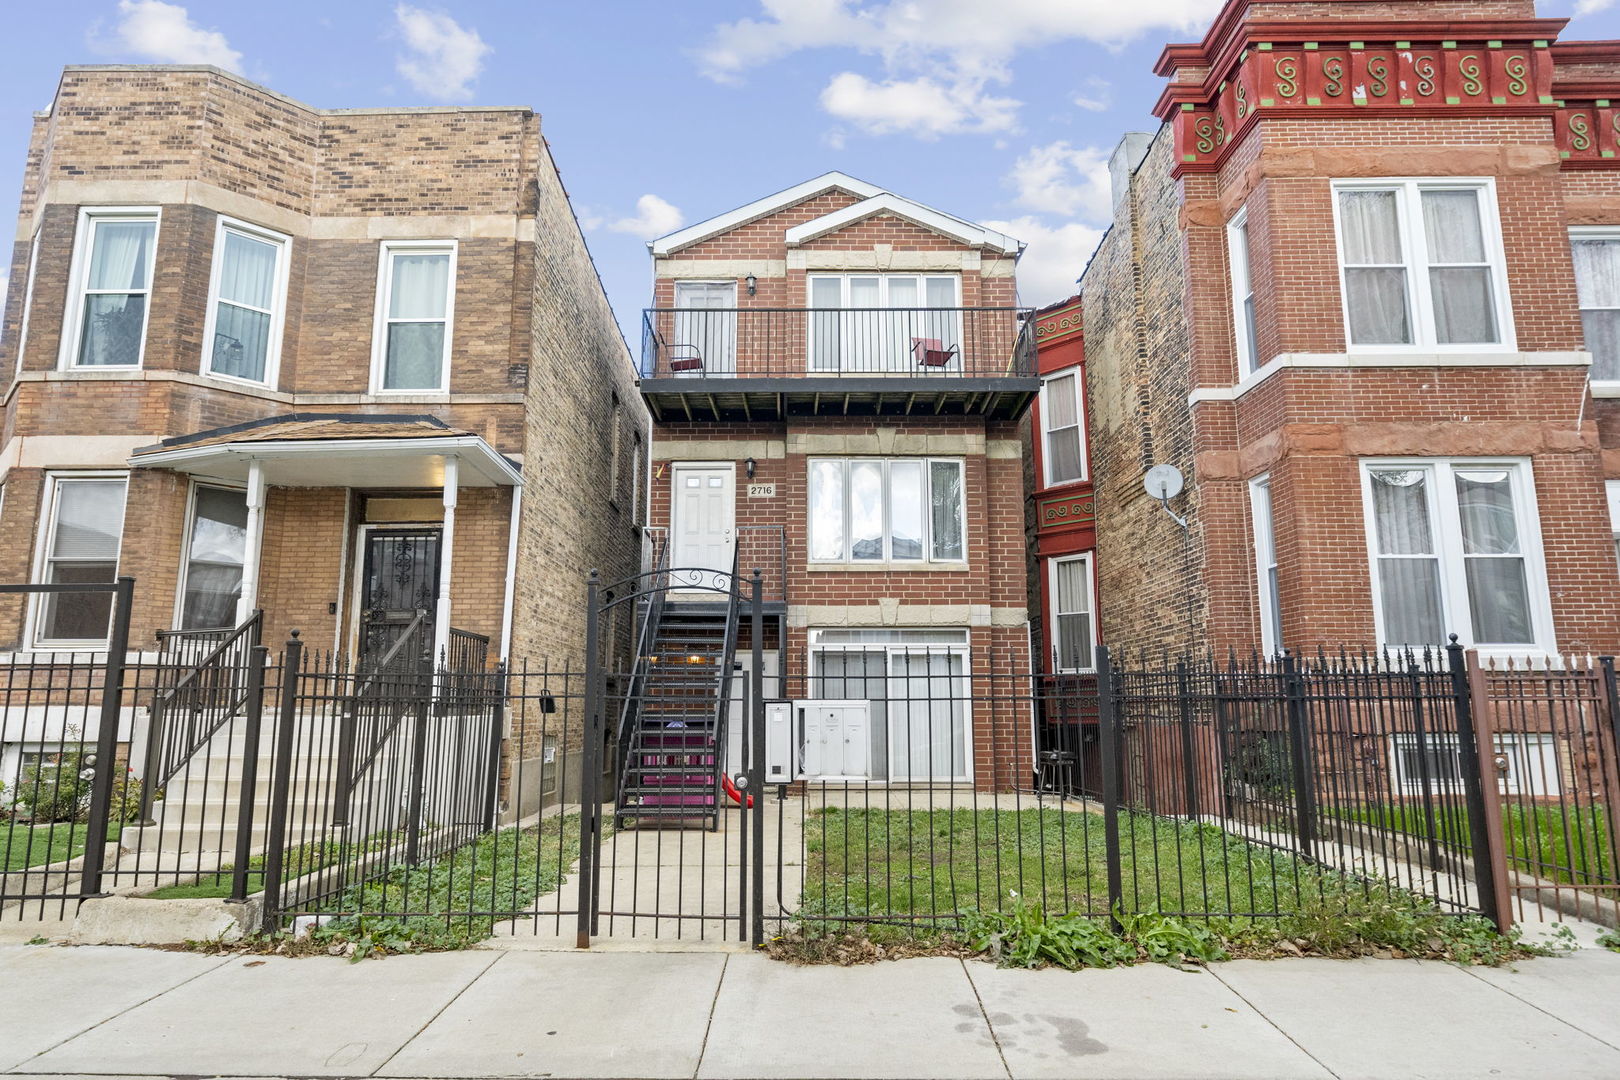
Active
$675,000
9
bds
|
6
ba
|
0
sqft
|
built
2005
2716 W Polk St, Chicago, IL 60612
$-2,611
Cash flow
-20.2%
Cash-on-Cash Return
1.0%
Cap rate
0.3%
Rent to Value Ratio
Active
$1,299,000
11
bds
|
8
ba
|
0
sqft
|
built
1925
4906 N Whipple St, Chicago, IL 60625
$-5,232
Cash flow
-21.0%
Cash-on-Cash Return
0.8%
Cap rate
0.2%
Rent to Value Ratio
Active
$2,200,000
7
bds
|
6
ba
|
6,431
sqft
|
built
2024
505 Lincoln Ave, Downers Grove, IL 60515
$-5,994
Cash flow
-14.2%
Cash-on-Cash Return
2.4%
Cap rate
0.4%
Rent to Value Ratio
Active
$825,000
4
bds
|
4
ba
|
3,659
sqft
|
built
1993
1636 Canyon Run Rd, Naperville, IL 60565
$-1,690
Cash flow
-10.7%
Cash-on-Cash Return
3.2%
Cap rate
0.5%
Rent to Value Ratio
Active
$475,000
3
bds
|
3
ba
|
2,225
sqft
|
built
1981
2S570 Patrick Henry Sq, Oak Brook, IL 60523
$-848
Cash flow
-9.3%
Cash-on-Cash Return
3.5%
Cap rate
0.8%
Rent to Value Ratio
Active
$544,900
3
bds
|
2
ba
|
1,720
sqft
|
built
1968
826 Crestfield Ave, Libertyville, IL 60048
$-615
Cash flow
-5.9%
Cash-on-Cash Return
4.3%
Cap rate
0.7%
Rent to Value Ratio
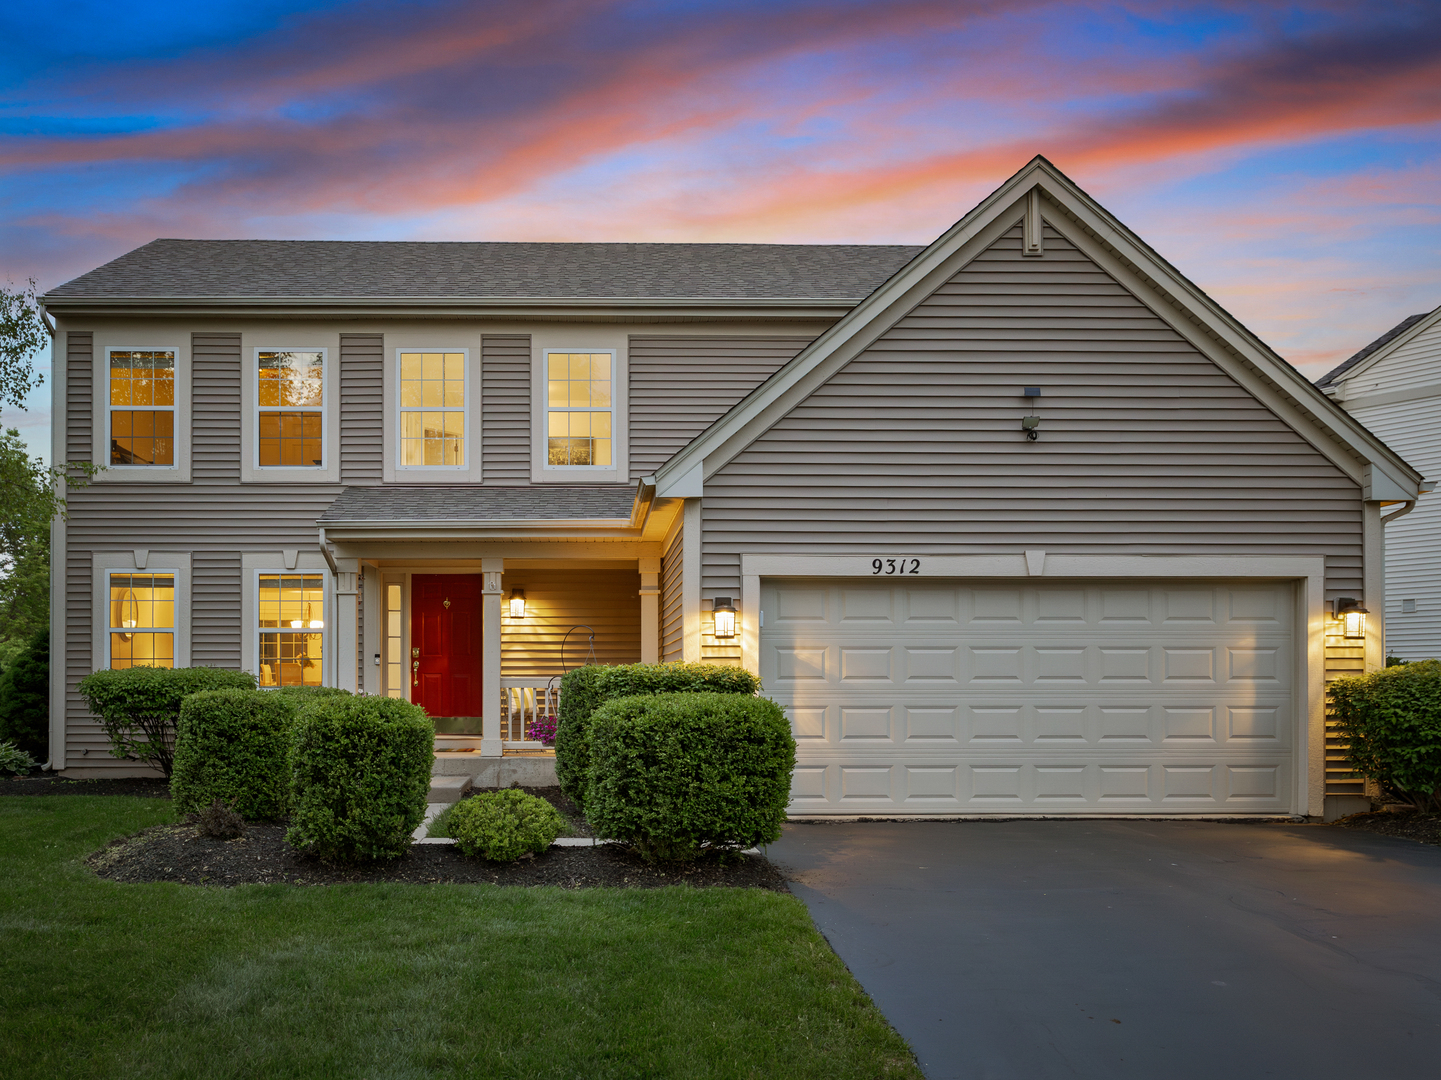
Active
$474,900
4
bds
|
3
ba
|
2,220
sqft
|
built
2005
9312 Bristol Ln, Huntley, IL 60142
$-1,192
Cash flow
-13.1%
Cash-on-Cash Return
2.7%
Cap rate
0.5%
Rent to Value Ratio
Active
$575,000
7
bds
|
3
ba
|
3,900
sqft
|
built
1920
4322 Amelia Ave, Lyons, IL 60534
$-935
Cash flow
-8.5%
Cash-on-Cash Return
3.7%
Cap rate
0.6%
Rent to Value Ratio
Active
$500,000
2
bds
|
3
ba
|
1,700
sqft
|
built
1995
1905 E Grand Ave, Lindenhurst, IL 60046
$-1,408
Cash flow
-14.7%
Cash-on-Cash Return
2.3%
Cap rate
0.6%
Rent to Value Ratio