Illinois Investment Properties for Sale
Browse homes for sale and investment properties in Illinois. Refine your search by price, property type, or more.
Best cash flowing properties in Illinois

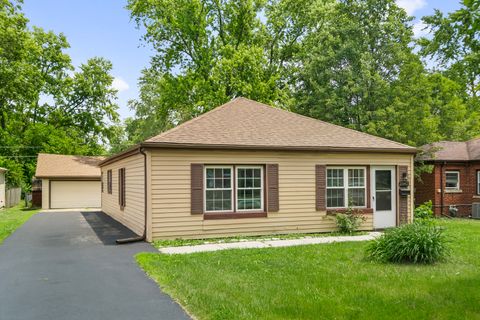
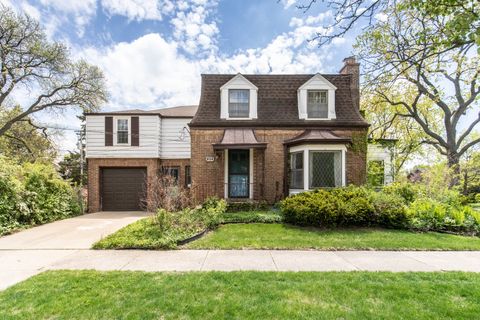
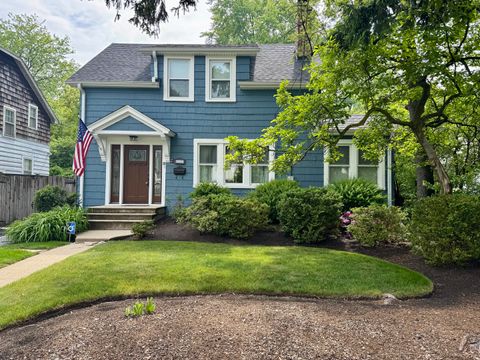
Active
$150,000
6
bds
|
2
ba
|
0
sqft
|
built
1890
4321 W Maypole Ave, Chicago, IL 60624
$391
Cash flow
13.6%
Cash-on-Cash Return
8.8%
Cap rate
1.2%
Rent to Value Ratio
Active
$194,700
3
bds
|
2
ba
|
1,089
sqft
|
built
1948
21963 Millard Ave, Richton Park, IL 60471
$342
Cash flow
9.2%
Cash-on-Cash Return
7.8%
Cap rate
1.3%
Rent to Value Ratio
10,000 out of 16,044 properties for sale in Illinois
Limited Results Shown
Create a free account, or log in to reveal all property listings and enjoy the complete experience.

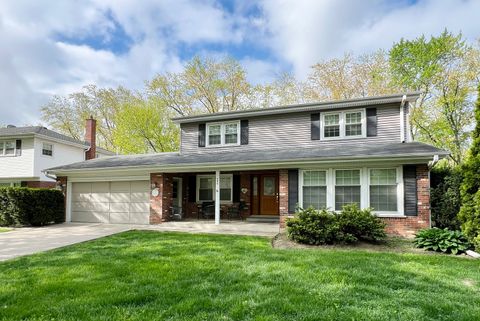
Active
$619,000
3
bds
|
3
ba
|
2,500
sqft
|
built
1967
636 Cambridge Dr, Schaumburg, IL 60193
$-1,505
Cash flow
-12.7%
Cash-on-Cash Return
2.8%
Cap rate
0.5%
Rent to Value Ratio
Active
$559,900
6
bds
|
3
ba
|
0
sqft
|
built
1905
3035 W Flournoy St, Chicago, IL 60612
$-1,121
Cash flow
-10.4%
Cash-on-Cash Return
3.3%
Cap rate
0.5%
Rent to Value Ratio
Active
$359,900
3
bds
|
2
ba
|
1,200
sqft
|
built
1951
3415 Adams St, Bellwood, IL 60104
$-606
Cash flow
-8.8%
Cash-on-Cash Return
3.7%
Cap rate
0.7%
Rent to Value Ratio

Active
$519,900
2
bds
|
2
ba
|
1,450
sqft
|
built
2002
669 N Peoria St, Chicago, IL 60642
$-803
Cash flow
-8.1%
Cash-on-Cash Return
3.8%
Cap rate
0.8%
Rent to Value Ratio
Active
$899,000
5
bds
|
3
ba
|
2,880
sqft
|
built
1967
1329 Sanford Ln, Glenview, IL 60025
$-1,744
Cash flow
-10.1%
Cash-on-Cash Return
3.4%
Cap rate
0.6%
Rent to Value Ratio
Active
$599,900
3
bds
|
3
ba
|
1,954
sqft
|
built
1938
1021 Cleveland Ave, Park Ridge, IL 60068
$-1,880
Cash flow
-16.4%
Cash-on-Cash Return
1.9%
Cap rate
0.6%
Rent to Value Ratio
Active under contract
$549,500
4
bds
|
3
ba
|
2,176
sqft
|
built
1964
604 S Reuter Dr, Arlington Heights, IL 60005
$-1,121
Cash flow
-10.6%
Cash-on-Cash Return
3.2%
Cap rate
0.6%
Rent to Value Ratio

Active
$650,000
6
bds
|
4
ba
|
5,000
sqft
|
built
1986
9344 N Lincoln Ave, Niles, IL 60714
$-445
Cash flow
-3.6%
Cash-on-Cash Return
4.9%
Cap rate
0.8%
Rent to Value Ratio
Active
$569,000
3
bds
|
3
ba
|
2,100
sqft
|
built
1913
827 Thomas Ave, Forest Park, IL 60130
$-608
Cash flow
-5.6%
Cash-on-Cash Return
4.4%
Cap rate
0.8%
Rent to Value Ratio

Active
$398,900
3
bds
|
1
ba
|
1,114
sqft
|
built
1978
24W500 Seabrook Ct, Naperville, IL 60540
$-843
Cash flow
-11.0%
Cash-on-Cash Return
3.1%
Cap rate
0.6%
Rent to Value Ratio
Active
$925,000
4
bds
|
4
ba
|
4,325
sqft
|
built
1956
8081 Tennessee Ave, Willowbrook, IL 60527
$-2,853
Cash flow
-16.1%
Cash-on-Cash Return
2.0%
Cap rate
0.3%
Rent to Value Ratio

Active
$579,900
3
bds
|
3
ba
|
1,890
sqft
|
built
1958
815 Santa Maria Dr, Naperville, IL 60540
$-1,462
Cash flow
-13.2%
Cash-on-Cash Return
2.7%
Cap rate
0.6%
Rent to Value Ratio

Active
$399,900
2
bds
|
1
ba
|
0
sqft
|
built
1962
1455 N Sandburg Ter, Chicago, IL 60610
$-561
Cash flow
-7.3%
Cash-on-Cash Return
4.0%
Cap rate
0.9%
Rent to Value Ratio
Active
$150,000
6
bds
|
2
ba
|
0
sqft
|
built
1890
4321 W Maypole Ave, Chicago, IL 60624
$391
Cash flow
13.6%
Cash-on-Cash Return
8.8%
Cap rate
1.2%
Rent to Value Ratio

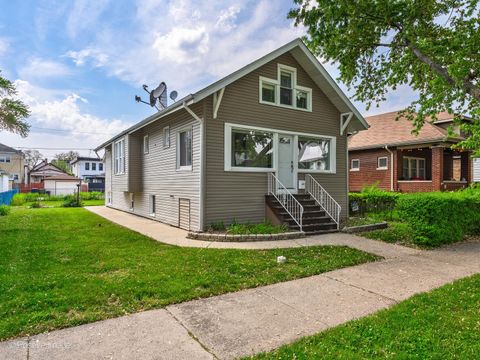
Active
$298,000
3
bds
|
2
ba
|
2,100
sqft
|
built
1919
8344 S Ada St, Chicago, IL 60620
$-327
Cash flow
-5.7%
Cash-on-Cash Return
4.4%
Cap rate
0.6%
Rent to Value Ratio

Active
$374,000
3
bds
|
2
ba
|
1,577
sqft
|
built
1929
2827 N 77th Ct, Elmwood Park, IL 60707
$-310
Cash flow
-4.3%
Cash-on-Cash Return
4.7%
Cap rate
0.8%
Rent to Value Ratio
Active
$225,000
2
bds
|
2
ba
|
1,300
sqft
|
built
2004
15505 Cicero Ave, Oak Forest, IL 60452
$-348
Cash flow
-8.1%
Cash-on-Cash Return
3.8%
Cap rate
1.0%
Rent to Value Ratio

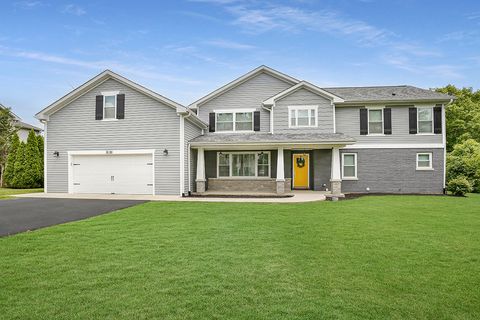
Active
$464,900
3
bds
|
2
ba
|
1,747
sqft
|
built
1979
479 Newport Dr, Naperville, IL 60565
$-626
Cash flow
-7.0%
Cash-on-Cash Return
4.1%
Cap rate
0.7%
Rent to Value Ratio
Active
$194,700
3
bds
|
2
ba
|
1,089
sqft
|
built
1948
21963 Millard Ave, Richton Park, IL 60471
$342
Cash flow
9.2%
Cash-on-Cash Return
7.8%
Cap rate
1.3%
Rent to Value Ratio
Active
$400,000
3
bds
|
3
ba
|
2,054
sqft
|
built
2003
1611 Wintercrest Ln, Shorewood, IL 60404
$-459
Cash flow
-6.0%
Cash-on-Cash Return
4.3%
Cap rate
0.8%
Rent to Value Ratio
Active
$365,000
3
bds
|
2
ba
|
1,081
sqft
|
built
1975
4925 Timber Ct, Oak Forest, IL 60452
$-964
Cash flow
-13.8%
Cash-on-Cash Return
2.5%
Cap rate
0.7%
Rent to Value Ratio
Active
$319,900
3
bds
|
2
ba
|
1,821
sqft
|
built
1972
612 Thornwood Dr, South Holland, IL 60473
$-412
Cash flow
-6.7%
Cash-on-Cash Return
4.1%
Cap rate
0.9%
Rent to Value Ratio
Active under contract
$434,900
3
bds
|
2
ba
|
1,625
sqft
|
built
1965
476 Raupp Blvd, Buffalo Grove, IL 60089
$-507
Cash flow
-6.1%
Cash-on-Cash Return
4.3%
Cap rate
0.7%
Rent to Value Ratio
Active under contract
$375,000
5
bds
|
3
ba
|
2,007
sqft
|
built
1992
2184 N Masters Ln, Lake Villa, IL 60046
$-660
Cash flow
-9.2%
Cash-on-Cash Return
3.6%
Cap rate
0.7%
Rent to Value Ratio
Active
$419,000
4
bds
|
3
ba
|
3,623
sqft
|
built
1997
18507 Indie Ct, Hazel Crest, IL 60429
$-796
Cash flow
-9.9%
Cash-on-Cash Return
3.4%
Cap rate
0.9%
Rent to Value Ratio

Active
$389,000
2
bds
|
2
ba
|
2,023
sqft
|
built
1990
20936 W Orangeblossom Ln, Plainfield, IL 60544
$-1,102
Cash flow
-14.8%
Cash-on-Cash Return
2.3%
Cap rate
0.6%
Rent to Value Ratio
Active
$699,000
3
bds
|
2
ba
|
2,294
sqft
|
built
1940
2333 Catherine St, Northbrook, IL 60062
$-1,531
Cash flow
-11.4%
Cash-on-Cash Return
3.1%
Cap rate
0.6%
Rent to Value Ratio

Active
$399,900
3
bds
|
3
ba
|
1,274
sqft
|
built
1977
38689 N Boulevard View Ave, Wadsworth, IL 60083
$-382
Cash flow
-5.0%
Cash-on-Cash Return
4.5%
Cap rate
0.7%
Rent to Value Ratio

Active
$795,000
3
bds
|
4
ba
|
1,750
sqft
|
built
1908
4134 W Roscoe St, Chicago, IL 60641
$-3,037
Cash flow
-19.9%
Cash-on-Cash Return
1.1%
Cap rate
0.3%
Rent to Value Ratio
Active
$548,888
2
bds
|
2
ba
|
1,401
sqft
|
built
1940
1314 Saint Johns Ave, Highland Park, IL 60035
$-1,311
Cash flow
-12.5%
Cash-on-Cash Return
2.8%
Cap rate
0.6%
Rent to Value Ratio
Active under contract
$265,000
3
bds
|
2
ba
|
1,738
sqft
|
built
1978
1003 Sandpiper Ct, Bartlett, IL 60103
$-444
Cash flow
-8.7%
Cash-on-Cash Return
3.7%
Cap rate
0.8%
Rent to Value Ratio
Active
$2,580,000
5
bds
|
6
ba
|
0
sqft
|
built
1907
622 S Washington St, Hinsdale, IL 60521
$-9,854
Cash flow
-19.9%
Cash-on-Cash Return
1.1%
Cap rate
0.3%
Rent to Value Ratio

Active under contract
$475,000
5
bds
|
3
ba
|
3,507
sqft
|
built
1947
6158 S Austin Ave, Chicago, IL 60638
$-995
Cash flow
-10.9%
Cash-on-Cash Return
3.2%
Cap rate
0.5%
Rent to Value Ratio
Active
$459,900
2
bds
|
2
ba
|
1,400
sqft
|
built
1999
2640 Summit Dr, Glenview, IL 60025
$-739
Cash flow
-8.4%
Cash-on-Cash Return
3.7%
Cap rate
0.8%
Rent to Value Ratio
Active
$725,000
4
bds
|
3
ba
|
2,618
sqft
|
built
1979
6382 Twin Oaks Ln, Lisle, IL 60532
$-1,892
Cash flow
-13.6%
Cash-on-Cash Return
2.5%
Cap rate
0.5%
Rent to Value Ratio

Active
$775,000
7
bds
|
4
ba
|
0
sqft
|
built
1928
2625 W Greenleaf Ave, Chicago, IL 60645
$-2,929
Cash flow
-19.7%
Cash-on-Cash Return
1.1%
Cap rate
0.3%
Rent to Value Ratio

Active
$239,900
4
bds
|
2
ba
|
1,559
sqft
|
built
1941
37 Waltham St, Calumet City, IL 60409
$240
Cash flow
5.2%
Cash-on-Cash Return
6.9%
Cap rate
0.8%
Rent to Value Ratio
Active
$359,900
4
bds
|
3
ba
|
1,036
sqft
|
built
1927
2816 Cuyler Ave, Berwyn, IL 60402
$-259
Cash flow
-3.8%
Cash-on-Cash Return
4.8%
Cap rate
0.8%
Rent to Value Ratio

Active under contract
$749,000
5
bds
|
3
ba
|
3,900
sqft
|
built
2012
26814 Basswood Cir, Plainfield, IL 60585
$-1,726
Cash flow
-12.0%
Cash-on-Cash Return
2.9%
Cap rate
0.6%
Rent to Value Ratio
Active
$529,000
4
bds
|
2
ba
|
1,900
sqft
|
built
1966
2023 N Shenandoah Dr, Arlington Heights, IL 60004
$-765
Cash flow
-7.5%
Cash-on-Cash Return
3.9%
Cap rate
0.7%
Rent to Value Ratio