Illinois Investment Properties for Sale
Browse homes for sale and investment properties in Illinois. Refine your search by price, property type, or more.
Best cash flowing properties in Illinois
Active
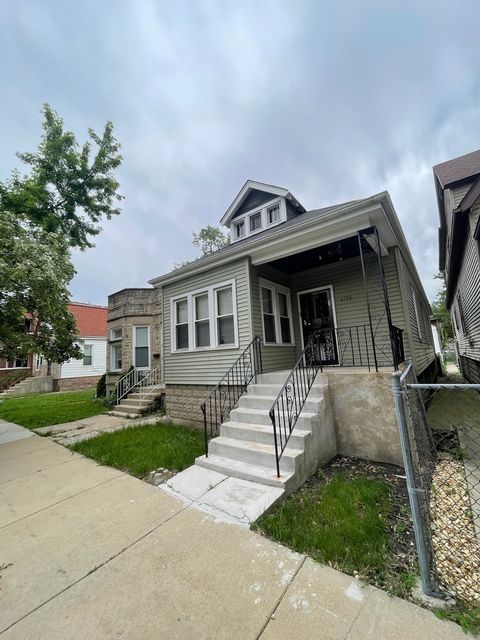
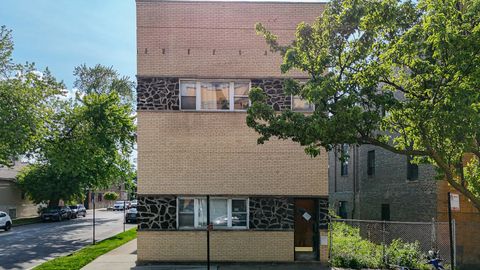
$169,999
3
bds
|
1
ba
|
1,000
sqft
|
built
1923
6536 S Loomis Blvd, Chicago, IL 60636
$405
Cash flow
12.4%
Cash-on-Cash Return
8.5%
Cap rate
1.1%
Rent to Value Ratio
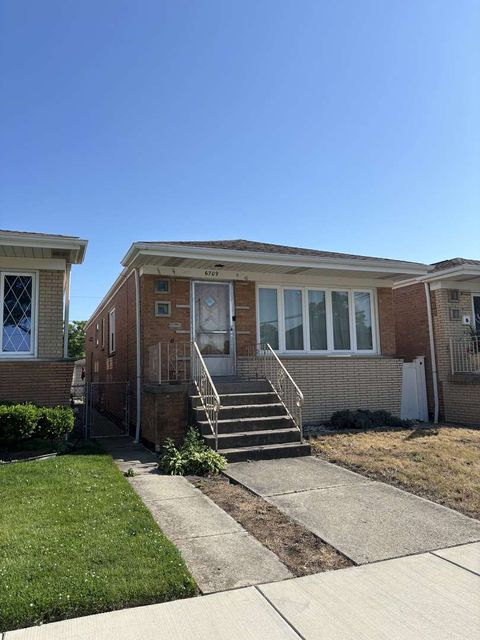
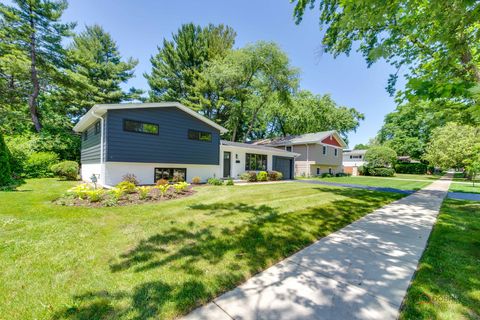
Active
$285,000
3
bds
|
1
ba
|
1,040
sqft
|
built
1962
6709 W 59th St, Chicago, IL 60638
$5
Cash flow
0.1%
Cash-on-Cash Return
6.3%
Cap rate
0.9%
Rent to Value Ratio
9,442 out of 17,248 properties for sale in Illinois
Limited Results Shown
Create a free account, or log in to reveal all property listings and enjoy the complete experience.
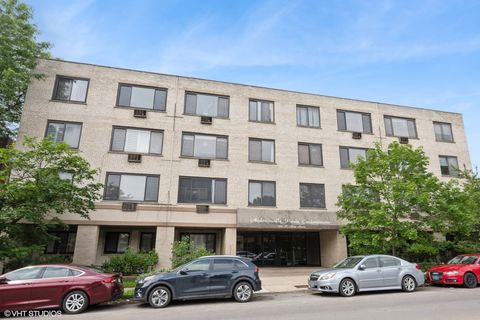
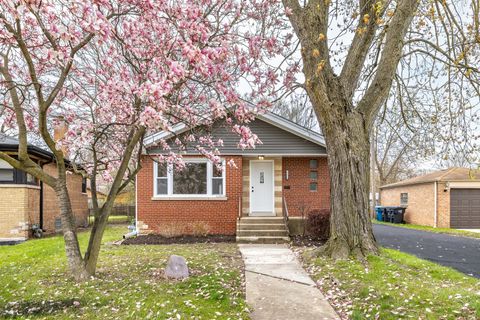
Active
$250,000
2
bds
|
1
ba
|
1,150
sqft
|
built
1964
6060 N Ridge Ave, Chicago, IL 60660
$-569
Cash flow
-11.9%
Cash-on-Cash Return
3.5%
Cap rate
0.8%
Rent to Value Ratio
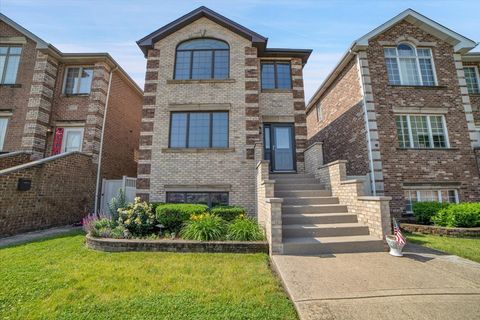
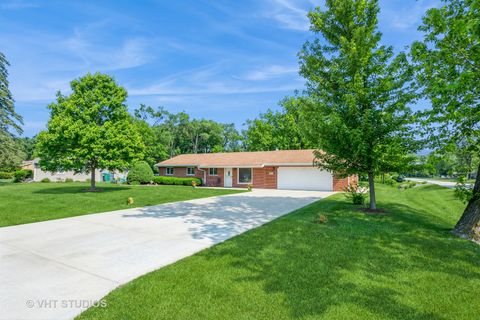
Active
$525,000
3
bds
|
4
ba
|
2,400
sqft
|
built
2006
6825 W 64th Pl, Chicago, IL 60638
$-782
Cash flow
-7.8%
Cash-on-Cash Return
4.5%
Cap rate
0.7%
Rent to Value Ratio
Active
$285,000
3
bds
|
1
ba
|
1,040
sqft
|
built
1962
6709 W 59th St, Chicago, IL 60638
$5
Cash flow
0.1%
Cash-on-Cash Return
6.3%
Cap rate
0.9%
Rent to Value Ratio
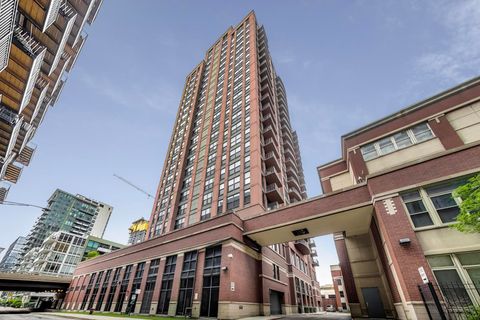
Active
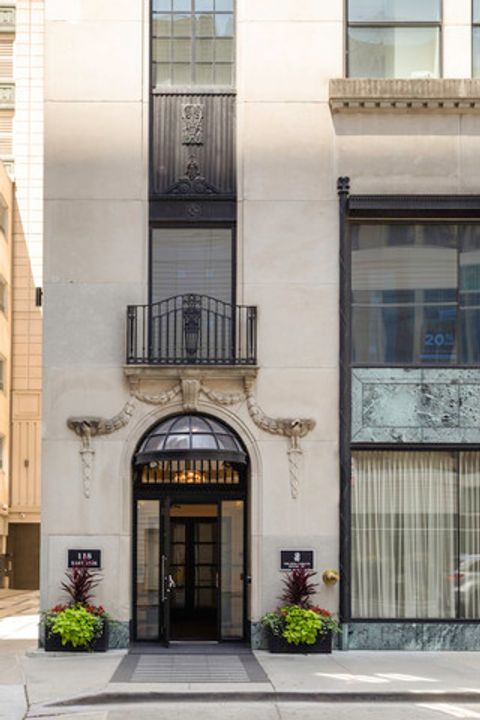
$1,160,000
2
bds
|
3
ba
|
1,912
sqft
|
built
2012
118 E Erie St, Chicago, IL 60611
$-6,773
Cash flow
-30.5%
Cash-on-Cash Return
-0.7%
Cap rate
0.5%
Rent to Value Ratio
Active
$720,000
9
bds
|
4
ba
|
0
sqft
|
built
1889
2958 S Lowe Ave, Chicago, IL 60616
$-3,311
Cash flow
-24.0%
Cash-on-Cash Return
0.7%
Cap rate
0.3%
Rent to Value Ratio
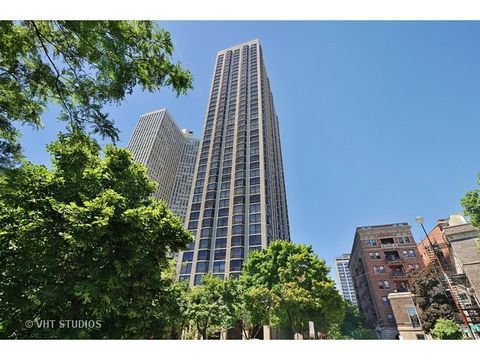
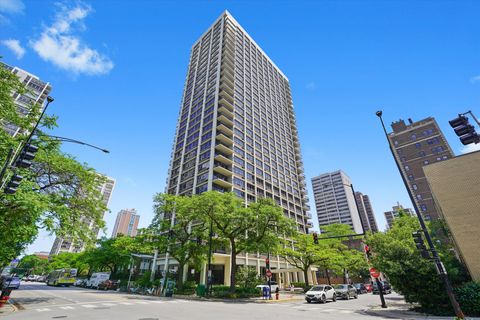
Active
$189,000
0
bds
|
1
ba
|
585
sqft
|
built
1973
2650 N Lakeview Ave, Chicago, IL 60614
$-282
Cash flow
-7.8%
Cash-on-Cash Return
3.9%
Cap rate
1.0%
Rent to Value Ratio
Active
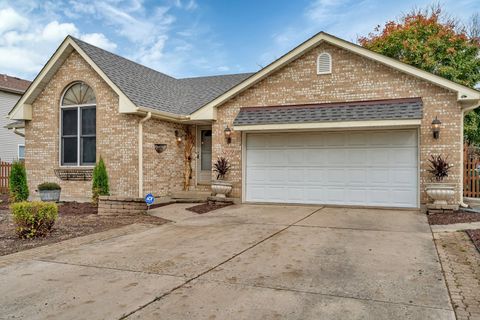
$395,000
3
bds
|
3
ba
|
3,400
sqft
|
built
1994
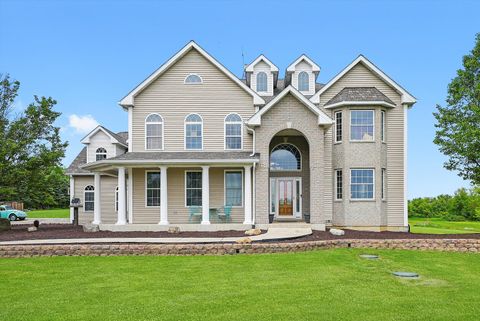
5209 Meadowbrook St, Plainfield, IL 60586
$-285
Cash flow
-3.8%
Cash-on-Cash Return
5.4%
Cap rate
0.9%
Rent to Value Ratio
Active
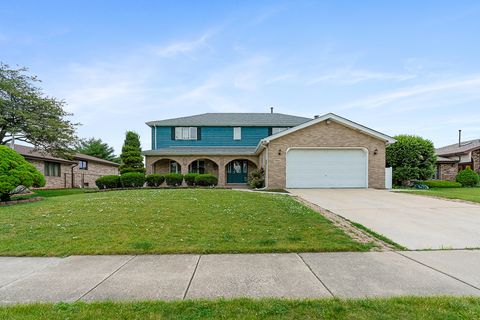
$550,000
4
bds
|
4
ba
|
3,088
sqft
|
built
1988
7435 W 157th St, Orland Park, IL 60462
$-1,158
Cash flow
-11.0%
Cash-on-Cash Return
3.7%
Cap rate
0.7%
Rent to Value Ratio

Active
$175,000
3
bds
|
2
ba
|
1,120
sqft
|
built
1974
4918 Montery Dr, Richton Park, IL 60471
$-78
Cash flow
-2.3%
Cash-on-Cash Return
5.1%
Cap rate
1.1%
Rent to Value Ratio
Active
$299,000
3
bds
|
2
ba
|
1,682
sqft
|
built
1951
1326 N Poplar Ave, Round Lake Beach, IL 60073
$-262
Cash flow
-4.6%
Cash-on-Cash Return
4.6%
Cap rate
0.7%
Rent to Value Ratio
Active
$299,000
5
bds
|
3
ba
|
2,016
sqft
|
built
1923
1336 Cuyler Ave, Berwyn, IL 60402
$-235
Cash flow
-4.1%
Cash-on-Cash Return
4.7%
Cap rate
0.9%
Rent to Value Ratio

Active
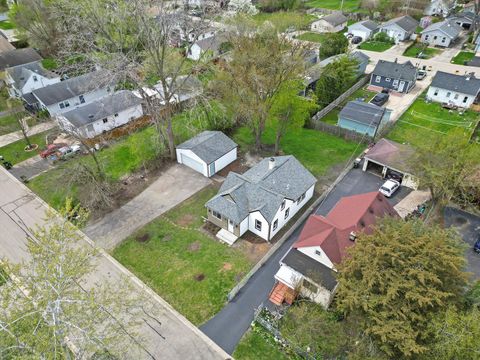
$450,000
3
bds
|
3
ba
|
0
sqft
|
built
1880
422 Locust St, Elgin, IL 60123
$-1,104
Cash flow
-12.8%
Cash-on-Cash Return
2.7%
Cap rate
0.5%
Rent to Value Ratio

Active
$375,000
3
bds
|
1
ba
|
1,131
sqft
|
built
1952
21W534 Bemis Rd, Glen Ellyn, IL 60137
$-346
Cash flow
-4.8%
Cash-on-Cash Return
4.6%
Cap rate
0.7%
Rent to Value Ratio
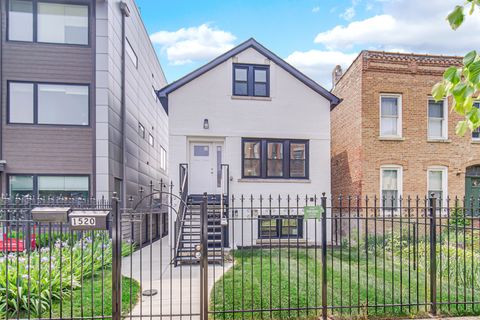
Active
$875,000
4
bds
|
3
ba
|
0
sqft
|
built
1890
1520 N Campbell Ave, Chicago, IL 60622
$-2,822
Cash flow
-16.8%
Cash-on-Cash Return
1.8%
Cap rate
0.3%
Rent to Value Ratio
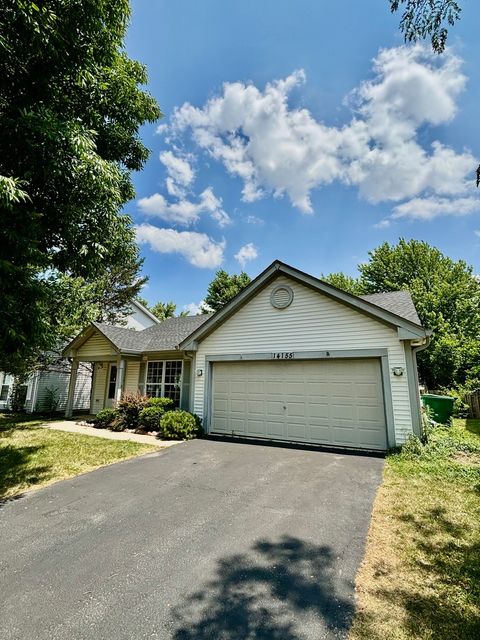
Active
$275,000
2
bds
|
2
ba
|
1,020
sqft
|
built
1998
14155 S Hemingway Cir, Plainfield, IL 60544
$-281
Cash flow
-5.3%
Cash-on-Cash Return
4.5%
Cap rate
0.8%
Rent to Value Ratio

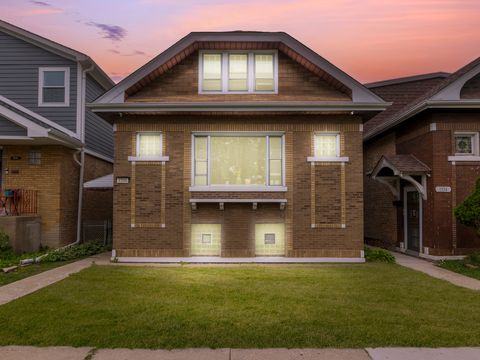
Active
$819,900
4
bds
|
3
ba
|
3,160
sqft
|
built
1924
5426 N Bernard St, Chicago, IL 60625
$-2,548
Cash flow
-16.2%
Cash-on-Cash Return
1.9%
Cap rate
0.3%
Rent to Value Ratio

Active
$474,500
4
bds
|
3
ba
|
2,075
sqft
|
built
1949
3529 S 54th Ave, Cicero, IL 60804
$-670
Cash flow
-7.4%
Cash-on-Cash Return
4.0%
Cap rate
0.7%
Rent to Value Ratio
Active
$245,000
2
bds
|
1
ba
|
980
sqft
|
built
1974
1833 Four Lakes Ave, Lisle, IL 60532
$-450
Cash flow
-9.6%
Cash-on-Cash Return
3.5%
Cap rate
0.9%
Rent to Value Ratio
Active
$709,000
2
bds
|
2
ba
|
0
sqft
|
built
2005
3238 N Kenmore Ave, Chicago, IL 60657
$-1,286
Cash flow
-9.5%
Cash-on-Cash Return
4.1%
Cap rate
0.7%
Rent to Value Ratio
Active
$368,000
3
bds
|
2
ba
|
1,900
sqft
|
built
2007
2231 W Maypole Ave, Chicago, IL 60612
$-964
Cash flow
-13.7%
Cash-on-Cash Return
3.1%
Cap rate
0.7%
Rent to Value Ratio
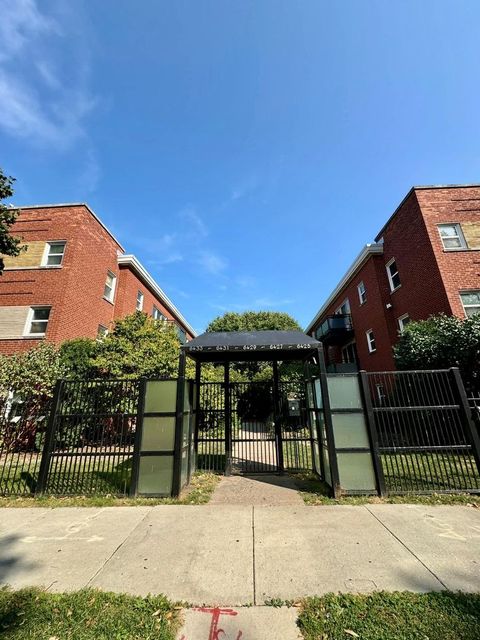
Active
$220,000
2
bds
|
2
ba
|
986
sqft
|
built
1954
6433 N Damen Ave, Chicago, IL 60645
$-668
Cash flow
-15.8%
Cash-on-Cash Return
2.6%
Cap rate
0.7%
Rent to Value Ratio
Active
$409,900
7
bds
|
2
ba
|
0
sqft
|
built
1927
5015 S Talman Ave, Chicago, IL 60632
$-1,199
Cash flow
-15.3%
Cash-on-Cash Return
2.8%
Cap rate
0.4%
Rent to Value Ratio
Active
$1,200,000
3
bds
|
3
ba
|
2,400
sqft
|
built
1998
210 W Scott St, Chicago, IL 60610
$-3,165
Cash flow
-13.8%
Cash-on-Cash Return
3.1%
Cap rate
0.6%
Rent to Value Ratio
Active
$400,000
2
bds
|
1
ba
|
0
sqft
|
built
1968
88 W Schiller St, Chicago, IL 60610
$-991
Cash flow
-12.9%
Cash-on-Cash Return
3.3%
Cap rate
0.9%
Rent to Value Ratio
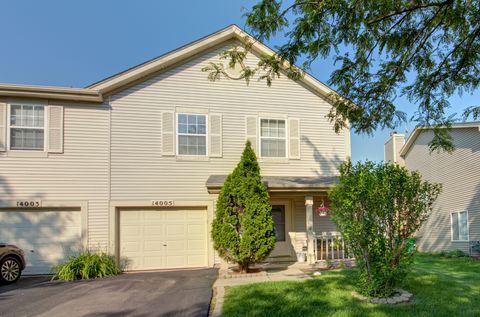
Active
$280,000
2
bds
|
3
ba
|
1,216
sqft
|
built
1995
14005 Danbury Dr, Plainfield, IL 60544
$-587
Cash flow
-10.9%
Cash-on-Cash Return
3.8%
Cap rate
0.7%
Rent to Value Ratio
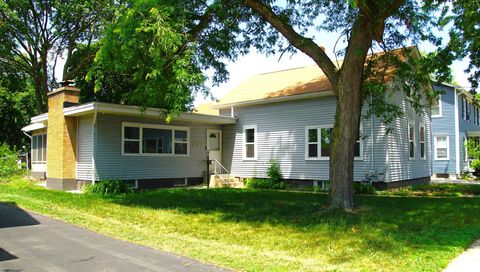
Active
$275,000
3
bds
|
2
ba
|
1,692
sqft
|
built
1904
459 Talma St, Aurora, IL 60505
$-107
Cash flow
-2.0%
Cash-on-Cash Return
5.8%
Cap rate
0.9%
Rent to Value Ratio
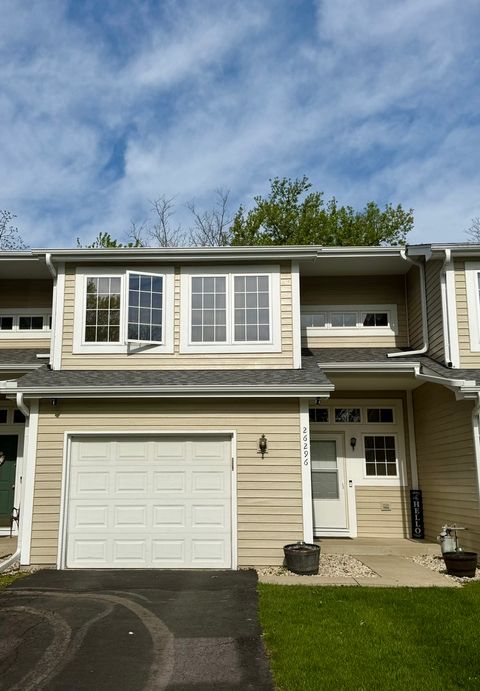
Active
$310,000
3
bds
|
3
ba
|
1,404
sqft
|
built
1996
26296 N Green St, Mundelein, IL 60060
$-487
Cash flow
-8.2%
Cash-on-Cash Return
3.8%
Cap rate
0.8%
Rent to Value Ratio
Active
$164,900
2
bds
|
1
ba
|
1,085
sqft
|
built
1991
4572 W 131st St, Alsip, IL 60803
$-168
Cash flow
-5.3%
Cash-on-Cash Return
4.5%
Cap rate
1.1%
Rent to Value Ratio

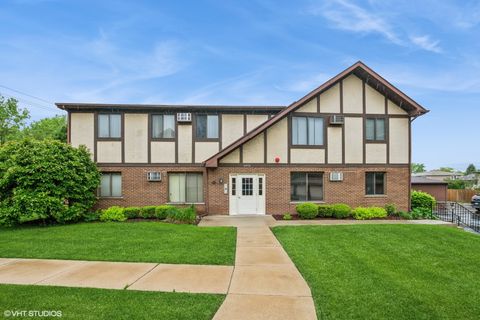
Active
$84,999
2
bds
|
2
ba
|
1,100
sqft
|
built
1976
500 Park Ave, Calumet City, IL 60409
$-110
Cash flow
-6.8%
Cash-on-Cash Return
4.1%
Cap rate
2.2%
Rent to Value Ratio
Active
$350,000
1
bds
|
1
ba
|
0
sqft
|
built
2001
330 N Jefferson St, Chicago, IL 60661
$-988
Cash flow
-14.7%
Cash-on-Cash Return
2.3%
Cap rate
0.8%
Rent to Value Ratio
Active
$305,000
3
bds
|
2
ba
|
2,027
sqft
|
built
1956
15600 Orchid Dr, South Holland, IL 60473
$-289
Cash flow
-4.9%
Cash-on-Cash Return
4.5%
Cap rate
0.8%
Rent to Value Ratio
Active
$169,999
3
bds
|
1
ba
|
1,000
sqft
|
built
1923
6536 S Loomis Blvd, Chicago, IL 60636
$405
Cash flow
12.4%
Cash-on-Cash Return
8.5%
Cap rate
1.1%
Rent to Value Ratio
Active
$369,000
4
bds
|
2
ba
|
1,214
sqft
|
built
1961
8700 W 168th St, Orland Park, IL 60462
$-57
Cash flow
-0.8%
Cash-on-Cash Return
5.5%
Cap rate
0.8%
Rent to Value Ratio

Active
$349,900
3
bds
|
1
ba
|
1,200
sqft
|
built
1911
2118 W North Ave, Chicago, IL 60647
$-448
Cash flow
-6.7%
Cash-on-Cash Return
4.1%
Cap rate
0.7%
Rent to Value Ratio
Active
$528,000
3
bds
|
2
ba
|
1,833
sqft
|
built
1960
222 S Maple St, Palatine, IL 60067
$-1,066
Cash flow
-10.5%
Cash-on-Cash Return
3.3%
Cap rate
0.5%
Rent to Value Ratio

Active
$699,900
4
bds
|
3
ba
|
3,000
sqft
|
built
1973
22W046 Mc Cormick Ave, Glen Ellyn, IL 60137
$-1,934
Cash flow
-14.4%
Cash-on-Cash Return
2.4%
Cap rate
0.5%
Rent to Value Ratio

Active
$459,999
3
bds
|
3
ba
|
2,737
sqft
|
built
2005
3123 Concord Ln, Wadsworth, IL 60083
$-1,164
Cash flow
-13.2%
Cash-on-Cash Return
2.6%
Cap rate
0.7%
Rent to Value Ratio
Active
$995,000
6
bds
|
5
ba
|
7,516
sqft
|
built
2004
16512 Nelson Rd, Woodstock, IL 60098
$-3,448
Cash flow
-18.1%
Cash-on-Cash Return
1.5%
Cap rate
0.4%
Rent to Value Ratio
Active
$649,000
4
bds
|
3
ba
|
2,407
sqft
|
built
1948
5605 S Nordica Ave, Chicago, IL 60638
$-1,229
Cash flow
-9.9%
Cash-on-Cash Return
4.0%
Cap rate
0.6%
Rent to Value Ratio
Active
$579,000
2
bds
|
3
ba
|
1,885
sqft
|
built
1994
2132 W Evergreen Ave, Chicago, IL 60622
$-1,161
Cash flow
-10.5%
Cash-on-Cash Return
3.9%
Cap rate
0.8%
Rent to Value Ratio