Illinois Investment Properties for Sale
Browse homes for sale and investment properties in Illinois. Refine your search by price, property type, or more.
Best cash flowing properties in Illinois
Active
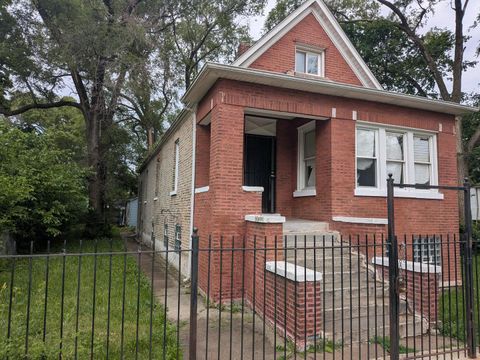
$149,999
5
bds
|
2
ba
|
1,148
sqft
|
built
1896
7017 S Hermitage Ave, Chicago, IL 60636
$714
Cash flow
24.8%
Cash-on-Cash Return
11.4%
Cap rate
1.5%
Rent to Value Ratio

Active
$132,995
4
bds
|
1
ba
|
1,229
sqft
|
built
1950
2319 170th St, Hazel Crest, IL 60429
$456
Cash flow
17.9%
Cash-on-Cash Return
9.8%
Cap rate
1.9%
Rent to Value Ratio
9,442 out of 17,248 properties for sale in Illinois
Limited Results Shown
Create a free account, or log in to reveal all property listings and enjoy the complete experience.
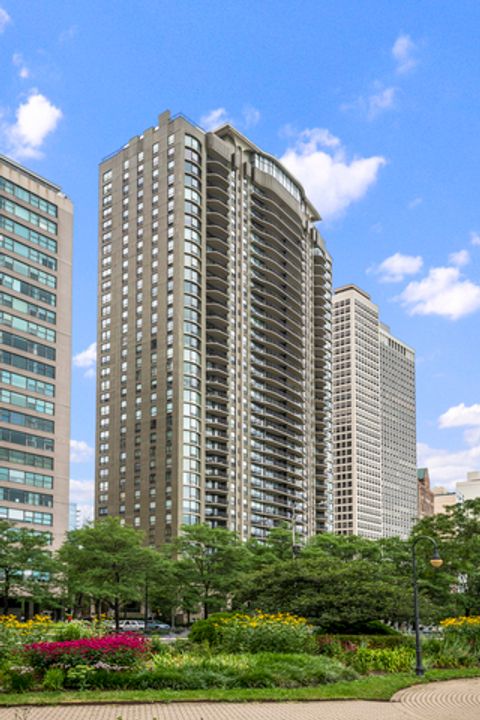
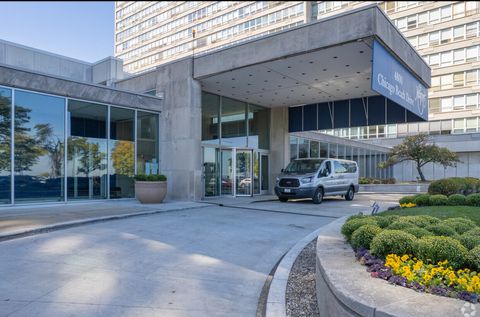
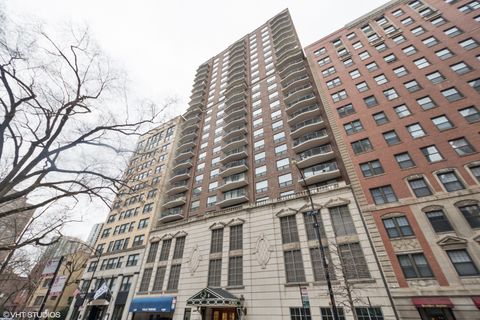
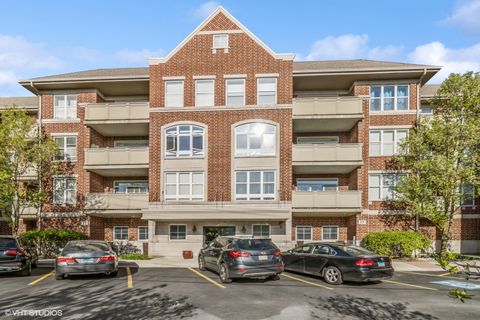
Active
$1,045,000
1
bds
|
3
ba
|
2,230
sqft
|
built
1964
1040 N Lake Shore Dr, Chicago, IL 60611
$-5,093
Cash flow
-25.4%
Cash-on-Cash Return
-0.2%
Cap rate
0.5%
Rent to Value Ratio
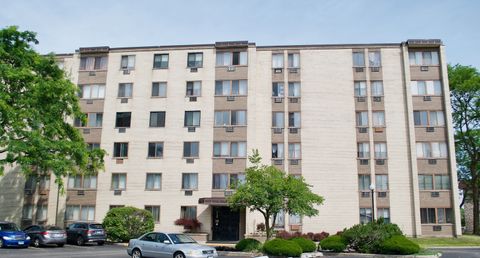
Active
$162,000
2
bds
|
2
ba
|
1,000
sqft
|
built
1969
9720 S Pulaski Rd, Oak Lawn, IL 60453
$-98
Cash flow
-3.2%
Cash-on-Cash Return
5.0%
Cap rate
1.1%
Rent to Value Ratio
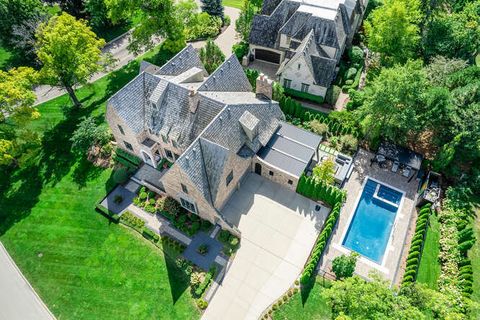
Active
$3,495,000
6
bds
|
7
ba
|
6,995
sqft
|
built
2014
31 Concord Dr, Oak Brook, IL 60523
$-14,909
Cash flow
-22.3%
Cash-on-Cash Return
0.6%
Cap rate
0.2%
Rent to Value Ratio
Active
$625,000
4
bds
|
4
ba
|
4,434
sqft
|
built
2000
16260 W Mohawk Ct, Lockport, IL 60441
$-1,086
Cash flow
-9.1%
Cash-on-Cash Return
3.6%
Cap rate
0.7%
Rent to Value Ratio
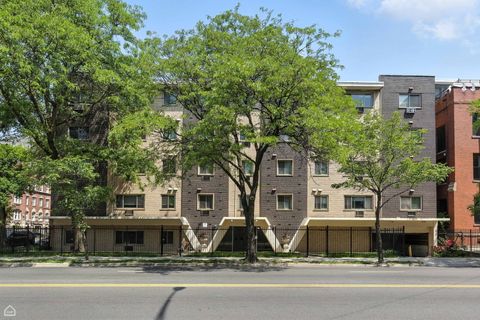
Active
$245,000
2
bds
|
2
ba
|
1,100
sqft
|
built
1962
4800 S Chicago Beach Dr, Chicago, IL 60615
$-1,062
Cash flow
-22.6%
Cash-on-Cash Return
0.5%
Cap rate
0.9%
Rent to Value Ratio
Active
$284,999
3
bds
|
2
ba
|
1,440
sqft
|
built
1962
1520 Pennsylvania Ave, Des Plaines, IL 60018
$-332
Cash flow
-6.1%
Cash-on-Cash Return
4.3%
Cap rate
0.8%
Rent to Value Ratio
Active
$1,300,000
6
bds
|
5
ba
|
6,019
sqft
|
built
1996
18215 Gougar Rd, Joliet, IL 60432
$-6,235
Cash flow
-25.0%
Cash-on-Cash Return
-0.1%
Cap rate
0.2%
Rent to Value Ratio
Active
$319,900
3
bds
|
3
ba
|
1,756
sqft
|
built
2023
864 Briar Glen Ct, Hampshire, IL 60140
$-337
Cash flow
-5.5%
Cash-on-Cash Return
4.4%
Cap rate
0.9%
Rent to Value Ratio

Active
$574,000
3
bds
|
2
ba
|
2,300
sqft
|
built
1949
9337 Crawford Ave, Evanston, IL 60203
$-739
Cash flow
-6.7%
Cash-on-Cash Return
4.1%
Cap rate
0.7%
Rent to Value Ratio
Active
$1,380,000
5
bds
|
5
ba
|
3,248
sqft
|
built
2001
1619 Patriot Blvd, Glenview, IL 60026
$-4,249
Cash flow
-16.1%
Cash-on-Cash Return
2.0%
Cap rate
0.4%
Rent to Value Ratio
Active
$190,000
1
bds
|
1
ba
|
880
sqft
|
built
1970
461 N Jonathan Dr, Palatine, IL 60074
$-377
Cash flow
-10.4%
Cash-on-Cash Return
3.3%
Cap rate
0.8%
Rent to Value Ratio
Active
$134,000
8
bds
|
4
ba
|
0
sqft
|
built
1885
2900 E 87th St, Chicago, IL 60617
$208
Cash flow
8.1%
Cash-on-Cash Return
7.5%
Cap rate
1.1%
Rent to Value Ratio
Active
$499,900
2
bds
|
2
ba
|
1,250
sqft
|
built
1988
1250 N Dearborn St, Chicago, IL 60610
$-1,628
Cash flow
-17.0%
Cash-on-Cash Return
1.8%
Cap rate
0.8%
Rent to Value Ratio
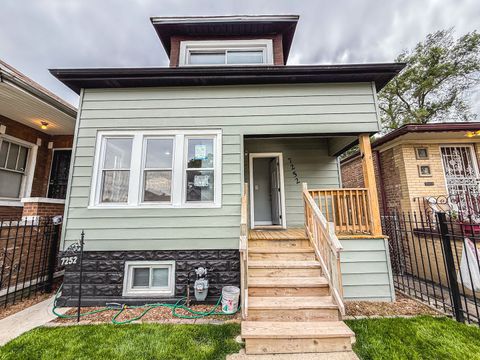
Active
$275,000
4
bds
|
2
ba
|
1,500
sqft
|
built
1924
7252 S Wood St, Chicago, IL 60636
$-332
Cash flow
-6.3%
Cash-on-Cash Return
4.8%
Cap rate
0.6%
Rent to Value Ratio
Active
$175,000
5
bds
|
2
ba
|
0
sqft
|
built
1898
4910 W Gladys Ave, Chicago, IL 60644
$375
Cash flow
11.2%
Cash-on-Cash Return
8.8%
Cap rate
1.3%
Rent to Value Ratio
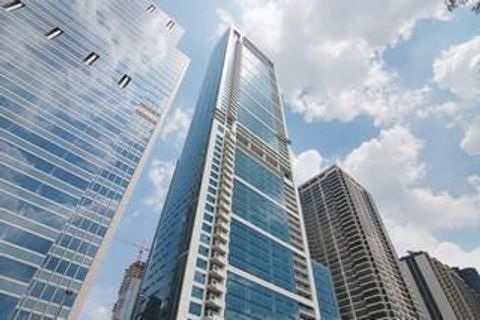
Active
$1,125,000
2
bds
|
2
ba
|
1,567
sqft
|
built
2007
340 E Randolph St, Chicago, IL 60601
$-4,938
Cash flow
-22.9%
Cash-on-Cash Return
1.0%
Cap rate
0.5%
Rent to Value Ratio
Active
$1,250,000
4
bds
|
4
ba
|
4,080
sqft
|
built
2006
1959 W Berwyn Ave, Chicago, IL 60640
$-3,290
Cash flow
-13.7%
Cash-on-Cash Return
3.1%
Cap rate
0.6%
Rent to Value Ratio
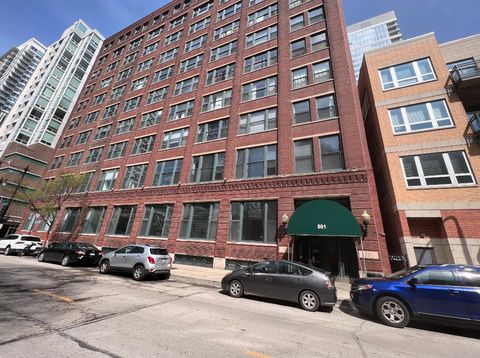
Active
$325,000
2
bds
|
1
ba
|
1,350
sqft
|
built
1912
801 S Wells St, Chicago, IL 60607
$-671
Cash flow
-10.8%
Cash-on-Cash Return
3.8%
Cap rate
0.9%
Rent to Value Ratio
Active
$149,900
1
bds
|
1
ba
|
0
sqft
|
built
1972
1060 W Hollywood Ave, Chicago, IL 60660
$-106
Cash flow
-3.7%
Cash-on-Cash Return
5.4%
Cap rate
1.1%
Rent to Value Ratio
Active
$250,000
3
bds
|
2
ba
|
2,600
sqft
|
built
1918
7959 S Constance Ave, Chicago, IL 60617
$53
Cash flow
1.1%
Cash-on-Cash Return
6.5%
Cap rate
0.9%
Rent to Value Ratio
Active
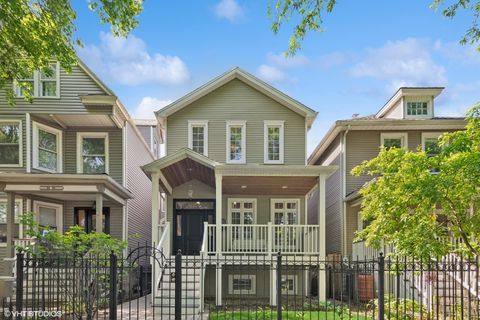
$149,999
5
bds
|
2
ba
|
1,148
sqft
|
built
1896
7017 S Hermitage Ave, Chicago, IL 60636
$714
Cash flow
24.8%
Cash-on-Cash Return
11.4%
Cap rate
1.5%
Rent to Value Ratio
Active
$390,000
3
bds
|
3
ba
|
1,624
sqft
|
built
1993
2031 Edinburgh Ln, Aurora, IL 60504
$-829
Cash flow
-11.1%
Cash-on-Cash Return
3.7%
Cap rate
0.7%
Rent to Value Ratio
Active
$400,000
3
bds
|
2
ba
|
2,000
sqft
|
built
1985
9242 Pembrooke Ln, Orland Park, IL 60462
$-151
Cash flow
-2.0%
Cash-on-Cash Return
5.8%
Cap rate
0.8%
Rent to Value Ratio
Active
$289,000
2
bds
|
2
ba
|
1,267
sqft
|
built
2002
640 Mc Henry Rd, Wheeling, IL 60090
$-304
Cash flow
-5.5%
Cash-on-Cash Return
4.4%
Cap rate
0.9%
Rent to Value Ratio

Active
$290,000
4
bds
|
3
ba
|
0
sqft
|
built
1953
14848 Keystone Ave, Midlothian, IL 60445
$-317
Cash flow
-5.7%
Cash-on-Cash Return
4.4%
Cap rate
0.8%
Rent to Value Ratio

Active
$689,000
4
bds
|
4
ba
|
3,820
sqft
|
built
2006
1938 Barrington Ave, Bolingbrook, IL 60490
$-1,449
Cash flow
-11.0%
Cash-on-Cash Return
3.2%
Cap rate
0.6%
Rent to Value Ratio

Active
$219,900
4
bds
|
2
ba
|
966
sqft
|
built
1895
10141 S Wallace St, Chicago, IL 60628
$147
Cash flow
3.5%
Cash-on-Cash Return
6.5%
Cap rate
0.9%
Rent to Value Ratio

Active
$690,000
2
bds
|
2
ba
|
1,520
sqft
|
built
2000
1122 N Dearborn St, Chicago, IL 60610
$-4,227
Cash flow
-32.0%
Cash-on-Cash Return
-1.7%
Cap rate
0.4%
Rent to Value Ratio
Active
$980,000
3
bds
|
2
ba
|
2,150
sqft
|
built
1970
1212 N Lake Shore Dr, Chicago, IL 60610
$-3,347
Cash flow
-17.8%
Cash-on-Cash Return
1.6%
Cap rate
0.7%
Rent to Value Ratio
Active
$405,000
2
bds
|
2
ba
|
1,733
sqft
|
built
2006
77 N Quentin Rd, Palatine, IL 60067
$-883
Cash flow
-11.4%
Cash-on-Cash Return
3.1%
Cap rate
0.8%
Rent to Value Ratio
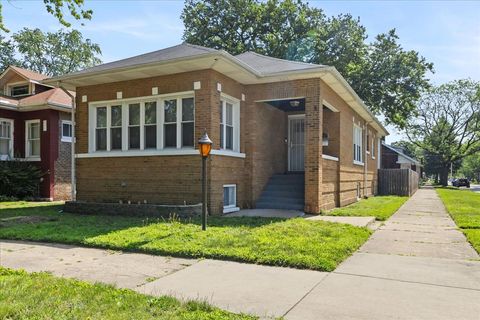
Active
$132,995
4
bds
|
1
ba
|
1,229
sqft
|
built
1950
2319 170th St, Hazel Crest, IL 60429
$456
Cash flow
17.9%
Cash-on-Cash Return
9.8%
Cap rate
1.9%
Rent to Value Ratio

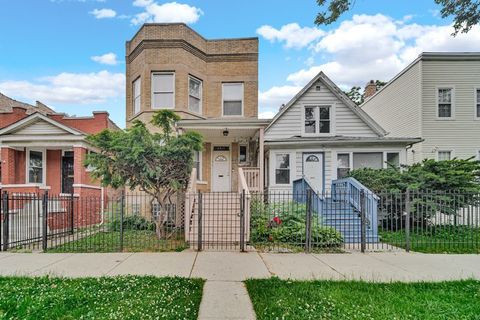
Active
$360,000
4
bds
|
2
ba
|
2,040
sqft
|
built
1908
7225 S Yates Blvd, Chicago, IL 60649
$286
Cash flow
4.1%
Cash-on-Cash Return
6.6%
Cap rate
0.9%
Rent to Value Ratio
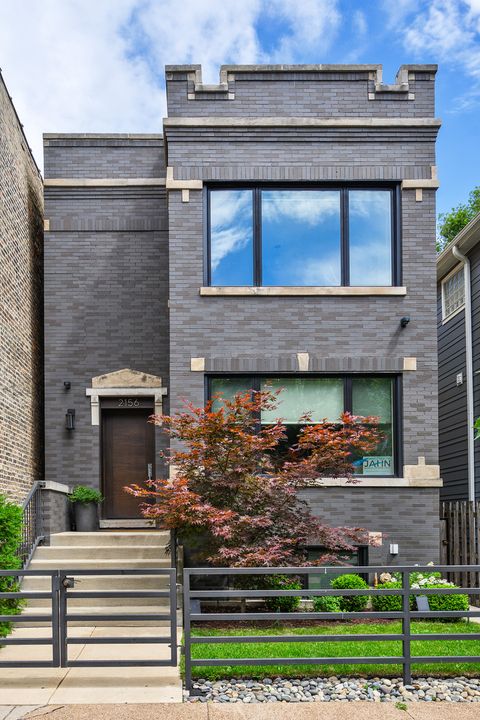
Active
$1,599,000
4
bds
|
4
ba
|
0
sqft
|
built
1928
2156 W Barry Ave, Chicago, IL 60618
$-5,333
Cash flow
-17.4%
Cash-on-Cash Return
1.7%
Cap rate
0.4%
Rent to Value Ratio

Active
$2,795,000
5
bds
|
6
ba
|
9,445
sqft
|
built
2019
18 Enclave Ct, South Barrington, IL 60010
$-10,664
Cash flow
-19.9%
Cash-on-Cash Return
1.1%
Cap rate
0.3%
Rent to Value Ratio
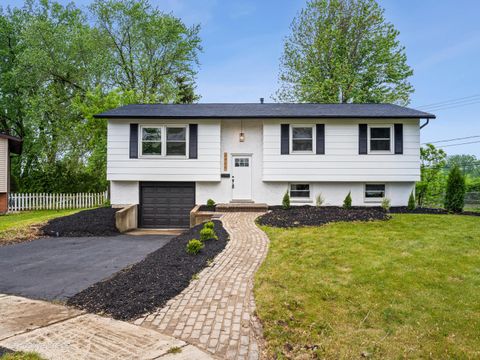
Active
$399,000
4
bds
|
2
ba
|
2,310
sqft
|
built
1964
6950 Longmeadow Ln, Hanover Park, IL 60133
$-595
Cash flow
-7.8%
Cash-on-Cash Return
3.9%
Cap rate
0.7%
Rent to Value Ratio

Active
$400,000
2
bds
|
2
ba
|
1,107
sqft
|
built
1923
3708 N Oketo Ave, Chicago, IL 60634
$-123
Cash flow
-1.6%
Cash-on-Cash Return
5.3%
Cap rate
0.8%
Rent to Value Ratio
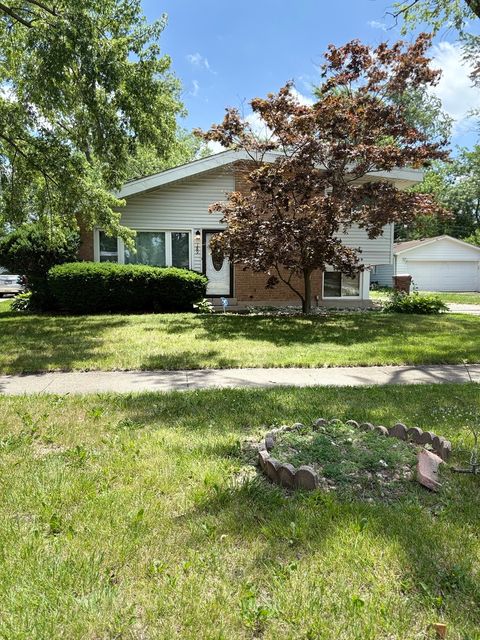
Active
$165,000
3
bds
|
2
ba
|
1,088
sqft
|
built
1957
189 Westwood Dr, Park Forest, IL 60466
$32
Cash flow
1.0%
Cash-on-Cash Return
5.9%
Cap rate
1.4%
Rent to Value Ratio
Active
$799,900
8
bds
|
3
ba
|
0
sqft
|
built
1922
4100 W George St, Chicago, IL 60641
$-3,208
Cash flow
-20.9%
Cash-on-Cash Return
1.5%
Cap rate
0.3%
Rent to Value Ratio
Active
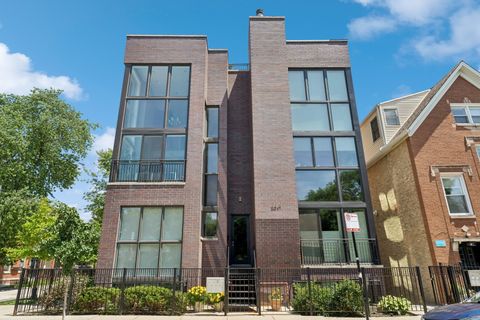
$949,500
3
bds
|
3
ba
|
2,200
sqft
|
built
2007
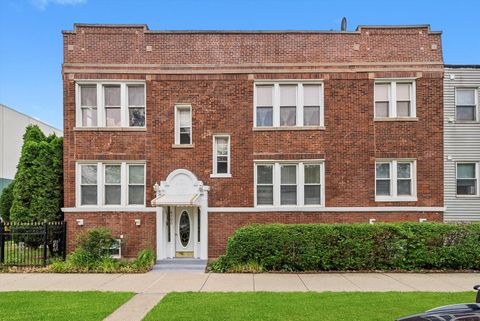
2047 N Leavitt St, Chicago, IL 60647
$-3,012
Cash flow
-16.6%
Cash-on-Cash Return
2.5%
Cap rate
0.5%
Rent to Value Ratio
Active
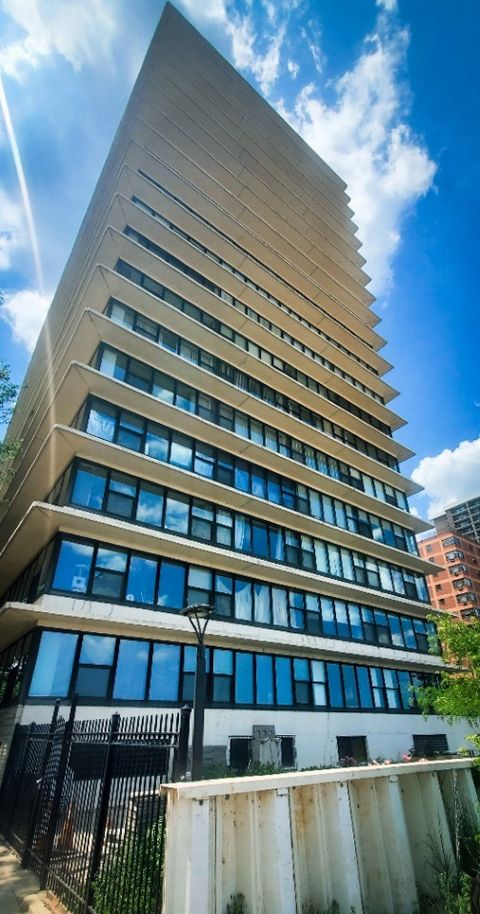
$395,000
3
bds
|
2
ba
|
1,700
sqft
|
built
1958
5801 N Sheridan Rd, Chicago, IL 60660
$-1,904
Cash flow
-25.1%
Cash-on-Cash Return
0.5%
Cap rate
0.6%
Rent to Value Ratio