Illinois Investment Properties for Sale
Browse homes for sale and investment properties in Illinois. Refine your search by price, property type, or more.
Best cash flowing properties in Illinois
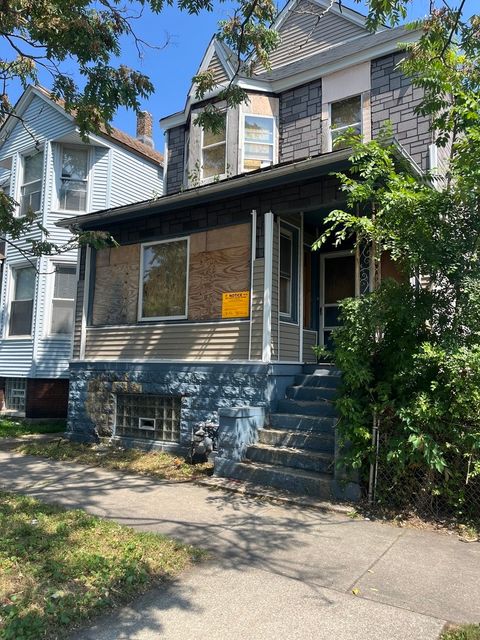
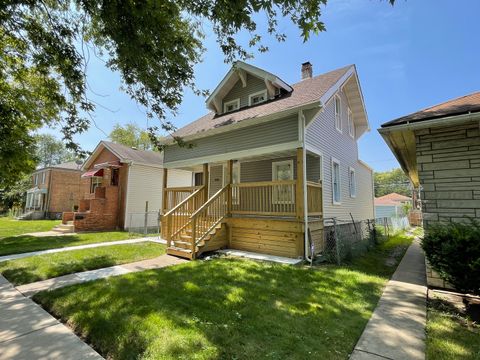
Active
$54,900
4
bds
|
2
ba
|
0
sqft
|
built
1885
8923 S Exchange Ave, Chicago, IL 60617
$1,110
Cash flow
23.6%
Cash-on-Cash Return
24.3%
Cap rate
3.3%
Rent to Value Ratio
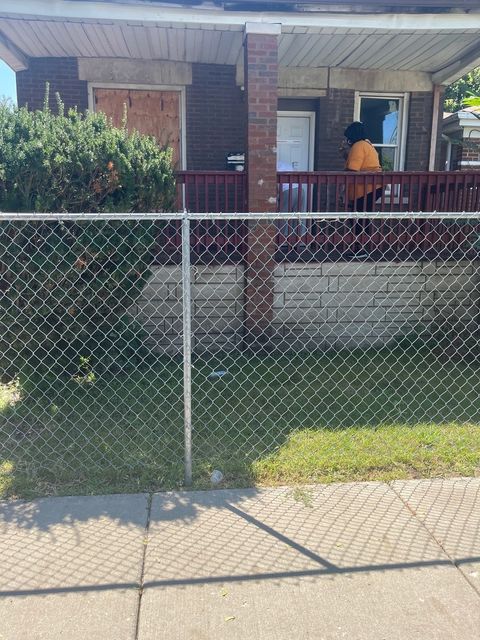
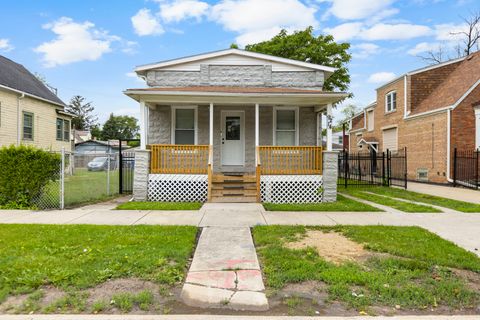
Active
$79,900
2
bds
|
1
ba
|
880
sqft
|
built
1900
827 E 87th St, Chicago, IL 60619
$628
Cash flow
41.0%
Cash-on-Cash Return
15.1%
Cap rate
2.0%
Rent to Value Ratio
9,587 out of 13,601 properties for sale in Illinois
Limited Results Shown
Create a free account, or log in to reveal all property listings and enjoy the complete experience.
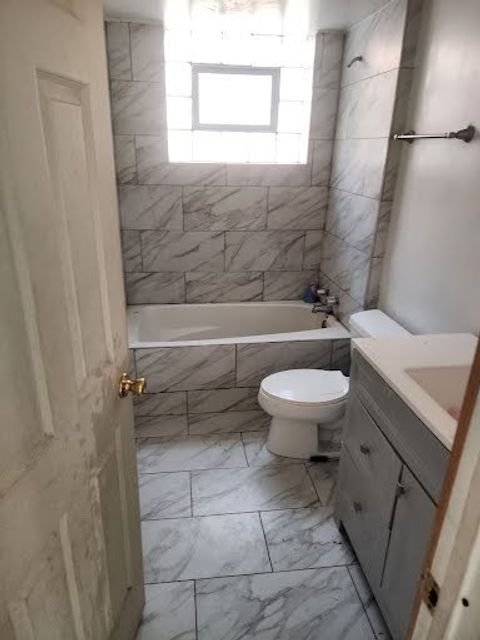
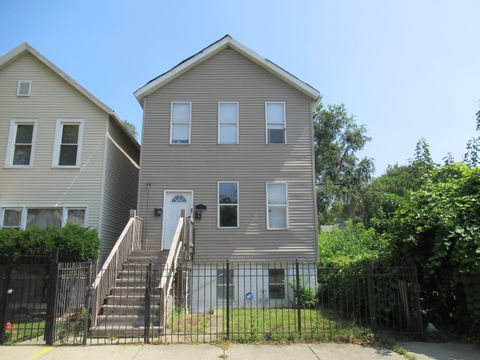
Active
$175,000
5
bds
|
3
ba
|
0
sqft
|
built
1966
14359 Park Ave, Harvey, IL 60426
$-349
Cash flow
-10.4%
Cash-on-Cash Return
3.3%
Cap rate
1.0%
Rent to Value Ratio
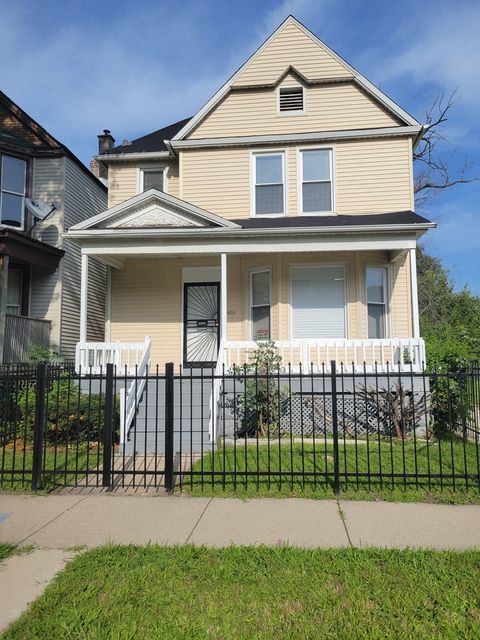
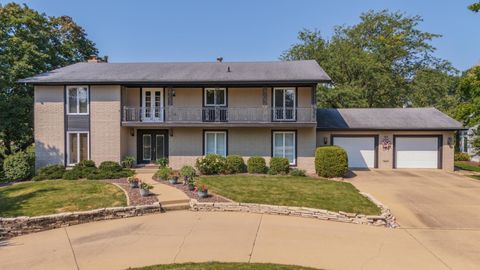
Active
$249,000
4
bds
|
3
ba
|
2,114
sqft
|
built
1919
12033 S Wallace St, Chicago, IL 60628
$459
Cash flow
9.6%
Cash-on-Cash Return
7.9%
Cap rate
1.0%
Rent to Value Ratio

Active
$1,650,000
7
bds
|
10
ba
|
10,123
sqft
|
built
1923
3505 Haweswood Dr, Crete, IL 60417
$-6,035
Cash flow
-19.1%
Cash-on-Cash Return
1.3%
Cap rate
0.4%
Rent to Value Ratio

Active
$106,000
3
bds
|
2
ba
|
2,220
sqft
|
built
1950
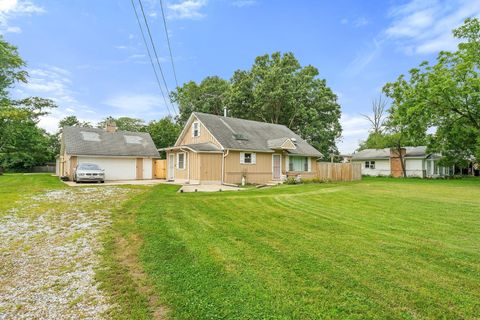
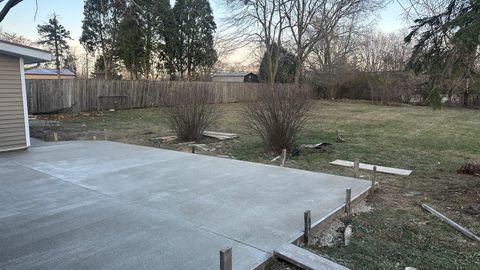
26616 S Egyptian Trl, Monee, IL 60449
$459
Cash flow
22.6%
Cash-on-Cash Return
10.9%
Cap rate
1.9%
Rent to Value Ratio
Active
$205,000
3
bds
|
2
ba
|
1,200
sqft
|
built
1931
9246 S Perry Ave, Chicago, IL 60620
$223
Cash flow
5.7%
Cash-on-Cash Return
7.0%
Cap rate
0.9%
Rent to Value Ratio

Active
$310,000
3
bds
|
2
ba
|
1,938
sqft
|
built
1954
990 Hirsch Blvd, Calumet City, IL 60409
$-49
Cash flow
-0.8%
Cash-on-Cash Return
5.5%
Cap rate
0.9%
Rent to Value Ratio
Active
$195,000
3
bds
|
1
ba
|
1,100
sqft
|
built
1922
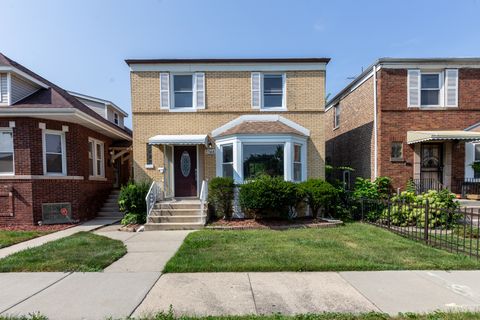
9214 S Woodlawn Ave, Chicago, IL 60619
$176
Cash flow
4.7%
Cash-on-Cash Return
6.8%
Cap rate
0.9%
Rent to Value Ratio
Active
$259,900
4
bds
|
2
ba
|
0
sqft
|
built
1890
7533 S Dorchester Ave, Chicago, IL 60619
$-91
Cash flow
-1.8%
Cash-on-Cash Return
5.3%
Cap rate
0.7%
Rent to Value Ratio
Active
$774,999
4
bds
|
6
ba
|
5,625
sqft
|
built
1972
40 Country Club Pl, Bloomington, IL 61701
$-1,992
Cash flow
-13.4%
Cash-on-Cash Return
2.6%
Cap rate
0.6%
Rent to Value Ratio
Active
$65,000
2
bds
|
1
ba
|
933
sqft
|
built
1964
7337 S South Shore Dr, Chicago, IL 60649
$324
Cash flow
5.8%
Cash-on-Cash Return
6.0%
Cap rate
2.3%
Rent to Value Ratio
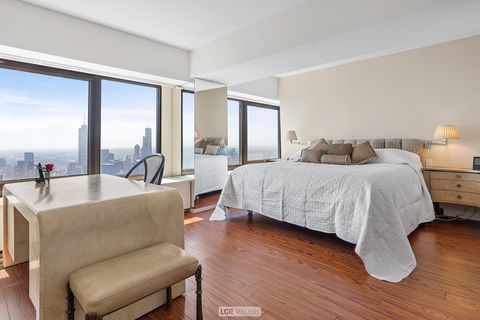
Active
$899,000
3
bds
|
3
ba
|
2,800
sqft
|
built
1970
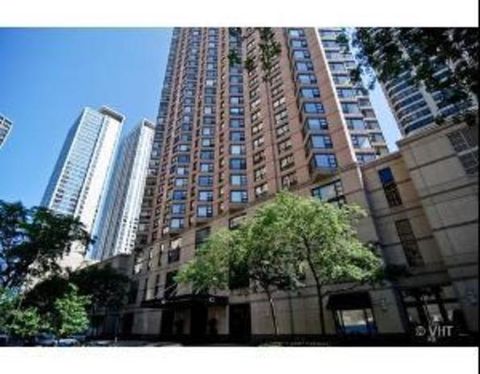
175 E Delaware Pl, Chicago, IL 60611
$-3,832
Cash flow
-22.2%
Cash-on-Cash Return
0.6%
Cap rate
0.8%
Rent to Value Ratio
Active
$585,000
3
bds
|
3
ba
|
2,200
sqft
|
built
1974
1440 N State Pkwy, Chicago, IL 60610
$-2,894
Cash flow
-25.8%
Cash-on-Cash Return
-0.3%
Cap rate
0.8%
Rent to Value Ratio
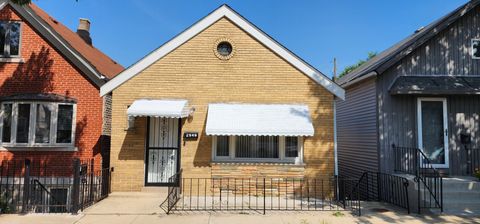
Active
$418,000
3
bds
|
2
ba
|
1,400
sqft
|
built
1885
2948 S Lyman St, Chicago, IL 60608
$-598
Cash flow
-7.5%
Cash-on-Cash Return
4.0%
Cap rate
0.6%
Rent to Value Ratio
Active
$369,900
1
bds
|
1
ba
|
965
sqft
|
built
2001
512 N Mc Clurg Ct, Chicago, IL 60611
$-1,161
Cash flow
-16.4%
Cash-on-Cash Return
1.9%
Cap rate
0.8%
Rent to Value Ratio
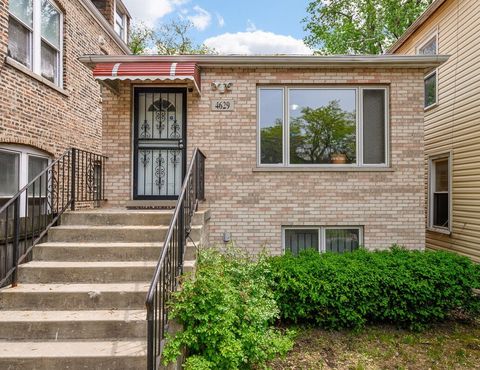
Active
$388,000
3
bds
|
2
ba
|
2,400
sqft
|
built
2004
4629 S Laflin St, Chicago, IL 60609
$-101
Cash flow
-1.4%
Cash-on-Cash Return
5.4%
Cap rate
0.8%
Rent to Value Ratio

Active
$1,850,000
3
bds
|
5
ba
|
5,303
sqft
|
built
1989
27490 W Wilmot Rd, Antioch, IL 60002
$-5,466
Cash flow
-15.4%
Cash-on-Cash Return
2.1%
Cap rate
0.4%
Rent to Value Ratio
Active
$140,000
3
bds
|
2
ba
|
924
sqft
|
built
1890
1818 S Harding Ave, Chicago, IL 60623
$246
Cash flow
9.2%
Cash-on-Cash Return
7.8%
Cap rate
1.1%
Rent to Value Ratio

Active
$188,500
5
bds
|
3
ba
|
2,282
sqft
|
built
1927
110 Forestdale Park, Calumet City, IL 60409
$-280
Cash flow
-7.7%
Cash-on-Cash Return
3.9%
Cap rate
1.2%
Rent to Value Ratio

Active
$115,000
6
bds
|
2
ba
|
0
sqft
|
built
1913
502 Garfield Ave, Calumet City, IL 60409
$-278
Cash flow
-12.6%
Cash-on-Cash Return
2.8%
Cap rate
1.7%
Rent to Value Ratio
Active
$249,000
3
bds
|
2
ba
|
1,937
sqft
|
built
1981
1901 Branch Rd, Champaign, IL 61821
$-205
Cash flow
-4.3%
Cash-on-Cash Return
4.7%
Cap rate
0.8%
Rent to Value Ratio

Active
$999,000
10
bds
|
3
ba
|
0
sqft
|
built
1902
1657 N Artesian Ave, Chicago, IL 60647
$-4,031
Cash flow
-21.1%
Cash-on-Cash Return
0.8%
Cap rate
0.3%
Rent to Value Ratio

Active
$1,187,000
4
bds
|
4
ba
|
3,513
sqft
|
built
2007
5670 Brentwood Dr, Hoffman Estates, IL 60192
$-2,290
Cash flow
-10.1%
Cash-on-Cash Return
3.4%
Cap rate
0.5%
Rent to Value Ratio
Active
$500,000
3
bds
|
4
ba
|
2,117
sqft
|
built
1982
1896 E Amberstone Rd, Manteno, IL 60950
$-1,023
Cash flow
-10.7%
Cash-on-Cash Return
3.2%
Cap rate
0.6%
Rent to Value Ratio

Active
$94,000
3
bds
|
1
ba
|
961
sqft
|
built
1952
14313 S Eggleston Ave, Riverdale, IL 60827
$432
Cash flow
24.0%
Cash-on-Cash Return
11.2%
Cap rate
1.7%
Rent to Value Ratio

Active
$230,000
5
bds
|
3
ba
|
0
sqft
|
built
1970
314 2nd St, Henry, IL 61537
$-442
Cash flow
-10.0%
Cash-on-Cash Return
3.4%
Cap rate
0.6%
Rent to Value Ratio
Active
$119,999
3
bds
|
2
ba
|
1,016
sqft
|
built
1975
820 Sandra Dr, University Park, IL 60484
$399
Cash flow
17.3%
Cash-on-Cash Return
9.7%
Cap rate
1.7%
Rent to Value Ratio

Active
$593,000
5
bds
|
4
ba
|
4,832
sqft
|
built
2000
408 Beringer Cir, Urbana, IL 61802
$-1,108
Cash flow
-9.7%
Cash-on-Cash Return
3.4%
Cap rate
0.7%
Rent to Value Ratio

Active
$169,900
3
bds
|
1
ba
|
2,200
sqft
|
built
1922
2916 Jackson Ave, South Chicago Heights, IL 60411
$107
Cash flow
3.3%
Cash-on-Cash Return
6.4%
Cap rate
1.1%
Rent to Value Ratio
Active
$449,900
6
bds
|
3
ba
|
0
sqft
|
built
1977
455 Park Dr, Marengo, IL 60152
$-1,300
Cash flow
-15.1%
Cash-on-Cash Return
2.2%
Cap rate
0.4%
Rent to Value Ratio

Active
$295,000
3
bds
|
2
ba
|
0
sqft
|
built
1900
121 N Smith St, Aurora, IL 60505
$-14
Cash flow
-0.2%
Cash-on-Cash Return
5.6%
Cap rate
0.8%
Rent to Value Ratio
Active
$354,900
4
bds
|
3
ba
|
2,100
sqft
|
built
1943
10730 S Ridgeland Ave, Worth, IL 60482
$41
Cash flow
0.6%
Cash-on-Cash Return
5.8%
Cap rate
0.9%
Rent to Value Ratio
Active
$224,900
3
bds
|
2
ba
|
1,800
sqft
|
built
1949
1748 E 85th St, Chicago, IL 60617
$468
Cash flow
10.9%
Cash-on-Cash Return
8.2%
Cap rate
1.1%
Rent to Value Ratio
Active
$259,900
3
bds
|
1
ba
|
1,368
sqft
|
built
1963
23928 S Kings Rd, Crete, IL 60417
$130
Cash flow
2.6%
Cash-on-Cash Return
6.3%
Cap rate
1.0%
Rent to Value Ratio
Active
$240,000
4
bds
|
2
ba
|
1,400
sqft
|
built
1956
17925 John Ave, Country Club Hills, IL 60478
$215
Cash flow
4.7%
Cash-on-Cash Return
6.8%
Cap rate
1.2%
Rent to Value Ratio

Active
$325,000
3
bds
|
2
ba
|
1,435
sqft
|
built
1924
12521 S 90th Ave, Palos Park, IL 60464
$341
Cash flow
5.5%
Cash-on-Cash Return
6.9%
Cap rate
0.9%
Rent to Value Ratio
Active
$265,000
1
bds
|
1
ba
|
800
sqft
|
built
1990
401 E Ontario St, Chicago, IL 60611
$-859
Cash flow
-16.9%
Cash-on-Cash Return
1.8%
Cap rate
0.8%
Rent to Value Ratio
Active
$160,000
4
bds
|
1
ba
|
1,856
sqft
|
built
1922
8254 S Morgan St, Chicago, IL 60620
$489
Cash flow
15.9%
Cash-on-Cash Return
9.3%
Cap rate
1.3%
Rent to Value Ratio

Active
$1,299,000
6
bds
|
5
ba
|
0
sqft
|
built
2007
938 N Washtenaw Ave, Chicago, IL 60622
$-4,724
Cash flow
-19.0%
Cash-on-Cash Return
1.3%
Cap rate
0.3%
Rent to Value Ratio