Marion County Investment Properties for Sale
Browse homes for sale and investment properties in Marion County. Refine your search by price, property type, or more.
Best cash flowing properties in Marion County
Active
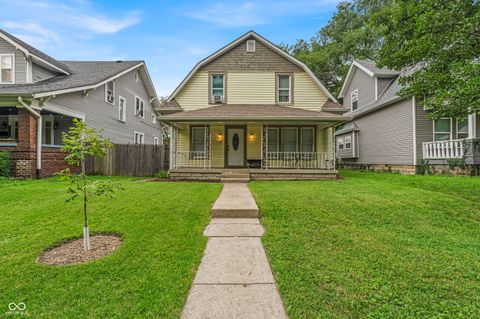
$60,000
2
bds
|
1
ba
|
864
sqft
|
built
1940
3919 Spann Ave, Indianapolis, IN 46203
$966
Cash flow
18.8%
Cash-on-Cash Return
19.3%
Cap rate
2.3%
Rent to Value Ratio
Active
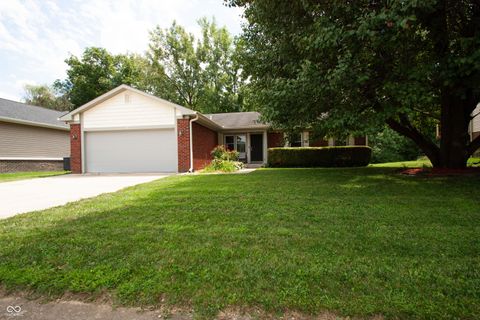
$115,000
2
bds
|
2
ba
|
1,233
sqft
|
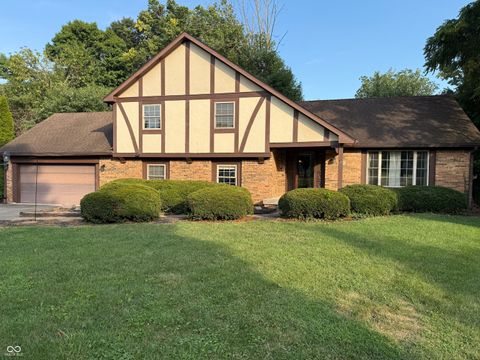
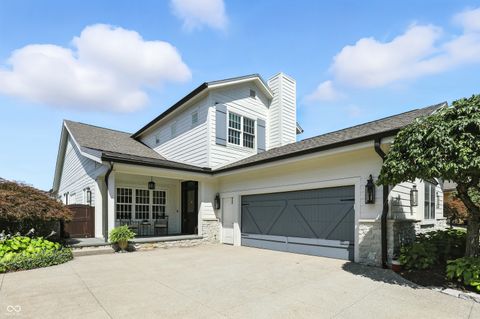
built
1986
6935 Deerbrook Ct, Indianapolis, IN 46214
$584
Cash flow
26.5%
Cash-on-Cash Return
12.2%
Cap rate
1.5%
Rent to Value Ratio
1,658 out of 1,805 properties for sale in Marion County
Limited Results Shown
Create a free account, or log in to reveal all property listings and enjoy the complete experience.
Active
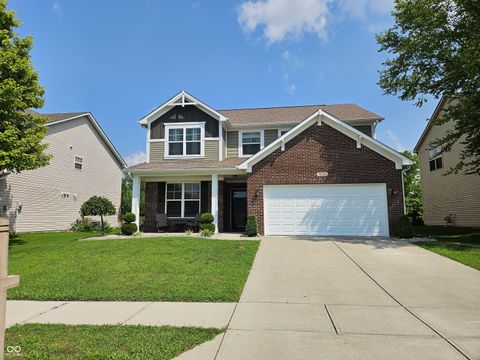
$1,479,900
4
bds
|
4
ba
|
4,228
sqft
|
built
1984
8613 Seaward Ln, Indianapolis, IN 46256
$-4,451
Cash flow
-15.7%
Cash-on-Cash Return
2.5%
Cap rate
0.3%
Rent to Value Ratio
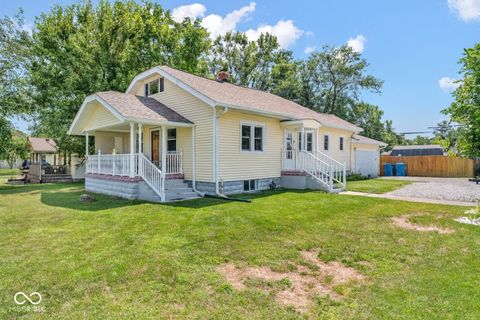
Active
$169,900
3
bds
|
1
ba
|
980
sqft
|
built
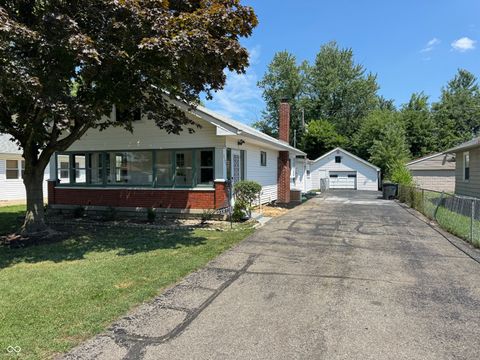
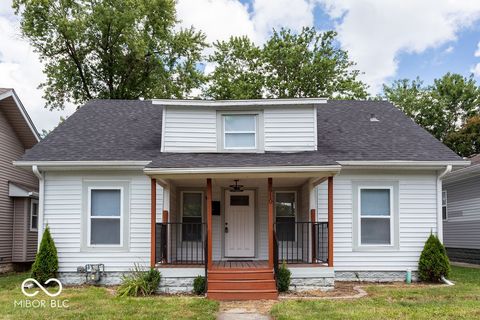
1955
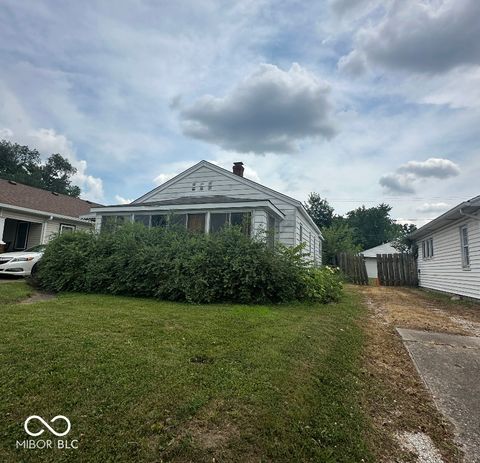
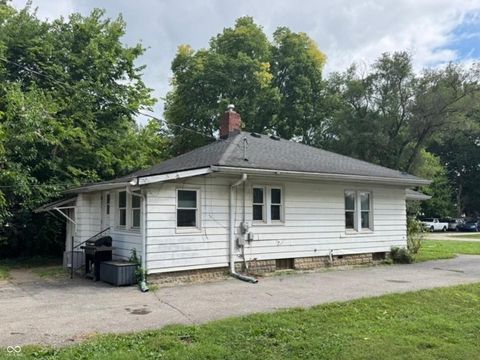
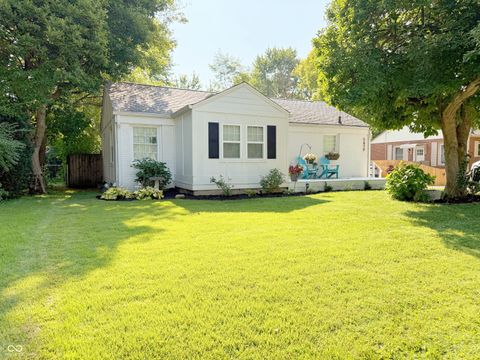
3221 Lowry Rd, Indianapolis, IN 46222
$27
Cash flow
0.8%
Cash-on-Cash Return
6.3%
Cap rate
0.8%
Rent to Value Ratio
Active
$127,000
2
bds
|
1
ba
|
886
sqft
|
built
1930
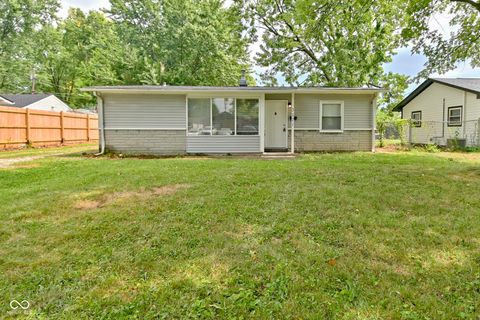
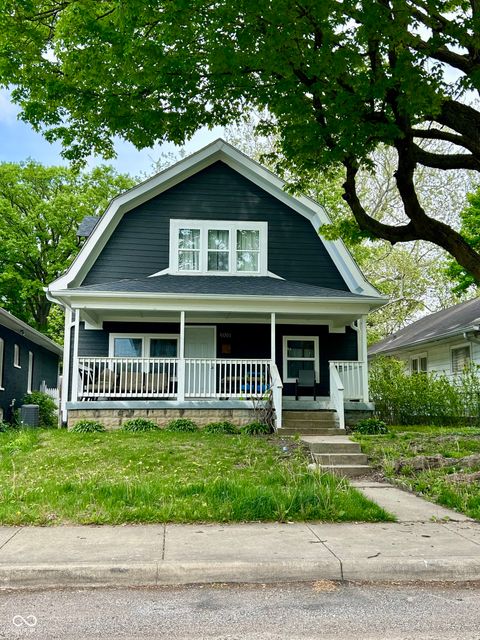
1024 N Alton Ave, Indianapolis, IN 46222
$315
Cash flow
12.9%
Cash-on-Cash Return
9.1%
Cap rate
1.1%
Rent to Value Ratio
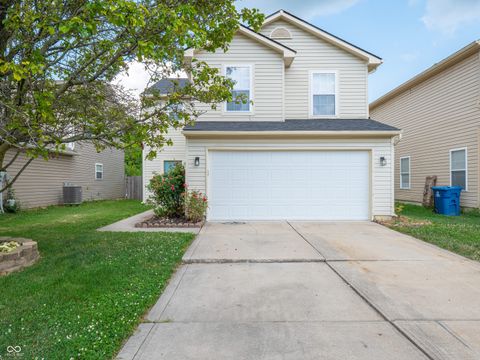
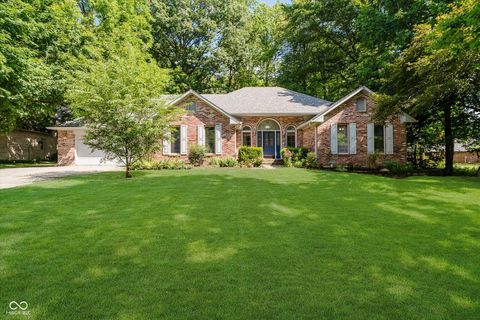
Active
$254,900
4
bds
|
3
ba
|
2,080
sqft
|
built
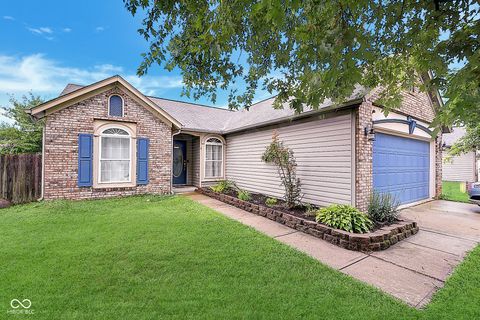
2004
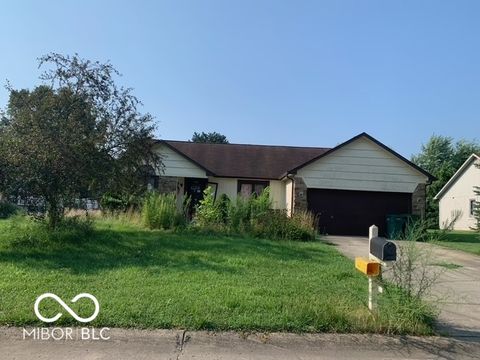
10824 Orchard Valley Way, Indianapolis, IN 46235
$49
Cash flow
1.0%
Cash-on-Cash Return
6.4%
Cap rate
0.8%
Rent to Value Ratio
Active
$305,000
3
bds
|
3
ba
|
1,668
sqft
|
built
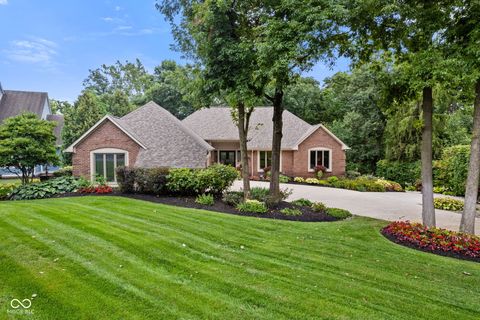
2000
3445 W 53rd St, Indianapolis, IN 46228
$-200
Cash flow
-3.4%
Cash-on-Cash Return
5.4%
Cap rate
0.7%
Rent to Value Ratio
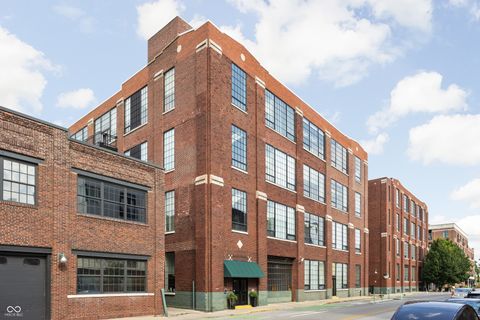
Active
$620,000
2
bds
|
2
ba
|
1,827
sqft
|
built
1922
630 N College Ave, Indianapolis, IN 46204
$-1,946
Cash flow
-16.4%
Cash-on-Cash Return
2.4%
Cap rate
0.5%
Rent to Value Ratio
Active
$439,000
3
bds
|
3
ba
|
3,026
sqft
|
built
1980
2233 N Talbott St, Indianapolis, IN 46205
$-317
Cash flow
-3.8%
Cash-on-Cash Return
5.3%
Cap rate
0.6%
Rent to Value Ratio
Active
$100,000
2
bds
|
2
ba
|
1,012
sqft
|
built
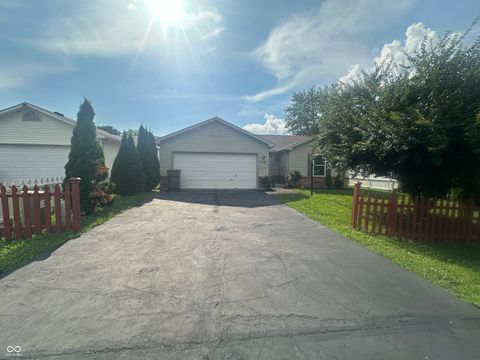
1973
10064 Penrith Dr, Indianapolis, IN 46229
$136
Cash flow
7.1%
Cash-on-Cash Return
7.8%
Cap rate
1.2%
Rent to Value Ratio
Active
$355,000
4
bds
|
4
ba
|
3,320
sqft
|
built
1965
227 Narcissus Dr, Indianapolis, IN 46227
$-231
Cash flow
-3.4%
Cash-on-Cash Return
5.4%
Cap rate
0.6%
Rent to Value Ratio
Active
$325,000
3
bds
|
2
ba
|
1,693
sqft
|
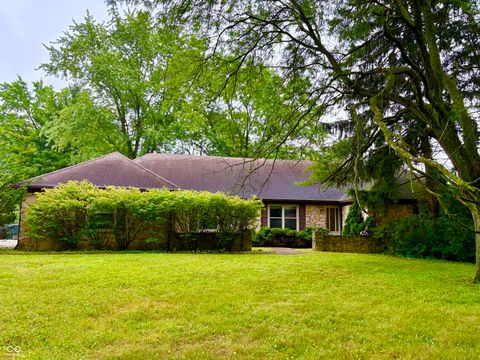
built
1964
7010 Grosvenor Pl, Indianapolis, IN 46220
$-9
Cash flow
-0.1%
Cash-on-Cash Return
6.1%
Cap rate
0.7%
Rent to Value Ratio
Active
$410,000
3
bds
|
2
ba
|
1,809
sqft
|
built
1947
5419 Haverford Ave, Indianapolis, IN 46220
$-168
Cash flow
-2.1%
Cash-on-Cash Return
5.7%
Cap rate
0.7%
Rent to Value Ratio
Active
$315,000
4
bds
|
3
ba
|
1,999
sqft
|
built
1920
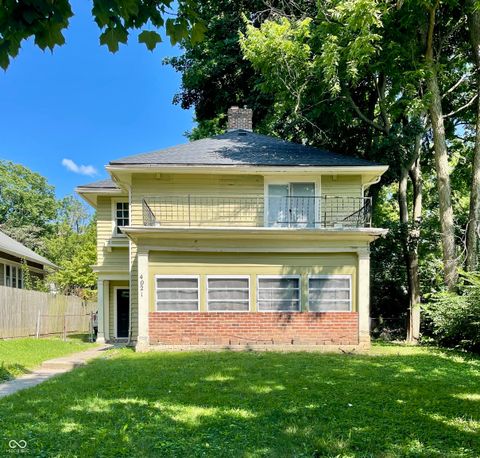
4061 Byram Ave, Indianapolis, IN 46208
$-27
Cash flow
-0.4%
Cash-on-Cash Return
6.0%
Cap rate
0.7%
Rent to Value Ratio
Active
$300,000
4
bds
|
3
ba
|
2,578
sqft
|
built
1922
4021 Guilford Ave, Indianapolis, IN 46205
$50
Cash flow
0.9%
Cash-on-Cash Return
6.3%
Cap rate
0.8%
Rent to Value Ratio
Active
$179,900
3
bds
|
1
ba
|
1,099
sqft
|
built
1949
5810 Greenfield Ave, Indianapolis, IN 46219
$44
Cash flow
1.3%
Cash-on-Cash Return
6.4%
Cap rate
0.8%
Rent to Value Ratio
Active
$269,000
3
bds
|
2
ba
|
1,728
sqft
|
built
1920
1232 N Oakland Ave, Indianapolis, IN 46201
$-136
Cash flow
-2.6%
Cash-on-Cash Return
5.5%
Cap rate
0.7%
Rent to Value Ratio
Active
$249,500
3
bds
|
2
ba
|
1,485
sqft
|
built
1980
5307 Honey Manor Dr, Indianapolis, IN 46221
$-36
Cash flow
-0.8%
Cash-on-Cash Return
6.0%
Cap rate
0.7%
Rent to Value Ratio
Active
$358,000
4
bds
|
3
ba
|
2,492
sqft
|
built
2014
6830 Shoals Way, Indianapolis, IN 46237
$-270
Cash flow
-3.9%
Cash-on-Cash Return
5.2%
Cap rate
0.6%
Rent to Value Ratio
Active
$250,000
3
bds
|
2
ba
|
1,474
sqft
|
built
1921
7301 E Troy Ave, Indianapolis, IN 46239
$-39
Cash flow
-0.8%
Cash-on-Cash Return
6.0%
Cap rate
0.7%
Rent to Value Ratio
Active
$156,900
2
bds
|
1
ba
|
1,072
sqft
|
built
1923
2127 Wallace Ave, Indianapolis, IN 46218
$93
Cash flow
3.1%
Cash-on-Cash Return
6.9%
Cap rate
0.8%
Rent to Value Ratio
Active
$300,000
4
bds
|
3
ba
|
2,316
sqft
|
built
1977
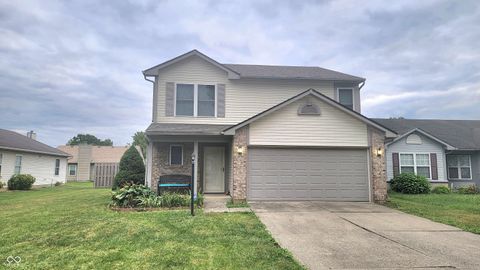
6851 Mimosa Ln, Indianapolis, IN 46259
$119
Cash flow
2.1%
Cash-on-Cash Return
6.6%
Cap rate
0.8%
Rent to Value Ratio
Active
$235,000
3
bds
|
2
ba
|
1,180
sqft
|
built
1998
3110 S Temple Ave, Indianapolis, IN 46237
$-100
Cash flow
-2.2%
Cash-on-Cash Return
5.6%
Cap rate
0.7%
Rent to Value Ratio
Active
$699,000
4
bds
|
4
ba
|
4,014
sqft
|
built
1989
9604 Hamburg Ct, Indianapolis, IN 46256
$-1,477
Cash flow
-11.0%
Cash-on-Cash Return
3.6%
Cap rate
0.4%
Rent to Value Ratio
Active
$369,500
4
bds
|
2
ba
|
2,661
sqft
|
built
1991
10408 Fallen Oak Dr, Indianapolis, IN 46239
$-189
Cash flow
-2.7%
Cash-on-Cash Return
5.5%
Cap rate
0.7%
Rent to Value Ratio
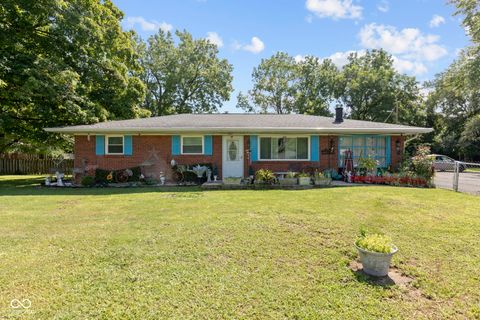
Active
$180,000
3
bds
|
1
ba
|
900
sqft
|
built
1955
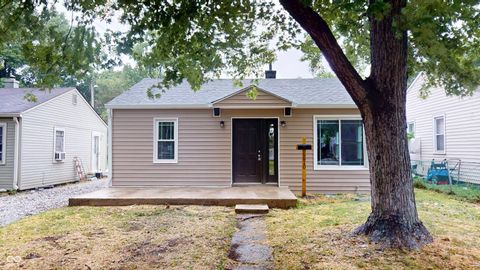
4528 Brittany Rd, Indianapolis, IN 46222
$44
Cash flow
1.3%
Cash-on-Cash Return
6.4%
Cap rate
0.8%
Rent to Value Ratio
Active
$259,000
2
bds
|
2
ba
|
1,710
sqft
|
built
1989
8690 Jaffa Court West Dr, Indianapolis, IN 46260
$-347
Cash flow
-7.0%
Cash-on-Cash Return
4.5%
Cap rate
0.9%
Rent to Value Ratio
Active
$350,000
4
bds
|
2
ba
|
1,850
sqft
|
built
1959
431 Melvenia St, Indianapolis, IN 46219
$-551
Cash flow
-8.2%
Cash-on-Cash Return
4.3%
Cap rate
0.5%
Rent to Value Ratio
Active
$247,807
4
bds
|
2
ba
|
1,767
sqft
|
built
1910
2910 Meredith Ave, Indianapolis, IN 46201
$-27
Cash flow
-0.6%
Cash-on-Cash Return
6.0%
Cap rate
0.7%
Rent to Value Ratio
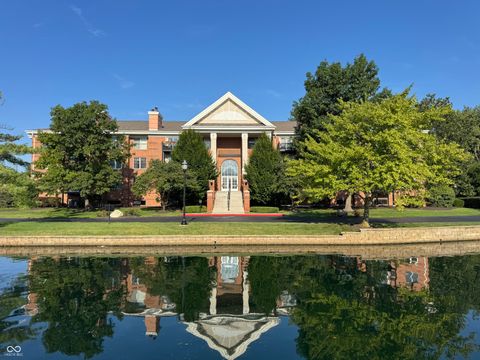
Active
$1,750,000
3
bds
|
3
ba
|
3,466
sqft
|
built
1987
8068 Dean Rd, Indianapolis, IN 46240
$-4,391
Cash flow
-13.1%
Cash-on-Cash Return
3.1%
Cap rate
0.4%
Rent to Value Ratio
Active
$239,900
3
bds
|
2
ba
|
1,132
sqft
|
built
1998
5821 Victory Ave, Indianapolis, IN 46203
$-137
Cash flow
-3.0%
Cash-on-Cash Return
5.5%
Cap rate
0.7%
Rent to Value Ratio
Active
$340,000
4
bds
|
3
ba
|
2,403
sqft
|
built
1977
8729 Sawleaf Rd, Indianapolis, IN 46260
$-23
Cash flow
-0.4%
Cash-on-Cash Return
6.1%
Cap rate
0.8%
Rent to Value Ratio
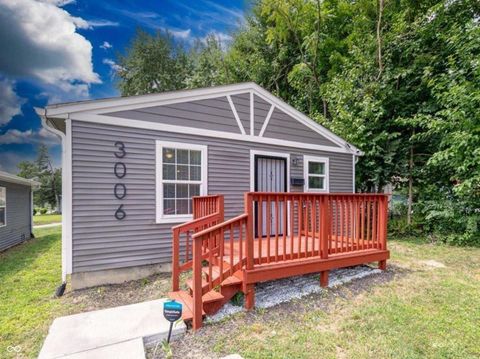
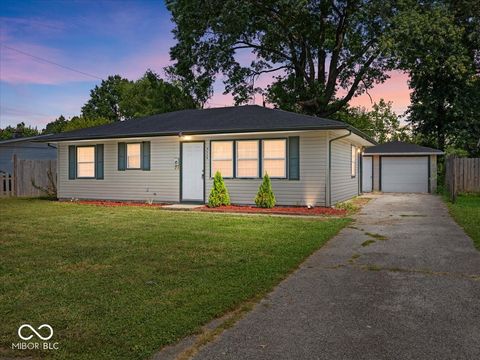
Active
$170,000
3
bds
|
2
ba
|
912
sqft
|
built
2021
3006 N Olney St, Indianapolis, IN 46218
$233
Cash flow
7.2%
Cash-on-Cash Return
7.8%
Cap rate
0.9%
Rent to Value Ratio
Active
$139,500
2
bds
|
0
ba
|
0
sqft
|
built
1915
4310 E Michigan St, Indianapolis, IN 46201
$44
Cash flow
1.6%
Cash-on-Cash Return
6.5%
Cap rate
0.8%
Rent to Value Ratio

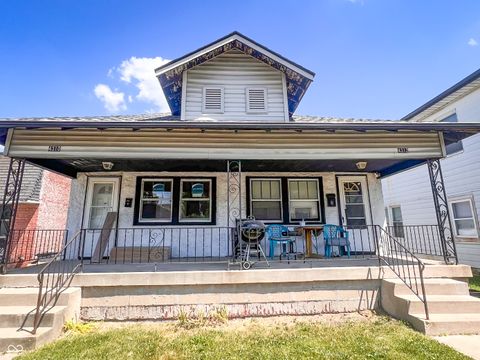
Active
$205,000
2
bds
|
1
ba
|
1,052
sqft
|
built
1900
470 N Randolph St, Indianapolis, IN 46201
$54
Cash flow
1.4%
Cash-on-Cash Return
6.5%
Cap rate
0.8%
Rent to Value Ratio

Active
$269,900
2
bds
|
1
ba
|
1,231
sqft
|
built
2004
1117 Reserve Way, Indianapolis, IN 46220
$-293
Cash flow
-5.7%
Cash-on-Cash Return
4.8%
Cap rate
0.7%
Rent to Value Ratio
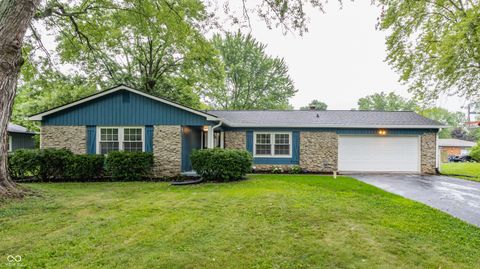
Active
$294,500
3
bds
|
2
ba
|
1,448
sqft
|
built
1969
3428 Ellyn Dr, Indianapolis, IN 46228
$-129
Cash flow
-2.3%
Cash-on-Cash Return
5.6%
Cap rate
0.7%
Rent to Value Ratio
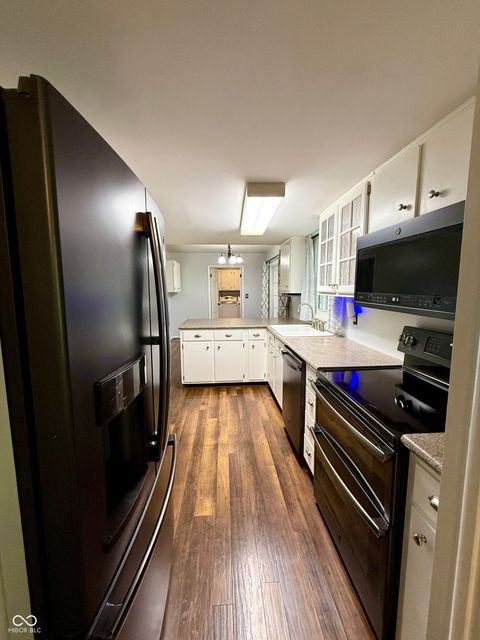
Active
$335,000
4
bds
|
3
ba
|
2,072
sqft
|
built
1969
9321 E 82nd St, Indianapolis, IN 46256
$-198
Cash flow
-3.1%
Cash-on-Cash Return
5.4%
Cap rate
0.7%
Rent to Value Ratio
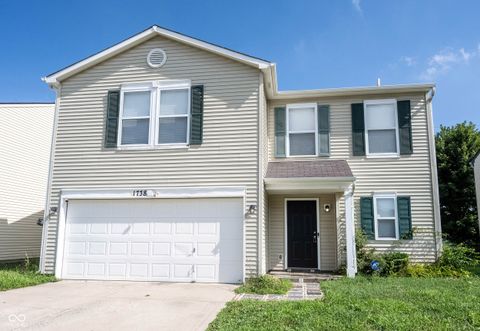
Active
$270,000
4
bds
|
3
ba
|
2,154
sqft
|
built
2002
1738 Sonesta Way, Indianapolis, IN 46217
$-162
Cash flow
-3.1%
Cash-on-Cash Return
5.4%
Cap rate
0.7%
Rent to Value Ratio
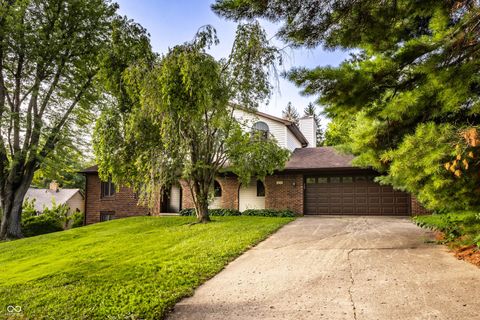
Active
$425,000
4
bds
|
3
ba
|
2,602
sqft
|
built
1975
1637 Towe String Rd, Indianapolis, IN 46217
$-797
Cash flow
-9.8%
Cash-on-Cash Return
3.9%
Cap rate
0.5%
Rent to Value Ratio