Marion County Investment Properties for Sale
Browse homes for sale and investment properties in Marion County. Refine your search by price, property type, or more.
Best cash flowing properties in Marion County
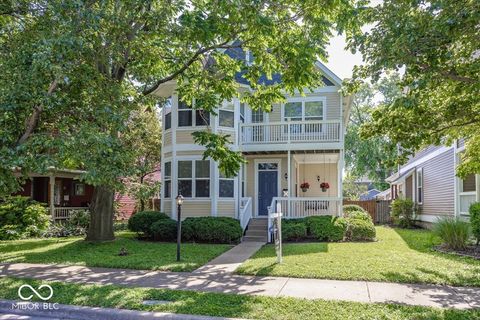
Active
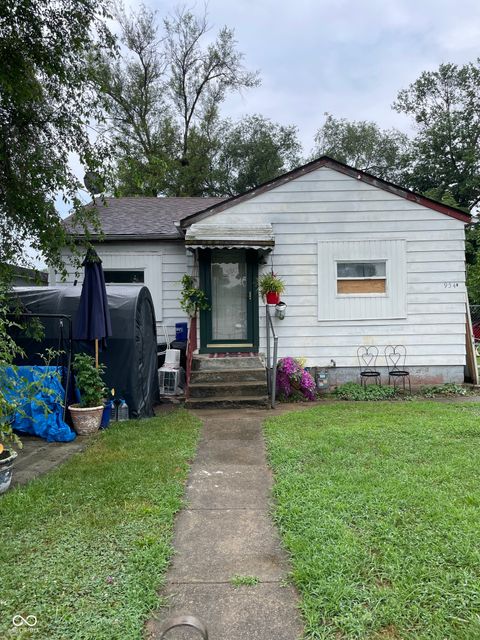
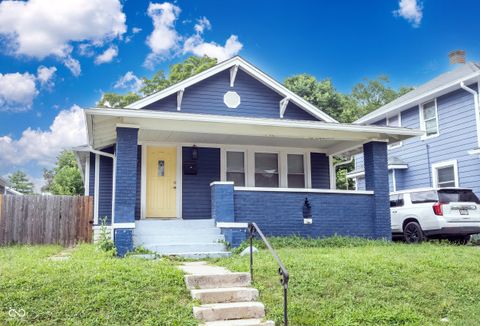
$89,900
3
bds
|
2
ba
|
1,818
sqft
|
built
1948
954 N Moreland Ave, Indianapolis, IN 46222
$574
Cash flow
33.3%
Cash-on-Cash Return
13.8%
Cap rate
1.7%
Rent to Value Ratio
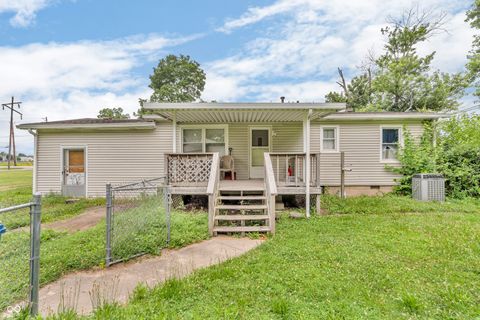
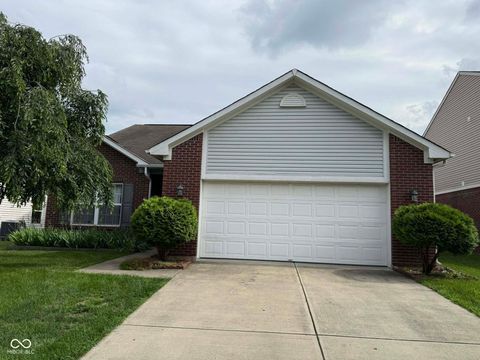
Active
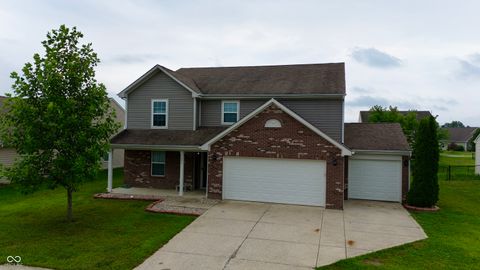
$150,000
3
bds
|
1
ba
|
1,248
sqft
|
built
1964
6349 S Harding St, Indianapolis, IN 46217
$267
Cash flow
9.3%
Cash-on-Cash Return
8.3%
Cap rate
1.0%
Rent to Value Ratio
1,601 out of 1,746 properties for sale in Marion County
Limited Results Shown
Create a free account, or log in to reveal all property listings and enjoy the complete experience.
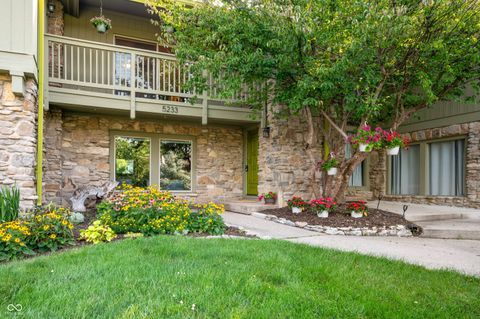
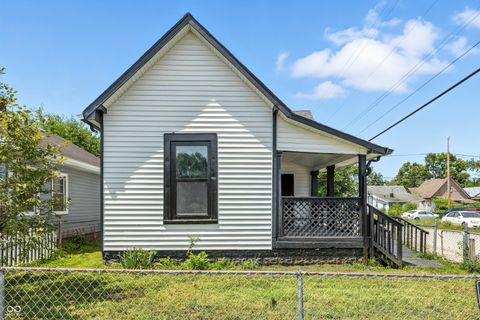
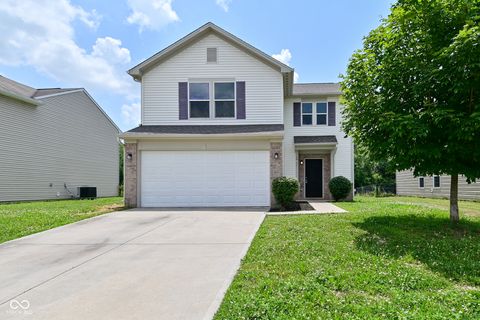
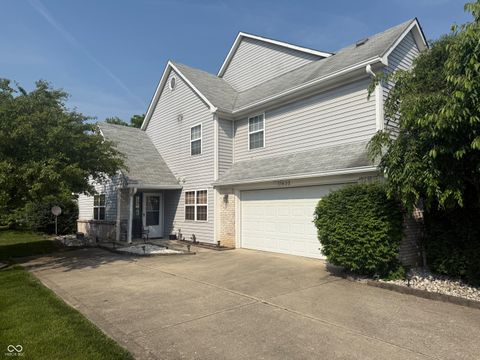
Active
$319,900
2
bds
|
3
ba
|
1,687
sqft
|
built
1966
5233 Nob Ln, Indianapolis, IN 46226
$-763
Cash flow
-12.4%
Cash-on-Cash Return
3.3%
Cap rate
0.6%
Rent to Value Ratio
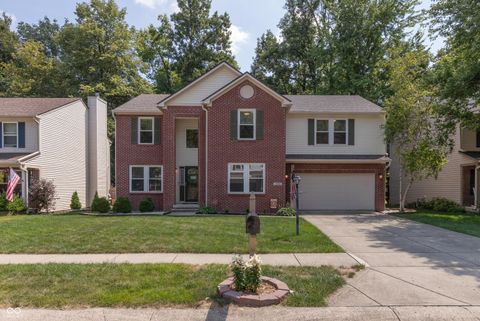
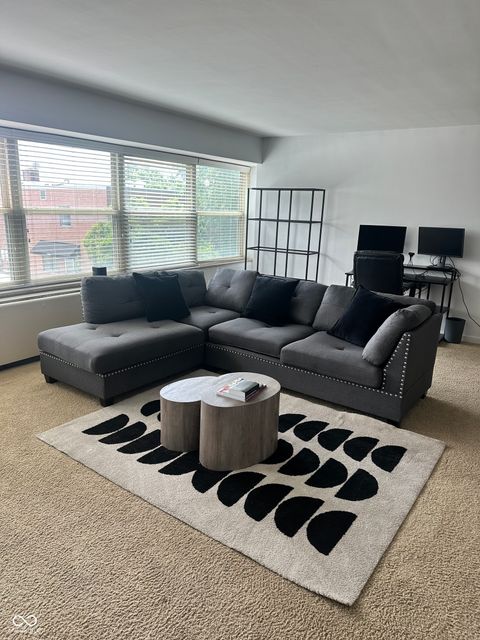
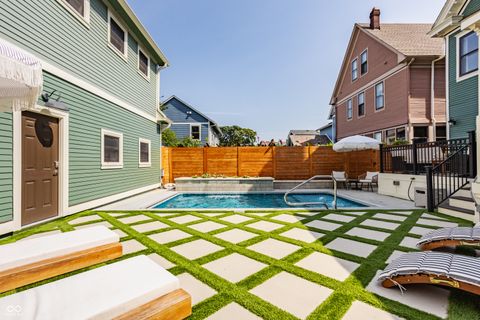
Active
$428,000
5
bds
|
4
ba
|
3,238
sqft
|
built
2001
7253 Ponderosa Pines Pl, Indianapolis, IN 46239
$-430
Cash flow
-5.2%
Cash-on-Cash Return
4.9%
Cap rate
0.6%
Rent to Value Ratio
Active
$225,000
2
bds
|
1
ba
|
1,201
sqft
|
built
1922
826 N Gray St, Indianapolis, IN 46201
$89
Cash flow
2.1%
Cash-on-Cash Return
6.6%
Cap rate
0.8%
Rent to Value Ratio
Active
$364,900
5
bds
|
3
ba
|
3,317
sqft
|
built
2016
7851 Housefinch Ln, Indianapolis, IN 46239
$9
Cash flow
0.1%
Cash-on-Cash Return
6.2%
Cap rate
0.8%
Rent to Value Ratio
Active
$150,000
3
bds
|
1
ba
|
924
sqft
|
built
1900
302 S Warman Ave, Indianapolis, IN 46222
$198
Cash flow
6.9%
Cash-on-Cash Return
7.7%
Cap rate
0.9%
Rent to Value Ratio

Active
$799,900
4
bds
|
5
ba
|
5,968
sqft
|
built
1986
5550 Bay Colony Ln, Indianapolis, IN 46234
$-1,121
Cash flow
-7.3%
Cash-on-Cash Return
4.5%
Cap rate
0.6%
Rent to Value Ratio
Active
$120,000
1
bds
|
1
ba
|
941
sqft
|
built
1965
3965 N Meridian St, Indianapolis, IN 46208
$-28
Cash flow
-1.2%
Cash-on-Cash Return
5.9%
Cap rate
1.3%
Rent to Value Ratio
Active
$259,900
4
bds
|
2
ba
|
1,956
sqft
|
built
1982
7834 Burr Oak Ct, Indianapolis, IN 46217
$-227
Cash flow
-4.6%
Cash-on-Cash Return
5.1%
Cap rate
0.6%
Rent to Value Ratio
Active
$225,000
3
bds
|
2
ba
|
1,216
sqft
|
built
2000
1855 Windy Hill Ln, Indianapolis, IN 46239
$74
Cash flow
1.7%
Cash-on-Cash Return
6.5%
Cap rate
0.8%
Rent to Value Ratio
Active
$369,500
3
bds
|
3
ba
|
3,273
sqft
|
built
1928
770 N Arlington Ave, Indianapolis, IN 46219
$-168
Cash flow
-2.4%
Cash-on-Cash Return
5.6%
Cap rate
0.7%
Rent to Value Ratio
Active
$615,000
4
bds
|
4
ba
|
4,528
sqft
|
built
2005
7927 Broadmead Way, Indianapolis, IN 46259
$-492
Cash flow
-4.2%
Cash-on-Cash Return
5.2%
Cap rate
0.6%
Rent to Value Ratio

Active
$334,900
3
bds
|
2
ba
|
1,688
sqft
|
built
1994
6059 Buck Blvd, Indianapolis, IN 46237
$-336
Cash flow
-5.2%
Cash-on-Cash Return
4.9%
Cap rate
0.6%
Rent to Value Ratio
Active
$205,000
3
bds
|
2
ba
|
1,644
sqft
|
built
1958
7422 E 33rd St, Indianapolis, IN 46226
$54
Cash flow
1.4%
Cash-on-Cash Return
6.5%
Cap rate
0.8%
Rent to Value Ratio
Active
$259,900
3
bds
|
2
ba
|
1,564
sqft
|
built
1916
3760 Brill Rd, Indianapolis, IN 46227
$-158
Cash flow
-3.2%
Cash-on-Cash Return
5.4%
Cap rate
0.7%
Rent to Value Ratio
Active
$625,000
6
bds
|
4
ba
|
3,066
sqft
|
built
1900
315 N Arsenal Ave, Indianapolis, IN 46201
$-994
Cash flow
-8.3%
Cash-on-Cash Return
4.2%
Cap rate
0.5%
Rent to Value Ratio
Active
$180,000
3
bds
|
2
ba
|
1,417
sqft
|
built
1920
713 W 32nd St, Indianapolis, IN 46208
$-232
Cash flow
-6.7%
Cash-on-Cash Return
4.6%
Cap rate
0.6%
Rent to Value Ratio
Active
$250,000
3
bds
|
2
ba
|
1,252
sqft
|
built
1999
6640 Chipping Ct, Indianapolis, IN 46268
$-85
Cash flow
-1.8%
Cash-on-Cash Return
5.7%
Cap rate
0.7%
Rent to Value Ratio

Active
$250,000
3
bds
|
2
ba
|
1,206
sqft
|
built
1990
7313 Shanna Cir, Indianapolis, IN 46236
$-39
Cash flow
-0.8%
Cash-on-Cash Return
6.0%
Cap rate
0.7%
Rent to Value Ratio
Active
$1,795,000
4
bds
|
6
ba
|
5,669
sqft
|
built
1984
8661 Williamshire West Dr, Indianapolis, IN 46260
$-7,253
Cash flow
-21.1%
Cash-on-Cash Return
1.3%
Cap rate
0.2%
Rent to Value Ratio
Active
$980,000
5
bds
|
6
ba
|
7,522
sqft
|
built
2006
7635 Monte Carlo Way, Indianapolis, IN 46278
$-2,329
Cash flow
-12.4%
Cash-on-Cash Return
3.3%
Cap rate
0.4%
Rent to Value Ratio
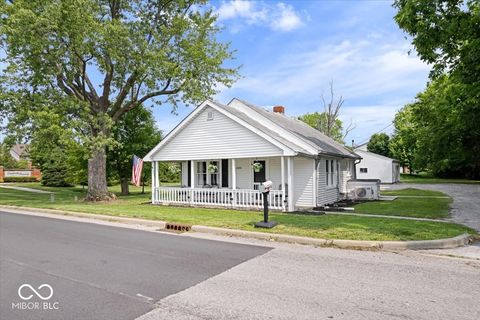
Active
$232,500
2
bds
|
2
ba
|
953
sqft
|
built
1895
413 E Caven St, Indianapolis, IN 46225
$189
Cash flow
4.2%
Cash-on-Cash Return
7.1%
Cap rate
0.9%
Rent to Value Ratio
Active
$450,000
3
bds
|
3
ba
|
2,930
sqft
|
built
2004
2325 N Talbott St, Indianapolis, IN 46205
$91
Cash flow
1.1%
Cash-on-Cash Return
6.4%
Cap rate
0.8%
Rent to Value Ratio
Active
$275,000
3
bds
|
2
ba
|
1,480
sqft
|
built
2011
621 Appleseed Dr, Indianapolis, IN 46217
$-198
Cash flow
-3.8%
Cash-on-Cash Return
5.3%
Cap rate
0.7%
Rent to Value Ratio
Active
$234,900
4
bds
|
3
ba
|
1,633
sqft
|
built
2013
10431 Bellchime Ct, Indianapolis, IN 46235
$153
Cash flow
3.4%
Cash-on-Cash Return
6.9%
Cap rate
0.9%
Rent to Value Ratio
Active
$1,149,000
5
bds
|
5
ba
|
4,895
sqft
|
built
1896
2050 N Alabama St, Indianapolis, IN 46202
$-3,955
Cash flow
-18.0%
Cash-on-Cash Return
2.0%
Cap rate
0.2%
Rent to Value Ratio
Active
$415,000
4
bds
|
3
ba
|
2,492
sqft
|
built
1977
8525 Winding Ridge Rd, Indianapolis, IN 46217
$-202
Cash flow
-2.5%
Cash-on-Cash Return
5.6%
Cap rate
0.7%
Rent to Value Ratio
Active
$235,000
3
bds
|
1
ba
|
1,472
sqft
|
built
1931
8436 E 56th St, Indianapolis, IN 46216
$-530
Cash flow
-11.8%
Cash-on-Cash Return
3.4%
Cap rate
0.7%
Rent to Value Ratio
Active
$239,900
3
bds
|
2
ba
|
1,236
sqft
|
built
1999
6227 Long River Ln, Indianapolis, IN 46221
$-141
Cash flow
-3.1%
Cash-on-Cash Return
5.4%
Cap rate
0.7%
Rent to Value Ratio
Active
$399,999
4
bds
|
3
ba
|
3,090
sqft
|
built
2002
8030 Parcrest Ct, Indianapolis, IN 46259
$-167
Cash flow
-2.2%
Cash-on-Cash Return
5.6%
Cap rate
0.7%
Rent to Value Ratio
Active
$210,000
2
bds
|
3
ba
|
1,789
sqft
|
built
1994
11632 Coastal Way, Indianapolis, IN 46229
$8
Cash flow
0.2%
Cash-on-Cash Return
6.2%
Cap rate
0.9%
Rent to Value Ratio
Active
$222,500
2
bds
|
1
ba
|
680
sqft
|
built
1939
606 E County Line Rd, Indianapolis, IN 46227
$-450
Cash flow
-10.6%
Cash-on-Cash Return
3.7%
Cap rate
0.4%
Rent to Value Ratio
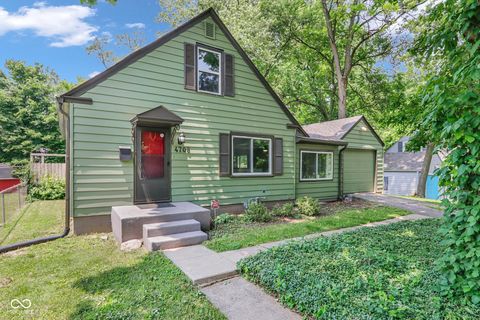
Active
$269,900
3
bds
|
2
ba
|
1,620
sqft
|
built
1947
4708 Haverford Ave, Indianapolis, IN 46205
$66
Cash flow
1.3%
Cash-on-Cash Return
6.4%
Cap rate
0.8%
Rent to Value Ratio
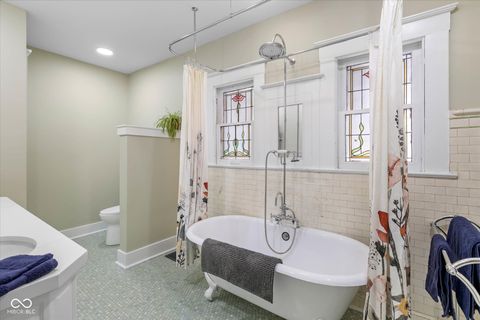
Active
$450,000
3
bds
|
2
ba
|
2,168
sqft
|
built
1900
552 Woodruff Place West Dr, Indianapolis, IN 46201
$-166
Cash flow
-1.9%
Cash-on-Cash Return
5.7%
Cap rate
0.7%
Rent to Value Ratio
Active
$215,000
1
bds
|
2
ba
|
998
sqft
|
built
2006
1635 N College Ave, Indianapolis, IN 46202
$-159
Cash flow
-3.9%
Cash-on-Cash Return
5.3%
Cap rate
0.8%
Rent to Value Ratio
Active
$310,000
0
bds
|
0
ba
|
0
sqft
|
built
1916
38 N Irvington Ave, Indianapolis, IN 46219
$-622
Cash flow
-10.5%
Cash-on-Cash Return
3.7%
Cap rate
0.5%
Rent to Value Ratio
Active
$899,000
3
bds
|
4
ba
|
4,173
sqft
|
built
2018
1818 N Pennsylvania St, Indianapolis, IN 46202
$-700
Cash flow
-4.1%
Cash-on-Cash Return
5.2%
Cap rate
0.7%
Rent to Value Ratio

Active
$814,900
4
bds
|
5
ba
|
5,333
sqft
|
built
1990
10919 Running Tide Ct, Indianapolis, IN 46236
$-630
Cash flow
-4.0%
Cash-on-Cash Return
5.2%
Cap rate
0.6%
Rent to Value Ratio

Active
$250,000
3
bds
|
2
ba
|
1,281
sqft
|
built
1999
6011 Twyckenham Dr, Indianapolis, IN 46236
$3
Cash flow
0.1%
Cash-on-Cash Return
6.2%
Cap rate
0.8%
Rent to Value Ratio