Marion County Investment Properties for Sale
Browse homes for sale and investment properties in Marion County. Refine your search by price, property type, or more.
Best cash flowing properties in Marion County

Active
$76,000
4
bds
|
3
ba
|
1,538
sqft
|
built
1920
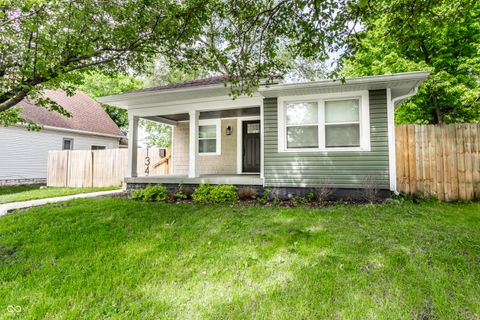
1014 W 33rd St, Indianapolis, IN 46208
$508
Cash flow
34.9%
Cash-on-Cash Return
14.2%
Cap rate
1.7%
Rent to Value Ratio

Active
$98,750
2
bds
|
1
ba
|
954
sqft
|
built
1924
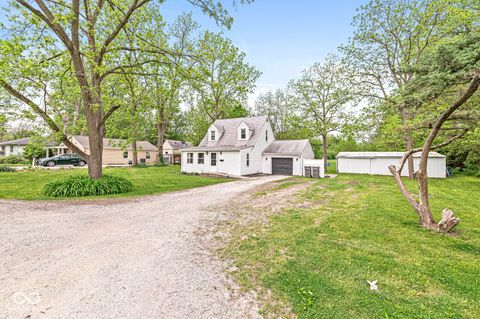
4931 Orion Ave, Indianapolis, IN 46201
$460
Cash flow
24.3%
Cash-on-Cash Return
11.7%
Cap rate
1.4%
Rent to Value Ratio
1,658 out of 1,805 properties for sale in Marion County
Limited Results Shown
Create a free account, or log in to reveal all property listings and enjoy the complete experience.

Active
$170,000
3
bds
|
2
ba
|
1,360
sqft
|
built
1922
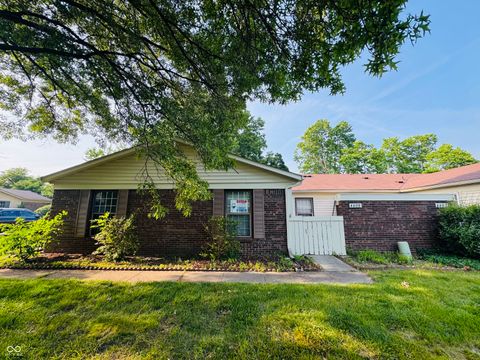
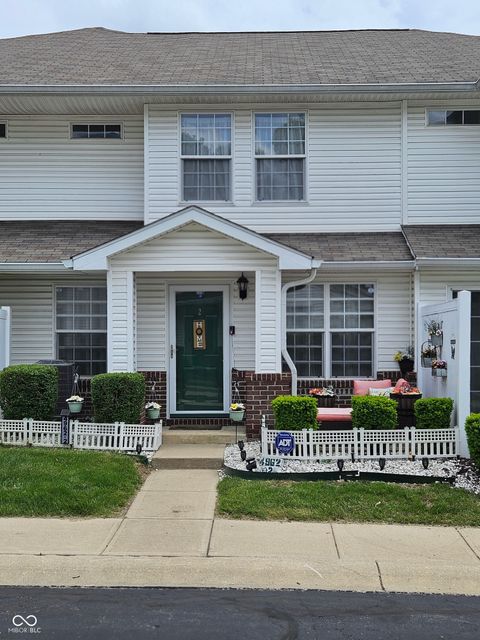
1322 S Belmont Ave, Indianapolis, IN 46221
$-112
Cash flow
-3.4%
Cash-on-Cash Return
5.4%
Cap rate
0.6%
Rent to Value Ratio
Active
$159,900
2
bds
|
2
ba
|
1,061
sqft
|
built
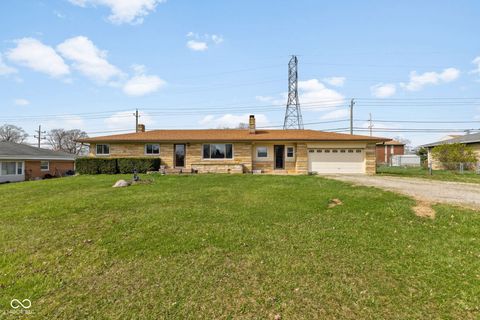
1973
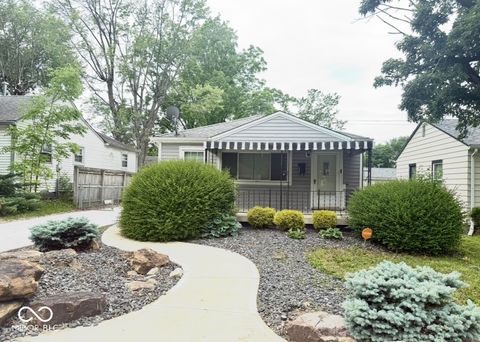
4408 Clovelly Ct, Indianapolis, IN 46254
$-42
Cash flow
-1.4%
Cash-on-Cash Return
5.8%
Cap rate
0.9%
Rent to Value Ratio

Active
$344,900
3
bds
|
2
ba
|
2,362
sqft
|
built
1900
1333 Spann Ave, Indianapolis, IN 46203
$-180
Cash flow
-2.7%
Cash-on-Cash Return
5.5%
Cap rate
0.7%
Rent to Value Ratio

Active
$315,000
4
bds
|
3
ba
|
3,082
sqft
|
built
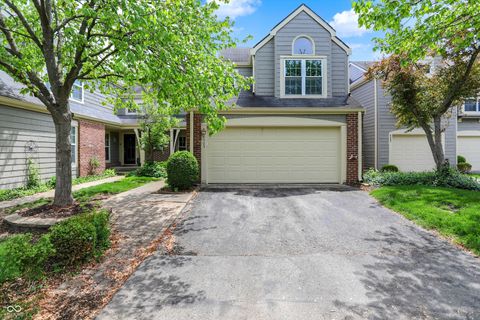
1986
2747 E Midland Rd, Indianapolis, IN 46227
$-96
Cash flow
-1.6%
Cash-on-Cash Return
5.8%
Cap rate
0.7%
Rent to Value Ratio

Active
$250,000
4
bds
|
2
ba
|
1,602
sqft
|
built
1955
6601 Twin Brooks Dr, Indianapolis, IN 46227
$99
Cash flow
2.1%
Cash-on-Cash Return
6.6%
Cap rate
0.8%
Rent to Value Ratio
Active
$244,900
3
bds
|
2
ba
|
2,358
sqft
|
built
1954
3638 Redfern Dr, Indianapolis, IN 46237
$-82
Cash flow
-1.7%
Cash-on-Cash Return
5.7%
Cap rate
0.7%
Rent to Value Ratio
Active
$235,000
2
bds
|
3
ba
|
1,454
sqft
|
built
1985
6505 Miramar Ct, Indianapolis, IN 46250
$-247
Cash flow
-5.5%
Cash-on-Cash Return
4.9%
Cap rate
0.8%
Rent to Value Ratio
Active
$650,000
3
bds
|
3
ba
|
2,048
sqft
|
built
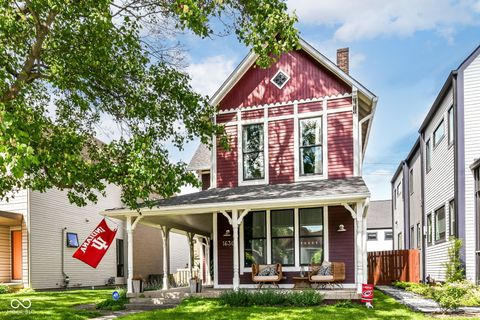
2010
1630 N New Jersey St, Indianapolis, IN 46202
$-1,191
Cash flow
-9.6%
Cash-on-Cash Return
3.9%
Cap rate
0.5%
Rent to Value Ratio
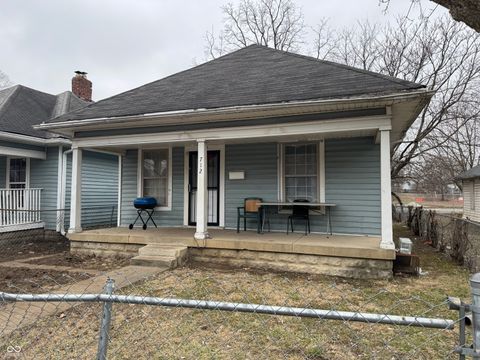
Active
$80,000
1
bds
|
1
ba
|
708
sqft
|
built
1925
712 Lynn St, Indianapolis, IN 46222
$280
Cash flow
18.3%
Cash-on-Cash Return
10.4%
Cap rate
1.3%
Rent to Value Ratio
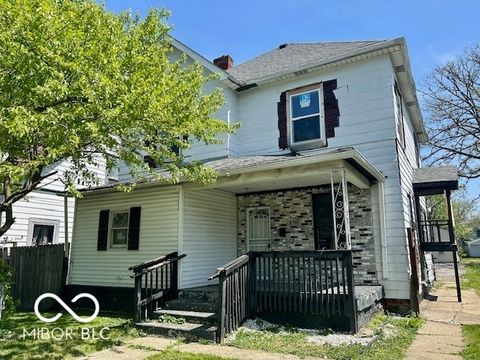
Active
$100,000
4
bds
|
2
ba
|
1,876
sqft
|
built
1876
2701 N Gale St, Indianapolis, IN 46218
$316
Cash flow
16.5%
Cash-on-Cash Return
9.9%
Cap rate
1.2%
Rent to Value Ratio
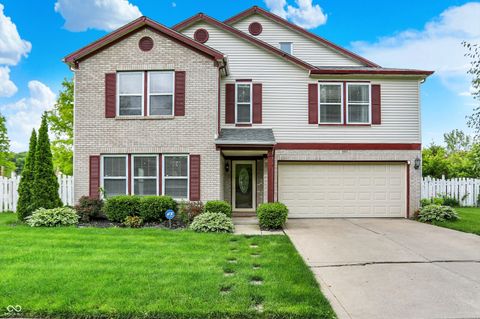
Active
$365,000
5
bds
|
3
ba
|
3,898
sqft
|
built
1999
9001 Harrison Run Ct, Indianapolis, IN 46256
$29
Cash flow
0.4%
Cash-on-Cash Return
6.2%
Cap rate
0.8%
Rent to Value Ratio
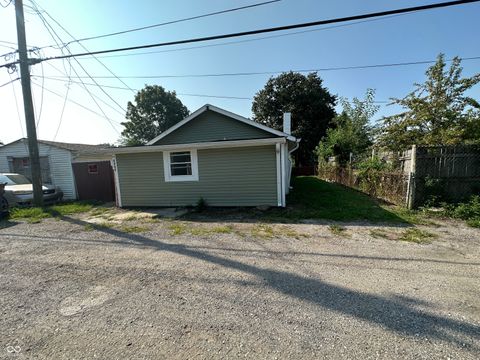
Active
$105,000
2
bds
|
1
ba
|
1,574
sqft
|
built
1950
2310 E Raymond St, Indianapolis, IN 46203
$428
Cash flow
21.3%
Cash-on-Cash Return
11.0%
Cap rate
1.3%
Rent to Value Ratio

Active
$255,000
4
bds
|
3
ba
|
2,064
sqft
|
built
1910
44 S Butler Ave, Indianapolis, IN 46219
$-202
Cash flow
-4.1%
Cash-on-Cash Return
5.2%
Cap rate
0.6%
Rent to Value Ratio
Active
$240,000
2
bds
|
1
ba
|
1,006
sqft
|
built
1923
1342 N Oakland Ave, Indianapolis, IN 46201
$151
Cash flow
3.3%
Cash-on-Cash Return
6.9%
Cap rate
0.8%
Rent to Value Ratio

Active
$124,999
2
bds
|
1
ba
|
980
sqft
|
built
1920
1510 E Gimber St, Indianapolis, IN 46203
$50
Cash flow
2.1%
Cash-on-Cash Return
6.6%
Cap rate
0.8%
Rent to Value Ratio
Active
$275,000
3
bds
|
2
ba
|
1,784
sqft
|
built
1945
2 S 25th Ave, Beech Grove, IN 46107
$109
Cash flow
2.1%
Cash-on-Cash Return
6.6%
Cap rate
0.8%
Rent to Value Ratio
Active
$177,000
2
bds
|
3
ba
|
1,148
sqft
|
built
2003
4962 Potomac Square Pl, Indianapolis, IN 46268
$-12
Cash flow
-0.4%
Cash-on-Cash Return
6.1%
Cap rate
0.9%
Rent to Value Ratio

Active
$155,000
4
bds
|
2
ba
|
1,598
sqft
|
built
1920
443 N Centennial St, Indianapolis, IN 46222
$172
Cash flow
5.8%
Cash-on-Cash Return
7.5%
Cap rate
0.9%
Rent to Value Ratio
Active
$164,999
3
bds
|
1
ba
|
912
sqft
|
built
1954
1844 N Riley Ave, Indianapolis, IN 46218
$121
Cash flow
3.8%
Cash-on-Cash Return
7.0%
Cap rate
0.8%
Rent to Value Ratio

Active
$296,000
3
bds
|
4
ba
|
2,394
sqft
|
built
2002
2035 Theodore Dr, Indianapolis, IN 46214
$2
Cash flow
0.0%
Cash-on-Cash Return
6.2%
Cap rate
0.7%
Rent to Value Ratio
Active
$219,900
3
bds
|
2
ba
|
1,776
sqft
|
built
1910
221 N Munsie St, Indianapolis, IN 46229
$116
Cash flow
2.8%
Cash-on-Cash Return
6.8%
Cap rate
0.8%
Rent to Value Ratio

Active
$900,000
2
bds
|
2
ba
|
2,545
sqft
|
built
2009
333 Massachusetts Ave, Indianapolis, IN 46204
$-2,572
Cash flow
-14.9%
Cash-on-Cash Return
2.7%
Cap rate
0.4%
Rent to Value Ratio
Active
$527,000
3
bds
|
3
ba
|
1,790
sqft
|
built
1955
1715 N Alabama St, Indianapolis, IN 46202
$60
Cash flow
0.6%
Cash-on-Cash Return
6.3%
Cap rate
0.8%
Rent to Value Ratio

Active
$385,000
3
bds
|
2
ba
|
2,057
sqft
|
built
1985
5431 Nathan Pl, Indianapolis, IN 46237
$-592
Cash flow
-8.0%
Cash-on-Cash Return
4.3%
Cap rate
0.5%
Rent to Value Ratio
Active
$190,000
3
bds
|
2
ba
|
1,186
sqft
|
built
1910
1256 Kappes St, Indianapolis, IN 46221
$-7
Cash flow
-0.2%
Cash-on-Cash Return
6.1%
Cap rate
0.7%
Rent to Value Ratio
Active
$117,900
2
bds
|
2
ba
|
1,274
sqft
|
built
1970
5525 Roxbury Ter, Indianapolis, IN 46226
$-264
Cash flow
-11.7%
Cash-on-Cash Return
3.5%
Cap rate
1.2%
Rent to Value Ratio

Active
$380,000
2
bds
|
4
ba
|
1,543
sqft
|
built
2022
2135 N College Ave, Indianapolis, IN 46202
$-46
Cash flow
-0.6%
Cash-on-Cash Return
6.0%
Cap rate
0.8%
Rent to Value Ratio

Active
$265,000
3
bds
|
2
ba
|
1,266
sqft
|
built
1996
7009 Thousand Oaks Ln, Indianapolis, IN 46214
$-126
Cash flow
-2.5%
Cash-on-Cash Return
5.6%
Cap rate
0.7%
Rent to Value Ratio

Active
$225,000
3
bds
|
2
ba
|
2,300
sqft
|
built
1966
6111 S Irwin St, Indianapolis, IN 46237
$-49
Cash flow
-1.1%
Cash-on-Cash Return
5.9%
Cap rate
0.7%
Rent to Value Ratio

Active
$186,000
3
bds
|
2
ba
|
1,200
sqft
|
built
1959
3024 N Huber St, Indianapolis, IN 46226
$13
Cash flow
0.4%
Cash-on-Cash Return
6.2%
Cap rate
0.8%
Rent to Value Ratio

Active
$367,900
4
bds
|
3
ba
|
2,870
sqft
|
built
2014
8835 Melville Ct, Indianapolis, IN 46239
$-205
Cash flow
-2.9%
Cash-on-Cash Return
5.5%
Cap rate
0.7%
Rent to Value Ratio

Active
$135,000
3
bds
|
1
ba
|
900
sqft
|
built
1959
7840 Roseway Ct, Indianapolis, IN 46226
$274
Cash flow
10.6%
Cash-on-Cash Return
8.6%
Cap rate
1.0%
Rent to Value Ratio
Active
$324,000
0
bds
|
0
ba
|
0
sqft
|
built
1920
3402 Carrollton Ave, Indianapolis, IN 46205
$-556
Cash flow
-9.0%
Cash-on-Cash Return
4.1%
Cap rate
0.5%
Rent to Value Ratio

Active
$249,900
4
bds
|
0
ba
|
0
sqft
|
built
1890
802 Weghorst St, Indianapolis, IN 46203
$100
Cash flow
2.1%
Cash-on-Cash Return
6.6%
Cap rate
0.8%
Rent to Value Ratio

Active
$220,000
3
bds
|
2
ba
|
1,560
sqft
|
built
2005
11203 Leo Dr, Indianapolis, IN 46235
$154
Cash flow
3.7%
Cash-on-Cash Return
7.0%
Cap rate
0.9%
Rent to Value Ratio

Active
$115,000
2
bds
|
1
ba
|
972
sqft
|
built
1915
601 N Livingston Ave, Indianapolis, IN 46222
$377
Cash flow
17.1%
Cash-on-Cash Return
10.1%
Cap rate
1.2%
Rent to Value Ratio

Active
$550,000
4
bds
|
3
ba
|
3,114
sqft
|
built
1957
9022 W 52nd St, Indianapolis, IN 46234
$-678
Cash flow
-6.4%
Cash-on-Cash Return
4.7%
Cap rate
0.6%
Rent to Value Ratio

Active
$289,900
3
bds
|
2
ba
|
2,124
sqft
|
built
1957
1677 N Pasadena St, Indianapolis, IN 46219
$-450
Cash flow
-8.1%
Cash-on-Cash Return
4.3%
Cap rate
0.5%
Rent to Value Ratio