Monroe County Investment Properties for Sale
Browse homes for sale and investment properties in Monroe County. Refine your search by price, property type, or more.
Best cash flowing properties in Monroe County

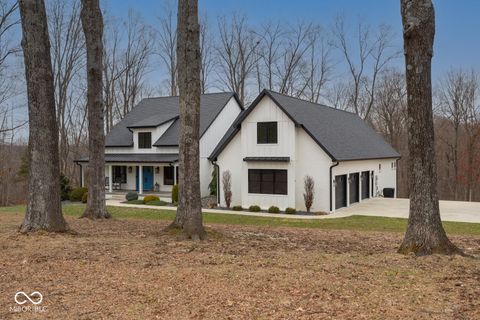
Active
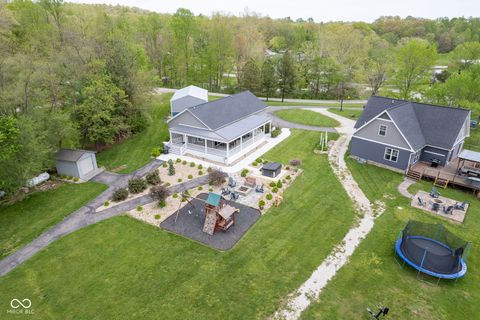
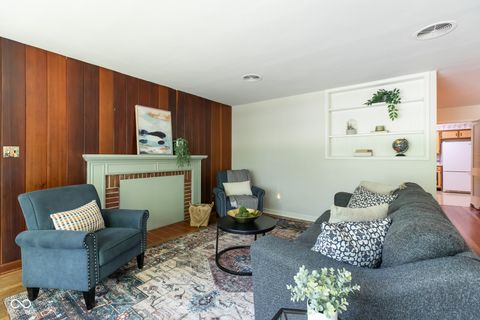
$350,000
3
bds
|
2
ba
|
3,510
sqft
|
built
1950
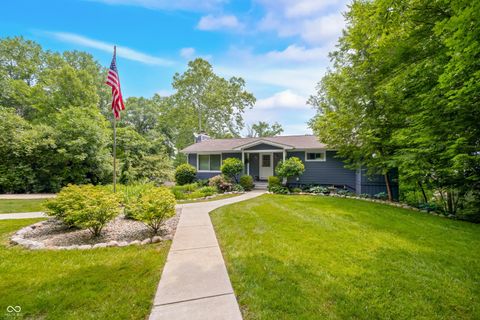
9504 E Northshore Dr, Unionville, IN 47468
$346
Cash flow
5.2%
Cash-on-Cash Return
7.3%
Cap rate
0.9%
Rent to Value Ratio
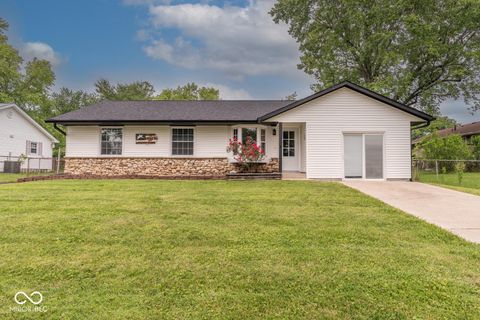
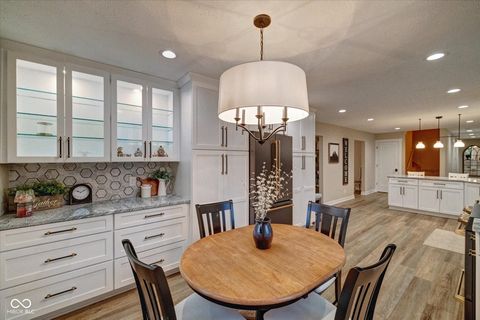
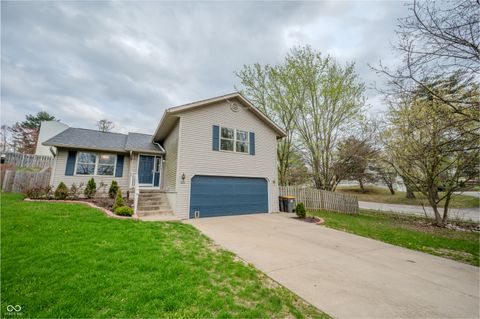
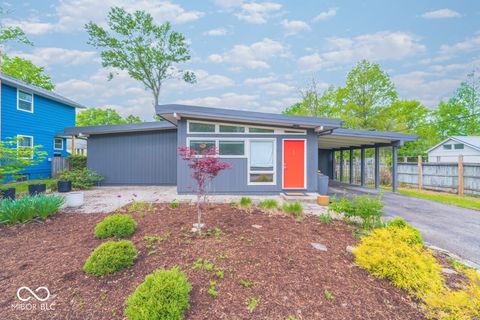
Active
$274,900
3
bds
|
2
ba
|
1,624
sqft
|
built
1974
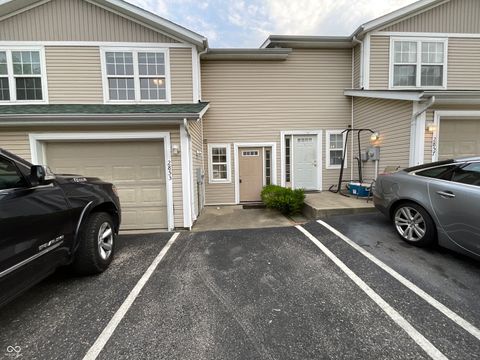
3212 S Fairington Dr, Bloomington, IN 47403
$-28
Cash flow
-0.5%
Cash-on-Cash Return
6.0%
Cap rate
0.7%
Rent to Value Ratio
37 out of 75 properties for sale in Monroe County
Limited Results Shown
Create a free account, or log in to reveal all property listings and enjoy the complete experience.
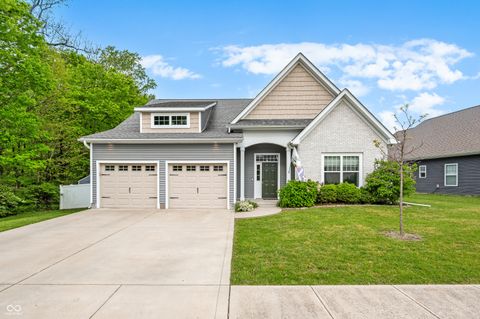
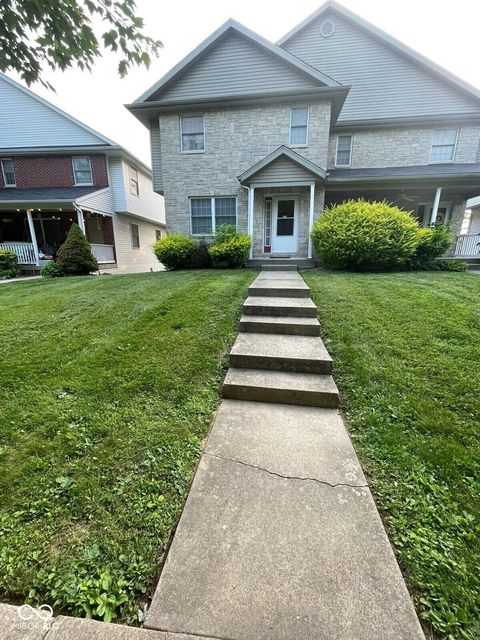
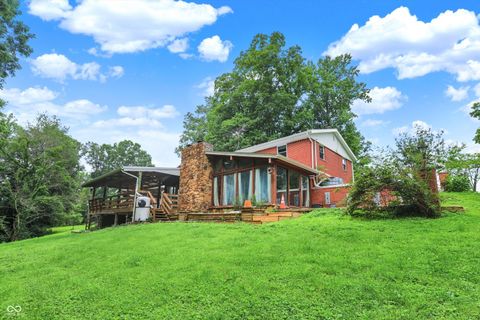
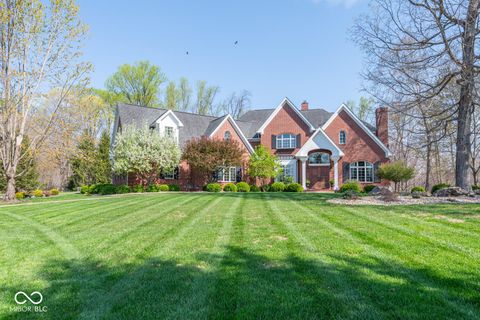
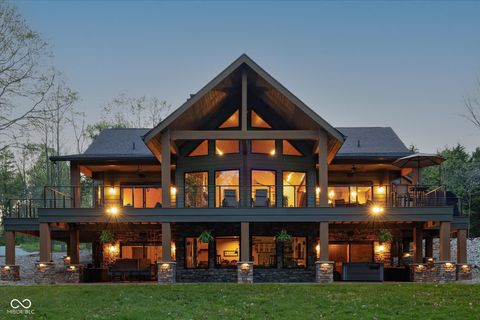
Active
$550,000
4
bds
|
3
ba
|
2,536
sqft
|
built
2017
4105 N Emma Dr, Bloomington, IN 47404
$-885
Cash flow
-8.4%
Cash-on-Cash Return
4.2%
Cap rate
0.5%
Rent to Value Ratio
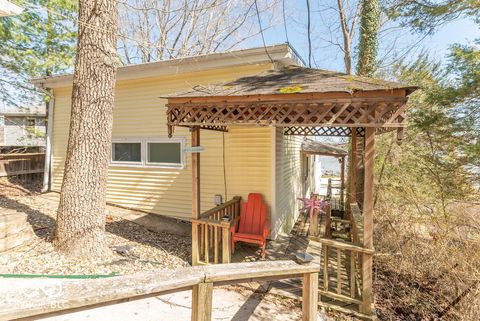
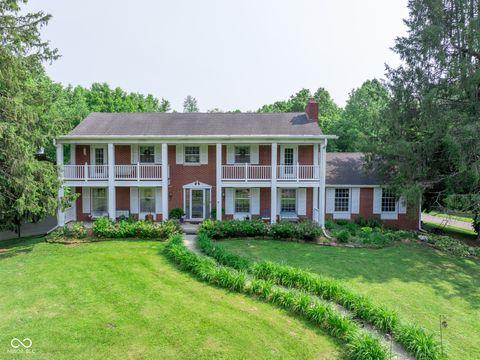
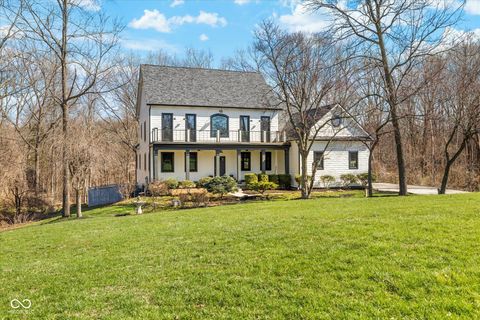
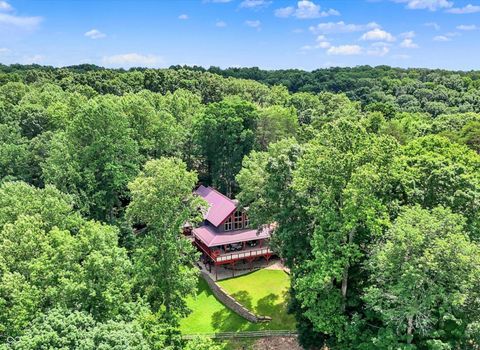
Active
$749,900
5
bds
|
3
ba
|
3,088
sqft
|
built
1960
8027 N Lakeview Dr, Unionville, IN 47468
$-1,633
Cash flow
-11.4%
Cash-on-Cash Return
3.5%
Cap rate
0.4%
Rent to Value Ratio
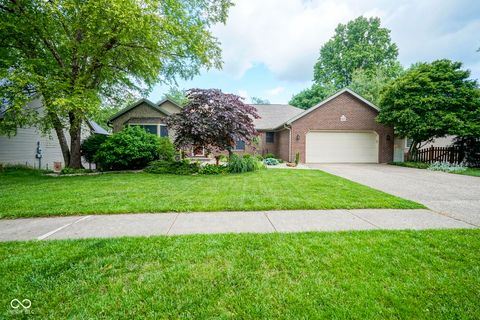
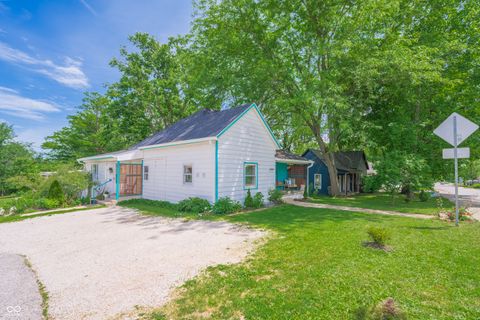
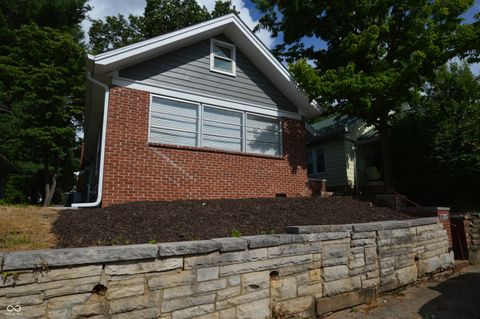
Active
$639,900
5
bds
|
4
ba
|
3,988
sqft
|
built
1996
4019 E Bennington Blvd, Bloomington, IN 47401
$-804
Cash flow
-6.6%
Cash-on-Cash Return
4.6%
Cap rate
0.6%
Rent to Value Ratio
Active
$1,450,000
4
bds
|
3
ba
|
2,333
sqft
|
built
2017
9550 E Northshore Dr, Unionville, IN 47468
$-4,814
Cash flow
-17.3%
Cash-on-Cash Return
2.2%
Cap rate
0.3%
Rent to Value Ratio
Active
$929,000
4
bds
|
3
ba
|
4,128
sqft
|
built
1955
8191 E Northshore Dr, Unionville, IN 47468
$-826
Cash flow
-4.6%
Cash-on-Cash Return
5.1%
Cap rate
0.6%
Rent to Value Ratio
Active
$285,000
3
bds
|
3
ba
|
1,344
sqft
|
built
2007
2579 S Addisyn Ln, Bloomington, IN 47403
$-456
Cash flow
-8.3%
Cash-on-Cash Return
4.2%
Cap rate
0.6%
Rent to Value Ratio
Active
$1,150,000
4
bds
|
3
ba
|
3,354
sqft
|
built
1963
9550 E State Road 46, Bloomington, IN 47401
$-3,200
Cash flow
-14.5%
Cash-on-Cash Return
2.8%
Cap rate
0.3%
Rent to Value Ratio

Active
$1,200,000
4
bds
|
2
ba
|
1,728
sqft
|
built
1975
9408 Derrett Rd, Unionville, IN 47468
$-3,416
Cash flow
-14.9%
Cash-on-Cash Return
2.7%
Cap rate
0.3%
Rent to Value Ratio
Active
$250,900
3
bds
|
3
ba
|
1,628
sqft
|
built
1994
917 Timothy Ct, Bloomington, IN 47403
$-43
Cash flow
-0.9%
Cash-on-Cash Return
5.9%
Cap rate
0.7%
Rent to Value Ratio

Active
$1,450,000
3
bds
|
2
ba
|
1,558
sqft
|
built
2017
9548 E Northshore Dr, Unionville, IN 47468
$-5,435
Cash flow
-19.6%
Cash-on-Cash Return
1.6%
Cap rate
0.2%
Rent to Value Ratio
Active
$441,000
3
bds
|
2
ba
|
2,444
sqft
|
built
1964
6810 N Showers Rd, Bloomington, IN 47408
$-534
Cash flow
-6.3%
Cash-on-Cash Return
4.7%
Cap rate
0.6%
Rent to Value Ratio
Active
$824,900
5
bds
|
6
ba
|
5,352
sqft
|
built
2004
7960 N Thames Dr, Bloomington, IN 47408
$-1,811
Cash flow
-11.5%
Cash-on-Cash Return
3.5%
Cap rate
0.4%
Rent to Value Ratio
Active
$435,000
5
bds
|
0
ba
|
0
sqft
|
built
1920
1101 S Rogers St, Bloomington, IN 47403
$-710
Cash flow
-8.5%
Cash-on-Cash Return
4.2%
Cap rate
0.5%
Rent to Value Ratio
Active
$199,900
3
bds
|
3
ba
|
1,251
sqft
|
built
2004
2853 S Walnut Street Pike, Bloomington, IN 47401
$-50
Cash flow
-1.3%
Cash-on-Cash Return
5.8%
Cap rate
0.8%
Rent to Value Ratio
Active
$449,000
3
bds
|
2
ba
|
1,691
sqft
|
built
2021
8917 N Old State Road 37, Bloomington, IN 47408
$-575
Cash flow
-6.7%
Cash-on-Cash Return
4.6%
Cap rate
0.6%
Rent to Value Ratio
Active
$940,000
4
bds
|
2
ba
|
2,216
sqft
|
built
1955
7600 N Blue Heron Dr, Unionville, IN 47468
$-2,883
Cash flow
-16.0%
Cash-on-Cash Return
2.5%
Cap rate
0.3%
Rent to Value Ratio
Active
$499,000
5
bds
|
3
ba
|
634
sqft
|
built
1930
308 S Madison St, Bloomington, IN 47403
$-969
Cash flow
-10.1%
Cash-on-Cash Return
3.8%
Cap rate
0.5%
Rent to Value Ratio
Active
$229,000
2
bds
|
3
ba
|
1,470
sqft
|
built
1975
9441 S Pointe Lasalles Dr, Bloomington, IN 47401
$-356
Cash flow
-8.1%
Cash-on-Cash Return
4.3%
Cap rate
0.7%
Rent to Value Ratio

Active
$249,900
3
bds
|
1
ba
|
945
sqft
|
built
1945
7935 W Ratliff Rd, Bloomington, IN 47404
$-314
Cash flow
-6.6%
Cash-on-Cash Return
4.6%
Cap rate
0.6%
Rent to Value Ratio
Active
$579,000
4
bds
|
4
ba
|
4,294
sqft
|
built
2018
5415 S Chalmers Ct, Bloomington, IN 47403
$-1,241
Cash flow
-11.2%
Cash-on-Cash Return
3.6%
Cap rate
0.4%
Rent to Value Ratio
Active
$950,000
4
bds
|
3
ba
|
3,036
sqft
|
built
1920
4155 S Walnut Street Pike, Bloomington, IN 47401
$-1,761
Cash flow
-9.7%
Cash-on-Cash Return
3.9%
Cap rate
0.5%
Rent to Value Ratio
Active
$389,900
2
bds
|
2
ba
|
864
sqft
|
built
1940
6829 S Shields Ridge Rd, Bloomington, IN 47401
$-1,031
Cash flow
-13.8%
Cash-on-Cash Return
3.0%
Cap rate
0.4%
Rent to Value Ratio

Active
$379,000
4
bds
|
2
ba
|
1,872
sqft
|
built
1978
8899 E Southshore Dr, Unionville, IN 47468
$-975
Cash flow
-13.4%
Cash-on-Cash Return
3.1%
Cap rate
0.4%
Rent to Value Ratio
Active
$1,150,000
4
bds
|
4
ba
|
4,538
sqft
|
built
2018
5023 S Iron Gate Trl, Bloomington, IN 47403
$-3,683
Cash flow
-16.7%
Cash-on-Cash Return
2.3%
Cap rate
0.3%
Rent to Value Ratio
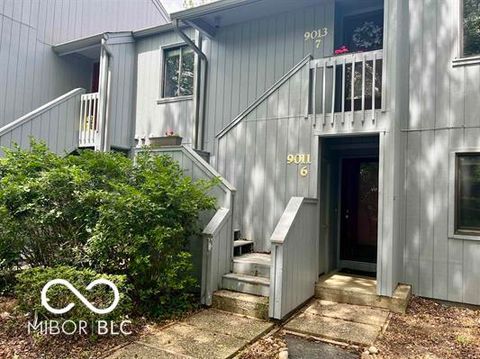
Active
$174,900
2
bds
|
2
ba
|
843
sqft
|
built
1975
9011 S Pointe Ridge Ln, Bloomington, IN 47401
$-227
Cash flow
-6.8%
Cash-on-Cash Return
4.6%
Cap rate
0.8%
Rent to Value Ratio
Active
$1,890,000
5
bds
|
6
ba
|
10,238
sqft
|
built
2005
4636 S Hawks Way, Bloomington, IN 47401
$-7,668
Cash flow
-21.2%
Cash-on-Cash Return
1.3%
Cap rate
0.2%
Rent to Value Ratio

Active
$1,180,000
4
bds
|
5
ba
|
4,052
sqft
|
built
1981
1227 S Pickwick Pt, Bloomington, IN 47401
$-2,112
Cash flow
-9.3%
Cash-on-Cash Return
4.0%
Cap rate
0.5%
Rent to Value Ratio
Active
$465,000
3
bds
|
2
ba
|
1,706
sqft
|
built
1970
500 S Arbutus Dr, Bloomington, IN 47401
$-795
Cash flow
-8.9%
Cash-on-Cash Return
4.1%
Cap rate
0.5%
Rent to Value Ratio
Active
$490,000
5
bds
|
2
ba
|
2,257
sqft
|
built
1950
815 S Rose Ave, Bloomington, IN 47401
$-578
Cash flow
-6.2%
Cash-on-Cash Return
4.7%
Cap rate
0.6%
Rent to Value Ratio
Active
$1,100,000
3
bds
|
3
ba
|
3,814
sqft
|
built
2019
6952 S Ketcham Rd, Bloomington, IN 47403
$-3,910
Cash flow
-18.5%
Cash-on-Cash Return
1.9%
Cap rate
0.2%
Rent to Value Ratio

Active
$499,900
2
bds
|
1
ba
|
1,008
sqft
|
built
1993
9300 Derrett Rd, Unionville, IN 47468
$-422
Cash flow
-4.4%
Cash-on-Cash Return
5.1%
Cap rate
0.6%
Rent to Value Ratio
Active
$1,090,000
5
bds
|
5
ba
|
5,368
sqft
|
built
2007
5736 N Pathways Dr, Unionville, IN 47468
$-2,065
Cash flow
-9.9%
Cash-on-Cash Return
3.9%
Cap rate
0.5%
Rent to Value Ratio

Active
$1,299,000
3
bds
|
3
ba
|
3,116
sqft
|
built
2017
7493 E Rush Ridge Rd, Bloomington, IN 47401
$-3,160
Cash flow
-12.7%
Cash-on-Cash Return
3.2%
Cap rate
0.4%
Rent to Value Ratio
Active
$379,900
3
bds
|
2
ba
|
1,424
sqft
|
built
1920
1205 S Lincoln St, Bloomington, IN 47401
$-359
Cash flow
-4.9%
Cash-on-Cash Return
5.0%
Cap rate
0.6%
Rent to Value Ratio
Active
$850,000
4
bds
|
4
ba
|
3,562
sqft
|
built
2013
4210 S Leonard Springs Rd, Bloomington, IN 47403
$-1,594
Cash flow
-9.8%
Cash-on-Cash Return
3.9%
Cap rate
0.5%
Rent to Value Ratio