Morgan County Investment Properties for Sale
Browse homes for sale and investment properties in Morgan County. Refine your search by price, property type, or more.
Best cash flowing properties in Morgan County
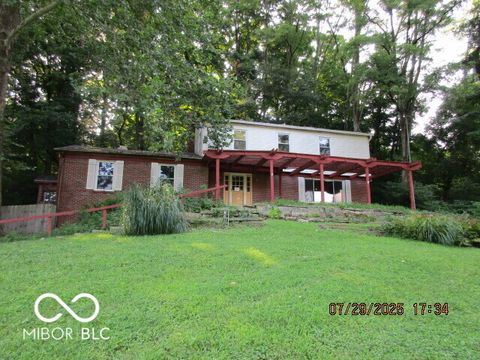
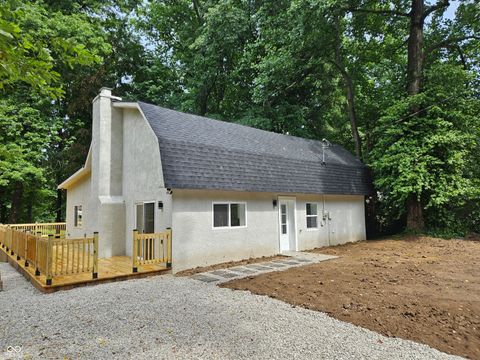
Active
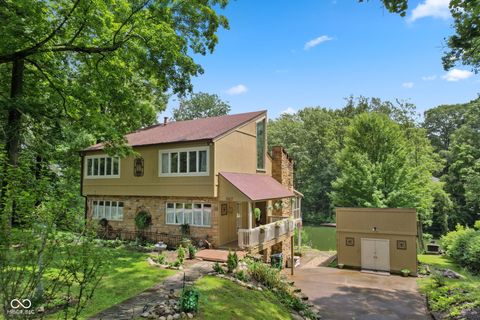
$227,500
3
bds
|
3
ba
|
2,818
sqft
|
built
1965
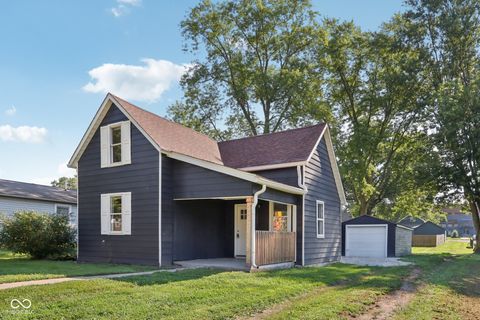
2340 N Egbert Rd, Martinsville, IN 46151
$560
Cash flow
12.8%
Cash-on-Cash Return
9.1%
Cap rate
1.1%
Rent to Value Ratio
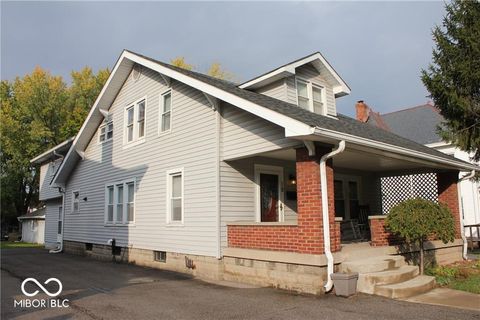
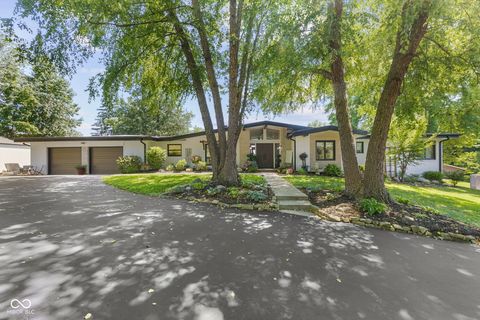
Active
$280,000
4
bds
|
3
ba
|
2,728
sqft
|
built
1930
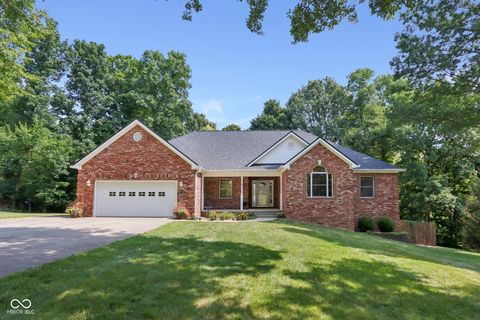
18 W High St, Mooresville, IN 46158
$498
Cash flow
9.3%
Cash-on-Cash Return
8.3%
Cap rate
1.0%
Rent to Value Ratio
95 out of 125 properties for sale in Morgan County
Limited Results Shown
Create a free account, or log in to reveal all property listings and enjoy the complete experience.
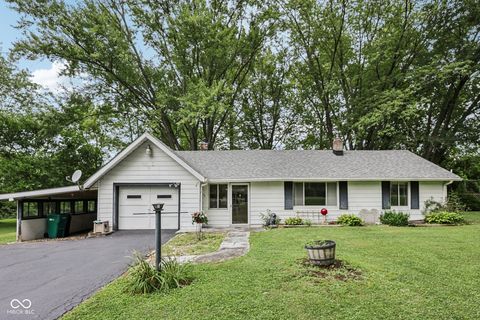
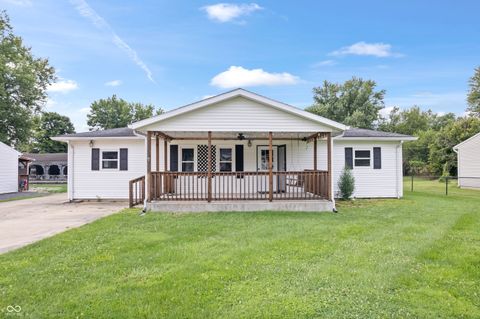
Active
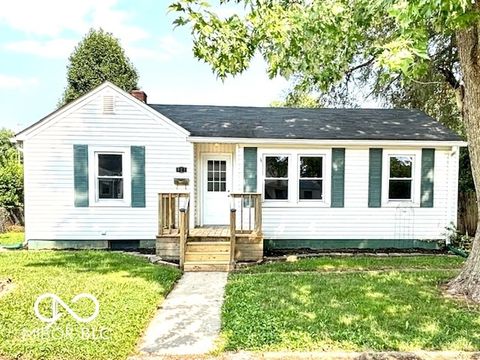
$194,900
3
bds
|
1
ba
|
1,107
sqft
|
built
1955
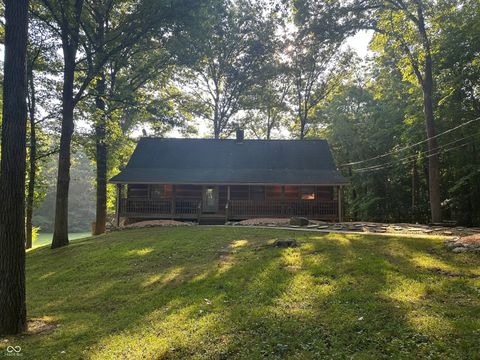
286 W Milhon North Dr, Mooresville, IN 46158
$106
Cash flow
2.8%
Cash-on-Cash Return
6.8%
Cap rate
0.8%
Rent to Value Ratio

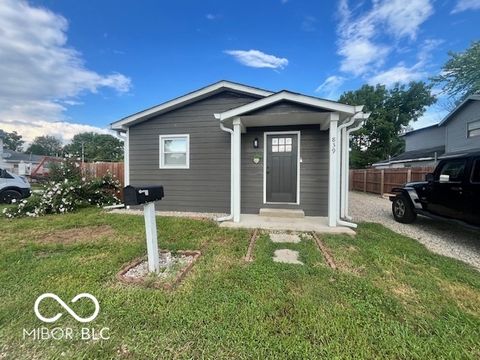
Active
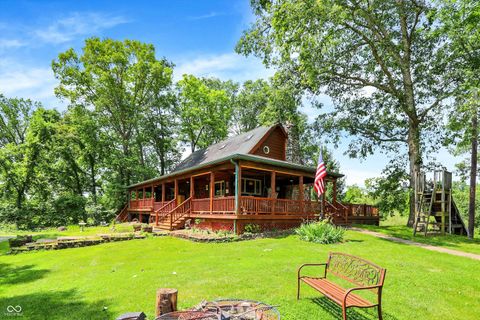
$599,000
3
bds
|
2
ba
|
2,950
sqft
|
built
1991
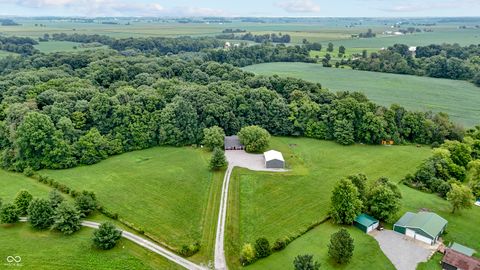
2735 Little Hurricane Rd, Martinsville, IN 46151
$-1,136
Cash flow
-9.9%
Cash-on-Cash Return
3.9%
Cap rate
0.5%
Rent to Value Ratio
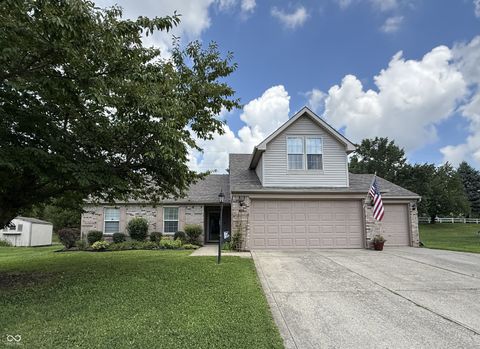
Active
$325,000
4
bds
|
2
ba
|
2,148
sqft
|
built
2000
219 Creekview Cir, Mooresville, IN 46158
$-172
Cash flow
-2.8%
Cash-on-Cash Return
5.5%
Cap rate
0.7%
Rent to Value Ratio

Active
$475,000
3
bds
|
3
ba
|
2,910
sqft
|
built
1994
2275 Brandywine Ln, Martinsville, IN 46151
$-1,053
Cash flow
-11.6%
Cash-on-Cash Return
3.5%
Cap rate
0.4%
Rent to Value Ratio
Active
$215,000
3
bds
|
2
ba
|
1,356
sqft
|
built
1900
107 S Main St, Brooklyn, IN 46111
$-342
Cash flow
-8.3%
Cash-on-Cash Return
4.2%
Cap rate
0.5%
Rent to Value Ratio
Active
$549,900
4
bds
|
3
ba
|
3,280
sqft
|
built
2001
11807 N Lambert Ct, Mooresville, IN 46158
$-1,092
Cash flow
-10.4%
Cash-on-Cash Return
3.8%
Cap rate
0.5%
Rent to Value Ratio
Active
$549,999
4
bds
|
3
ba
|
3,356
sqft
|
built
1987
11133 N Paddock Rd S, Mooresville, IN 46158
$-885
Cash flow
-8.4%
Cash-on-Cash Return
4.2%
Cap rate
0.5%
Rent to Value Ratio
Active
$450,000
3
bds
|
2
ba
|
1,596
sqft
|
built
1993
7299 N Fawn Ln, Quincy, IN 47456
$-1,222
Cash flow
-14.2%
Cash-on-Cash Return
2.9%
Cap rate
0.4%
Rent to Value Ratio

Active
$412,500
3
bds
|
2
ba
|
2,066
sqft
|
built
2005
3160 Southampton Dr, Martinsville, IN 46151
$-599
Cash flow
-7.6%
Cash-on-Cash Return
4.4%
Cap rate
0.6%
Rent to Value Ratio

Active
$365,000
4
bds
|
3
ba
|
3,672
sqft
|
built
1920
990 E Washington St, Martinsville, IN 46151
$-628
Cash flow
-9.0%
Cash-on-Cash Return
4.1%
Cap rate
0.5%
Rent to Value Ratio
Active
$385,900
3
bds
|
2
ba
|
2,550
sqft
|
built
1992
2665 Grey Fox Dr, Martinsville, IN 46151
$-459
Cash flow
-6.2%
Cash-on-Cash Return
4.7%
Cap rate
0.6%
Rent to Value Ratio
Active
$548,000
5
bds
|
3
ba
|
3,640
sqft
|
built
2023
9018 E Gayle Dr, Morgantown, IN 46160
$-1,124
Cash flow
-10.7%
Cash-on-Cash Return
3.7%
Cap rate
0.5%
Rent to Value Ratio

Active
$375,000
4
bds
|
2
ba
|
1,900
sqft
|
built
1971
3669 E Glenwood Dr, Martinsville, IN 46151
$-758
Cash flow
-10.5%
Cash-on-Cash Return
3.7%
Cap rate
0.5%
Rent to Value Ratio

Active
$599,900
3
bds
|
2
ba
|
3,796
sqft
|
built
1980
8405 Mc Whorter Rd, Martinsville, IN 46151
$-1,486
Cash flow
-12.9%
Cash-on-Cash Return
3.2%
Cap rate
0.4%
Rent to Value Ratio
Active
$499,900
4
bds
|
4
ba
|
2,302
sqft
|
built
1964
3545 Whippoorwill Lake North Dr, Monrovia, IN 46157
$-773
Cash flow
-8.1%
Cash-on-Cash Return
4.3%
Cap rate
0.5%
Rent to Value Ratio

Active
$526,500
3
bds
|
2
ba
|
1,441
sqft
|
built
1968
3325 Kivett Ln, Martinsville, IN 46151
$-1,317
Cash flow
-13.1%
Cash-on-Cash Return
3.1%
Cap rate
0.4%
Rent to Value Ratio
Active
$309,900
4
bds
|
3
ba
|
1,848
sqft
|
built
2000
101 Meadowview Dr, Mooresville, IN 46158
$-94
Cash flow
-1.6%
Cash-on-Cash Return
5.8%
Cap rate
0.7%
Rent to Value Ratio
Active
$610,000
5
bds
|
4
ba
|
4,397
sqft
|
built
2002
7221 State Road 42, Martinsville, IN 46151
$-710
Cash flow
-6.1%
Cash-on-Cash Return
4.8%
Cap rate
0.6%
Rent to Value Ratio
Active
$724,000
4
bds
|
4
ba
|
5,766
sqft
|
built
1993
6780 E Woodland Ct, Mooresville, IN 46158
$-1,332
Cash flow
-9.6%
Cash-on-Cash Return
3.9%
Cap rate
0.5%
Rent to Value Ratio

Active
$740,000
4
bds
|
3
ba
|
2,937
sqft
|
built
1990
8654 N Baltimore Rd, Monrovia, IN 46157
$-1,928
Cash flow
-13.6%
Cash-on-Cash Return
3.0%
Cap rate
0.4%
Rent to Value Ratio
Active
$480,000
4
bds
|
4
ba
|
4,108
sqft
|
built
1973
12166 N Bray Rd, Mooresville, IN 46158
$25
Cash flow
0.3%
Cash-on-Cash Return
6.2%
Cap rate
0.8%
Rent to Value Ratio

Active
$252,000
3
bds
|
2
ba
|
1,304
sqft
|
built
1964
79 Circle Dr, Mooresville, IN 46158
$-49
Cash flow
-1.0%
Cash-on-Cash Return
5.9%
Cap rate
0.7%
Rent to Value Ratio
Active
$635,000
3
bds
|
4
ba
|
3,140
sqft
|
built
2001
600 Old Moore Rd, Martinsville, IN 46151
$-1,528
Cash flow
-12.6%
Cash-on-Cash Return
3.3%
Cap rate
0.4%
Rent to Value Ratio
Active
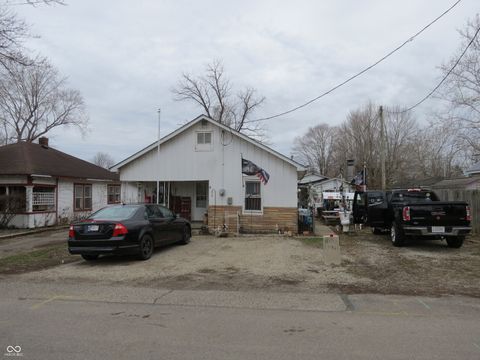
$95,500
2
bds
|
0
ba
|
0
sqft
|
built
1932
450 Hoosier St, Morgantown, IN 46160
$477
Cash flow
26.1%
Cash-on-Cash Return
12.1%
Cap rate
1.5%
Rent to Value Ratio
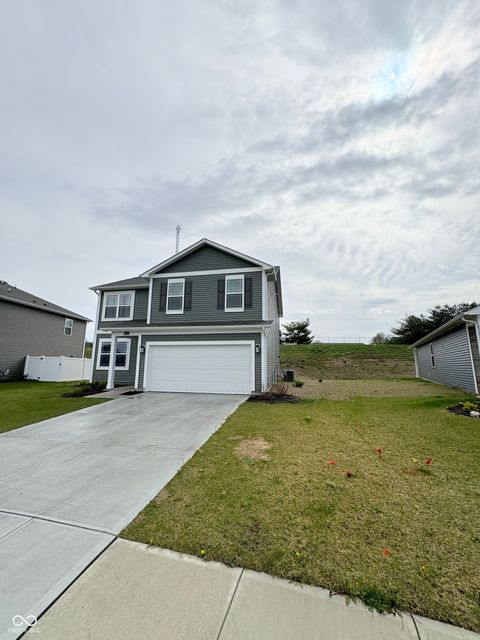
Active
$323,500
4
bds
|
3
ba
|
3,294
sqft
|
built
2023
10931 N Longbranch St, Monrovia, IN 46157
$-108
Cash flow
-1.7%
Cash-on-Cash Return
5.7%
Cap rate
0.7%
Rent to Value Ratio
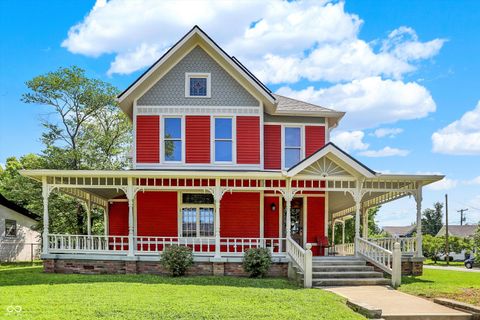
Active
$675,000
4
bds
|
4
ba
|
3,177
sqft
|
built
1865
189 S Jefferson St, Martinsville, IN 46151
$-1,319
Cash flow
-10.2%
Cash-on-Cash Return
3.8%
Cap rate
0.5%
Rent to Value Ratio

Active
$919,900
5
bds
|
4
ba
|
3,713
sqft
|
built
1983
2001 E Ely Ct, Martinsville, IN 46151
$-2,652
Cash flow
-15.0%
Cash-on-Cash Return
2.7%
Cap rate
0.3%
Rent to Value Ratio
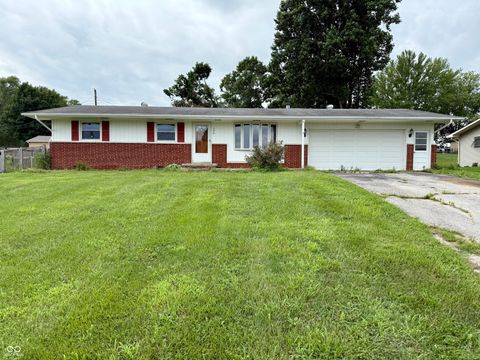
Active
$228,000
3
bds
|
2
ba
|
1,534
sqft
|
built
1959
190 County Line Rd, Morgantown, IN 46160
$-64
Cash flow
-1.5%
Cash-on-Cash Return
5.8%
Cap rate
0.7%
Rent to Value Ratio
Active
$289,900
3
bds
|
3
ba
|
1,755
sqft
|
built
1981
7135 N Lower Lake Dr, Martinsville, IN 46151
$-536
Cash flow
-9.6%
Cash-on-Cash Return
3.9%
Cap rate
0.5%
Rent to Value Ratio
Active
$525,000
4
bds
|
2
ba
|
3,008
sqft
|
built
1964
589 Valley Dr, Martinsville, IN 46151
$-1,171
Cash flow
-11.6%
Cash-on-Cash Return
3.5%
Cap rate
0.4%
Rent to Value Ratio

Active
$429,900
4
bds
|
3
ba
|
2,568
sqft
|
built
1998
8245 Henderson Ridge Dr, Mooresville, IN 46158
$-408
Cash flow
-5.0%
Cash-on-Cash Return
5.0%
Cap rate
0.6%
Rent to Value Ratio
Active
$250,000
3
bds
|
1
ba
|
1,176
sqft
|
built
1959
207 Center Dr, Mooresville, IN 46158
$-177
Cash flow
-3.7%
Cash-on-Cash Return
5.3%
Cap rate
0.6%
Rent to Value Ratio

Active
$179,999
3
bds
|
1
ba
|
1,349
sqft
|
built
1955
339 E Morris St, Martinsville, IN 46151
$44
Cash flow
1.3%
Cash-on-Cash Return
6.4%
Cap rate
0.8%
Rent to Value Ratio
Active
$210,000
3
bds
|
2
ba
|
1,188
sqft
|
built
1930
839 S Grant St, Martinsville, IN 46151
$166
Cash flow
4.1%
Cash-on-Cash Return
7.1%
Cap rate
0.9%
Rent to Value Ratio
Active
$625,000
3
bds
|
3
ba
|
2,585
sqft
|
built
1970
1927 E Derby Ct, Martinsville, IN 46151
$-1,830
Cash flow
-15.3%
Cash-on-Cash Return
2.6%
Cap rate
0.4%
Rent to Value Ratio
Active
$899,900
5
bds
|
2
ba
|
3,180
sqft
|
built
1979
1155 Cope Rd, Martinsville, IN 46151
$-1,919
Cash flow
-11.1%
Cash-on-Cash Return
3.6%
Cap rate
0.4%
Rent to Value Ratio
Active
$330,000
2
bds
|
2
ba
|
2,026
sqft
|
built
1967
5850 Paradise Ln, Martinsville, IN 46151
$-215
Cash flow
-3.4%
Cash-on-Cash Return
5.4%
Cap rate
0.7%
Rent to Value Ratio
Active
$210,000
3
bds
|
1
ba
|
1,098
sqft
|
built
1947
321 Maple Ln, Mooresville, IN 46158
$-28
Cash flow
-0.7%
Cash-on-Cash Return
5.5%
Cap rate
0.7%
Rent to Value Ratio