Owen County Investment Properties for Sale
Browse homes for sale and investment properties in Owen County. Refine your search by price, property type, or more.
Best cash flowing properties in Owen County
Active
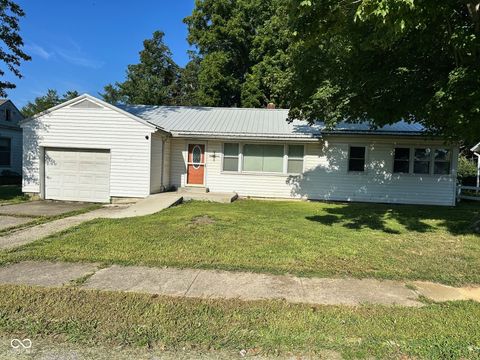
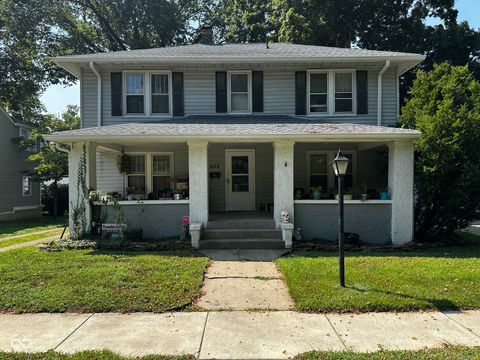
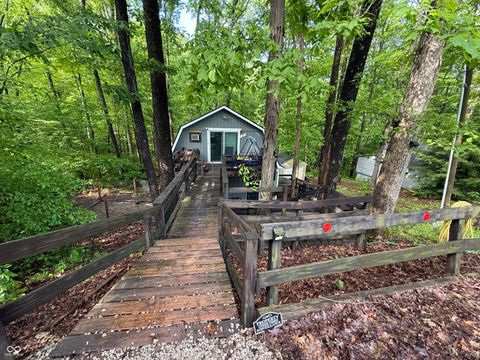
$117,500
2
bds
|
1
ba
|
1,392
sqft
|
built
1958
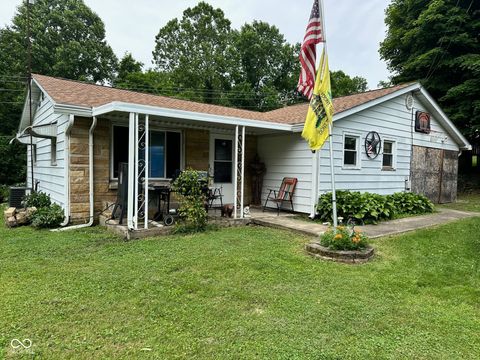
243 S 5th St, Gosport, IN 47433
$364
Cash flow
16.2%
Cash-on-Cash Return
9.9%
Cap rate
1.2%
Rent to Value Ratio
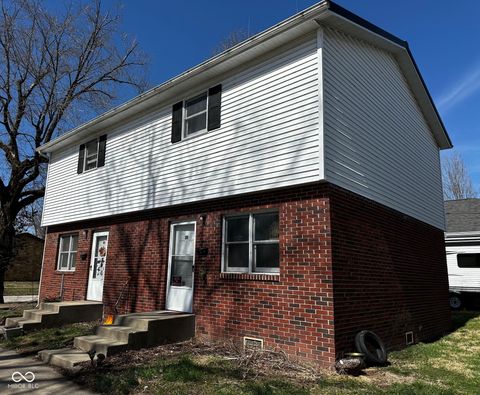
Active
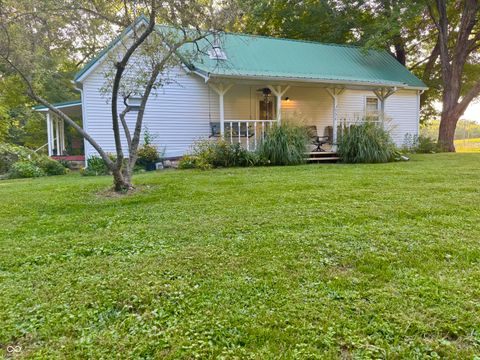
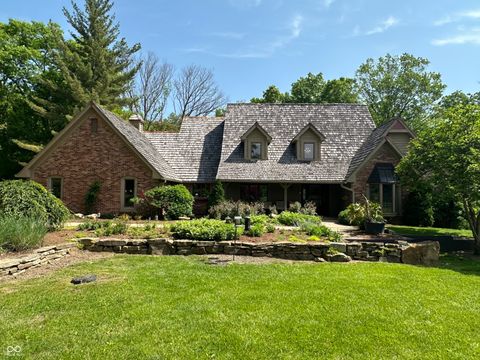
$153,000
1
bds
|
1
ba
|
951
sqft
|
built
1960
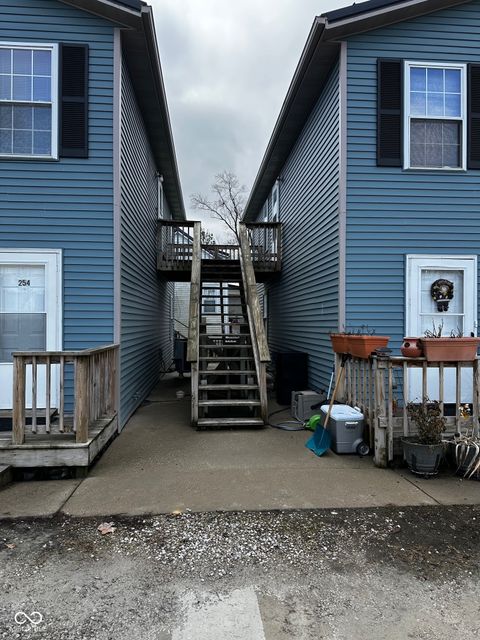
1536 River Rd, Spencer, IN 47460
$320
Cash flow
10.9%
Cash-on-Cash Return
8.7%
Cap rate
1.0%
Rent to Value Ratio
22 out of 29 properties for sale in Owen County
Limited Results Shown
Create a free account, or log in to reveal all property listings and enjoy the complete experience.
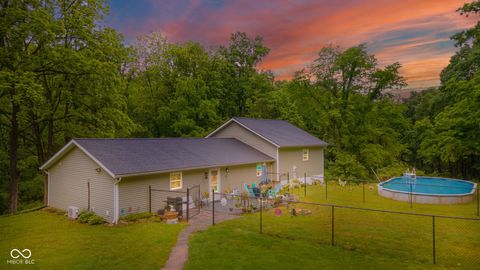
Active
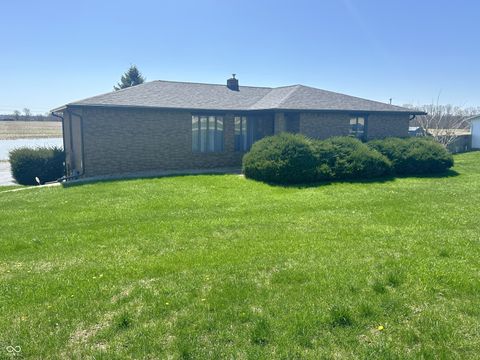
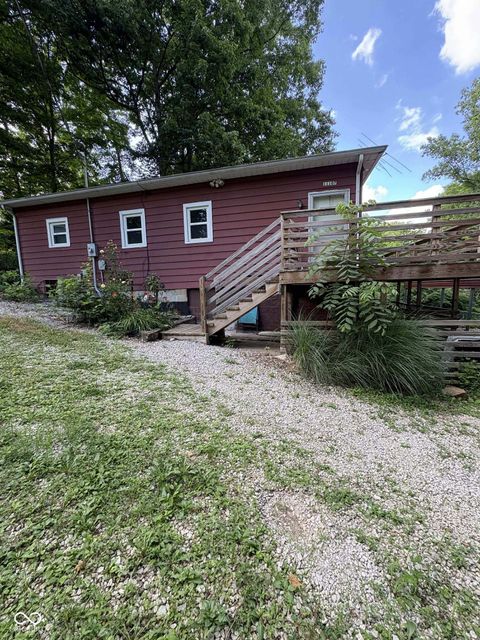
$374,900
4
bds
|
3
ba
|
3,502
sqft
|
built
1986
45 Flatwoods Rd, Spencer, IN 47460
$219
Cash flow
3.0%
Cash-on-Cash Return
6.8%
Cap rate
0.8%
Rent to Value Ratio
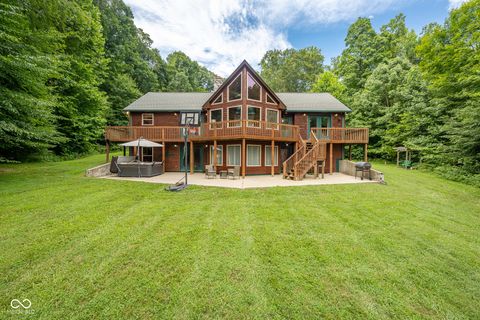
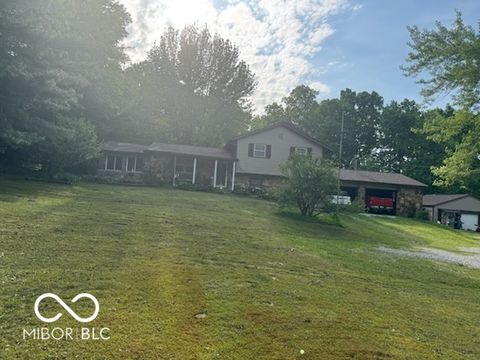
Active
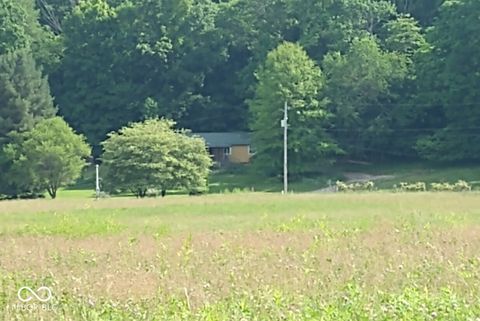
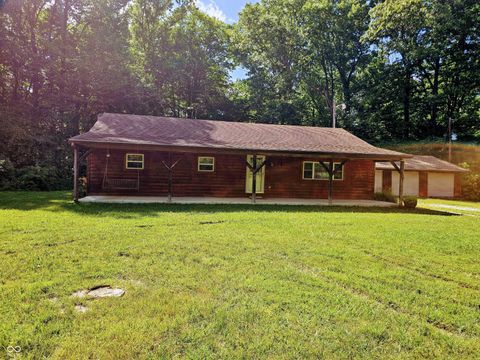
$280,000
2
bds
|
1
ba
|
1,366
sqft
|
built
1980
4775 E Romona Rd, Gosport, IN 47433
$-330
Cash flow
-6.1%
Cash-on-Cash Return
4.7%
Cap rate
0.6%
Rent to Value Ratio
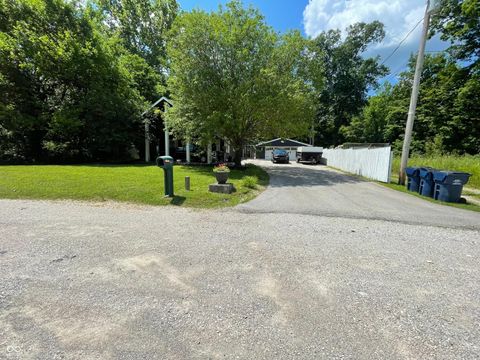
Active
$239,900
4
bds
|
2
ba
|
1,728
sqft
|
built
1950
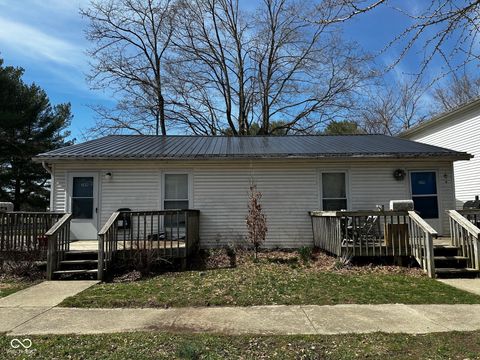
456 W Hillside Ave, Spencer, IN 47460
$-125
Cash flow
-2.7%
Cash-on-Cash Return
5.5%
Cap rate
0.7%
Rent to Value Ratio
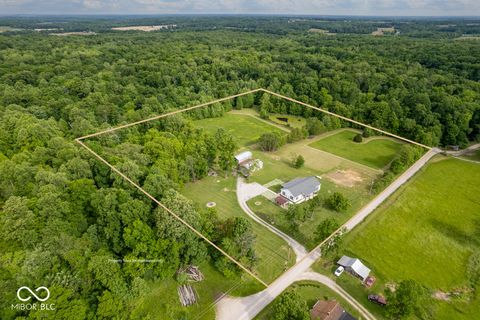
Active
$385,000
4
bds
|
2
ba
|
1,780
sqft
|
built
1950
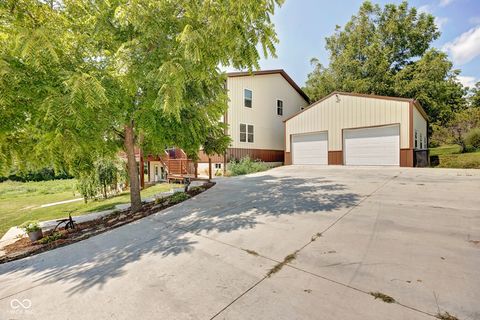
2134 N County Line Rd E, Gosport, IN 47433
$-385
Cash flow
-5.2%
Cash-on-Cash Return
4.9%
Cap rate
0.6%
Rent to Value Ratio
Active
$599,999
4
bds
|
3
ba
|
3,332
sqft
|
built
2007
5941 Jordan Village Rd, Poland, IN 47868
$-1,141
Cash flow
-9.9%
Cash-on-Cash Return
3.9%
Cap rate
0.5%
Rent to Value Ratio
Active
$399,900
5
bds
|
3
ba
|
3,321
sqft
|
built
1940
1446 W State Highway 46, Spencer, IN 47460
$-47
Cash flow
-0.6%
Cash-on-Cash Return
6.0%
Cap rate
0.7%
Rent to Value Ratio
Active
$725,000
6
bds
|
4
ba
|
3,264
sqft
|
built
2014
7863 Moore Rd, Gosport, IN 47433
$-954
Cash flow
-6.9%
Cash-on-Cash Return
4.6%
Cap rate
0.6%
Rent to Value Ratio
Active
$409,900
bds
|
0
ba
|
0
sqft
|
built
1994
169 Sycamore St, Spencer, IN 47460
$-858
Cash flow
-10.9%
Cash-on-Cash Return
3.6%
Cap rate
0.4%
Rent to Value Ratio
Active
$1,150,000
bds
|
0
ba
|
0
sqft
|
built
1995
135 W Wayne St, Spencer, IN 47460
$-4,994
Cash flow
-22.7%
Cash-on-Cash Return
0.9%
Cap rate
0.1%
Rent to Value Ratio
Active
$129,900
3
bds
|
1
ba
|
928
sqft
|
built
1935
1165 Freeman Rd, Spencer, IN 47460
$301
Cash flow
12.1%
Cash-on-Cash Return
8.9%
Cap rate
1.1%
Rent to Value Ratio
Active
$409,900
bds
|
0
ba
|
0
sqft
|
built
1991
101 E Wayne St, Spencer, IN 47460
$-1,134
Cash flow
-14.4%
Cash-on-Cash Return
2.8%
Cap rate
0.3%
Rent to Value Ratio
Active
$445,000
4
bds
|
2
ba
|
2,054
sqft
|
built
1985
4005 Texas Pike, Spencer, IN 47460
$-900
Cash flow
-10.6%
Cash-on-Cash Return
3.7%
Cap rate
0.4%
Rent to Value Ratio
Active
$489,000
4
bds
|
2
ba
|
1,920
sqft
|
built
2023
3401 Mitten Rd, Bowling Green, IN 47833
$-1,263
Cash flow
-13.5%
Cash-on-Cash Return
3.0%
Cap rate
0.4%
Rent to Value Ratio

Active
$429,900
3
bds
|
2
ba
|
1,404
sqft
|
built
1978
3320 Pine Wood Dr, Spencer, IN 47460
$-822
Cash flow
-10.0%
Cash-on-Cash Return
3.9%
Cap rate
0.5%
Rent to Value Ratio
Active
$420,500
2
bds
|
2
ba
|
2,260
sqft
|
built
1955
681 Hancock School Rd, Spencer, IN 47460
$-636
Cash flow
-7.9%
Cash-on-Cash Return
4.3%
Cap rate
0.5%
Rent to Value Ratio
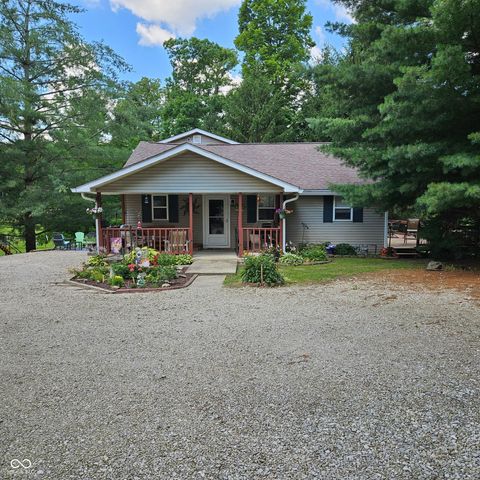
Active
$215,000
3
bds
|
2
ba
|
1,984
sqft
|
built
1993
11213 Oak Grove Church Rd, Poland, IN 47868
$141
Cash flow
3.4%
Cash-on-Cash Return
6.9%
Cap rate
0.8%
Rent to Value Ratio
Active
$2,750,000
5
bds
|
6
ba
|
5,392
sqft
|
built
1986
2034 Dubois Rd, Spencer, IN 47460
$-12,086
Cash flow
-22.9%
Cash-on-Cash Return
0.9%
Cap rate
0.1%
Rent to Value Ratio
Active
$169,500
2
bds
|
1
ba
|
1,143
sqft
|
built
1950
11107 Dogwood Ln, Cloverdale, IN 46120
$62
Cash flow
1.9%
Cash-on-Cash Return
6.6%
Cap rate
0.8%
Rent to Value Ratio
Active
$315,500
3
bds
|
2
ba
|
1,692
sqft
|
built
1969
12151 Gaddis Ln, Cloverdale, IN 46120
$-512
Cash flow
-8.5%
Cash-on-Cash Return
4.2%
Cap rate
0.5%
Rent to Value Ratio
Active
$539,900
4
bds
|
3
ba
|
3,902
sqft
|
built
1997
5626 Jones Rd, Gosport, IN 47433
$-765
Cash flow
-7.4%
Cash-on-Cash Return
4.4%
Cap rate
0.5%
Rent to Value Ratio