Shelby County Investment Properties for Sale
Browse homes for sale and investment properties in Shelby County. Refine your search by price, property type, or more.
Best cash flowing properties in Shelby County
Active
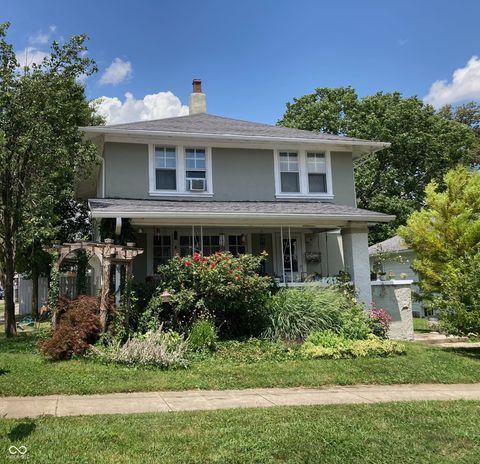
$39,900
1
bds
|
1
ba
|
700
sqft
|
built
1910
347 E Mechanic St, Shelbyville, IN 46176
$621
Cash flow
18.1%
Cash-on-Cash Return
18.7%
Cap rate
2.3%
Rent to Value Ratio
Active
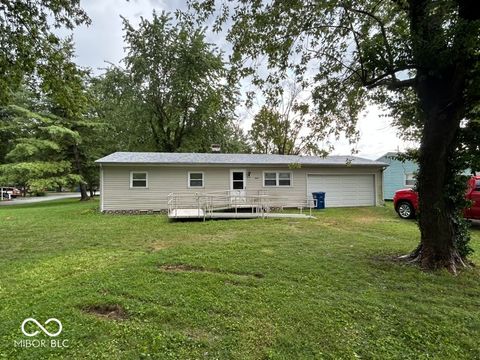
$84,500
4
bds
|
1
ba
|
1,152
sqft
|
built
1940
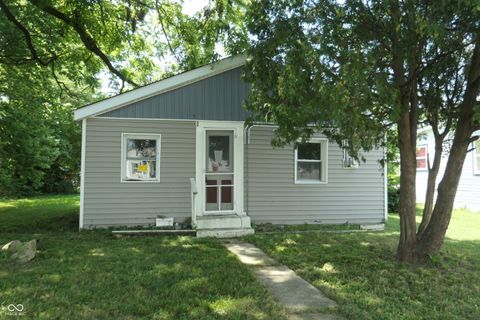
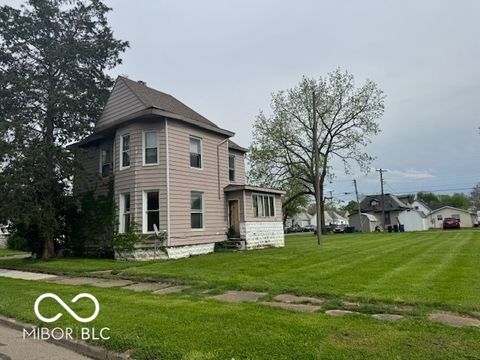
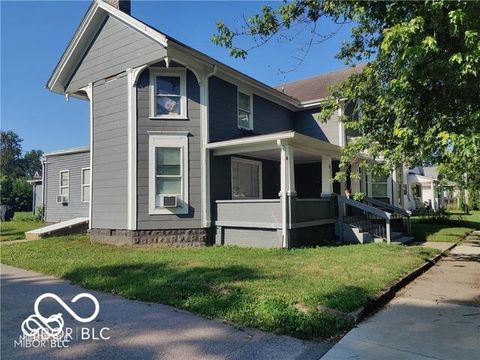
755 2nd St, Shelbyville, IN 46176
$464
Cash flow
28.6%
Cash-on-Cash Return
12.7%
Cap rate
1.5%
Rent to Value Ratio
56 out of 63 properties for sale in Shelby County
Limited Results Shown
Create a free account, or log in to reveal all property listings and enjoy the complete experience.
Active
$237,500
3
bds
|
2
ba
|
2,147
sqft
|
built
1935
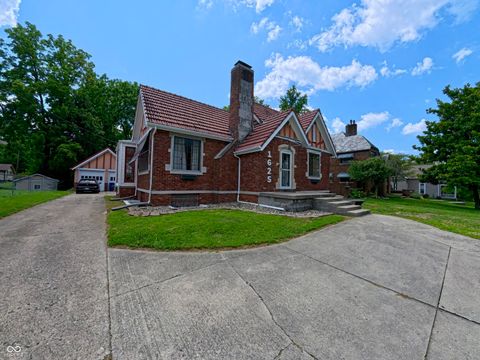
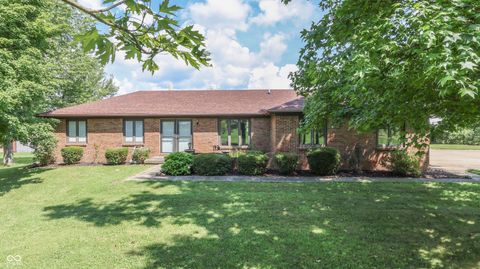
1625 S Riley Hwy, Shelbyville, IN 46176
$163
Cash flow
3.6%
Cash-on-Cash Return
7.0%
Cap rate
0.8%
Rent to Value Ratio

Active
$235,000
3
bds
|
2
ba
|
1,666
sqft
|
built
1940
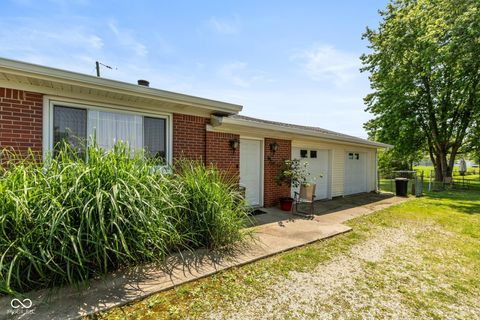
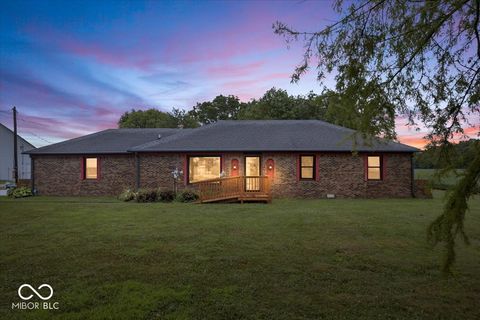
6982 E Michigan Rd, Waldron, IN 46182
$-100
Cash flow
-2.2%
Cash-on-Cash Return
5.6%
Cap rate
0.7%
Rent to Value Ratio
Active
$270,000
4
bds
|
3
ba
|
3,401
sqft
|
built
2008
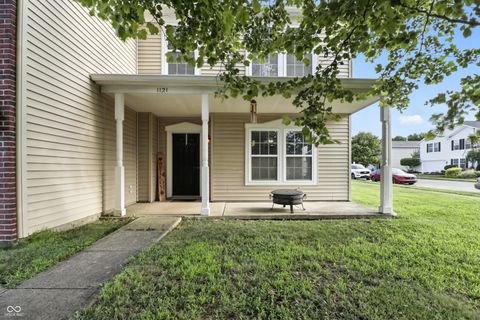
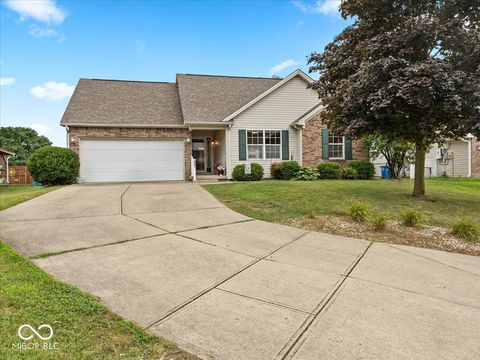
1121 Central Park Dr, Shelbyville, IN 46176
$-21
Cash flow
-0.4%
Cash-on-Cash Return
6.1%
Cap rate
0.7%
Rent to Value Ratio
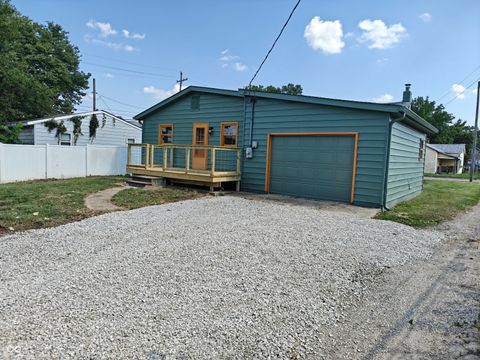
Active
$230,000
2
bds
|
1
ba
|
992
sqft
|
built
1927
3179 W 400 N, Fairland, IN 46126
$-74
Cash flow
-1.7%
Cash-on-Cash Return
5.8%
Cap rate
0.7%
Rent to Value Ratio
Active
$299,000
4
bds
|
3
ba
|
2,472
sqft
|
built
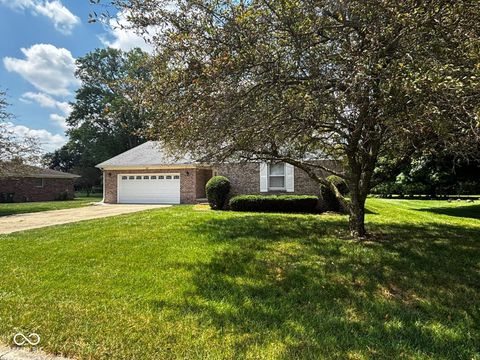
1993
922 Eagle Brook Dr, Shelbyville, IN 46176
$-359
Cash flow
-6.3%
Cash-on-Cash Return
4.7%
Cap rate
0.6%
Rent to Value Ratio
Active
$269,000
2
bds
|
2
ba
|
1,176
sqft
|
built
1968
1598 S Thompson Rd, Shelbyville, IN 46176
$-274
Cash flow
-5.3%
Cash-on-Cash Return
4.9%
Cap rate
0.6%
Rent to Value Ratio
Active
$330,000
0
bds
|
0
ba
|
0
sqft
|
built
1890
40 E Mechanic St, Shelbyville, IN 46176
$-1,000
Cash flow
-15.8%
Cash-on-Cash Return
2.5%
Cap rate
0.3%
Rent to Value Ratio
Active
$234,900
3
bds
|
2
ba
|
1,135
sqft
|
built
2003
2007 Augusta Ct, Shelbyville, IN 46176
$-103
Cash flow
-2.3%
Cash-on-Cash Return
5.6%
Cap rate
0.7%
Rent to Value Ratio
Active
$199,900
3
bds
|
2
ba
|
1,903
sqft
|
built
1940
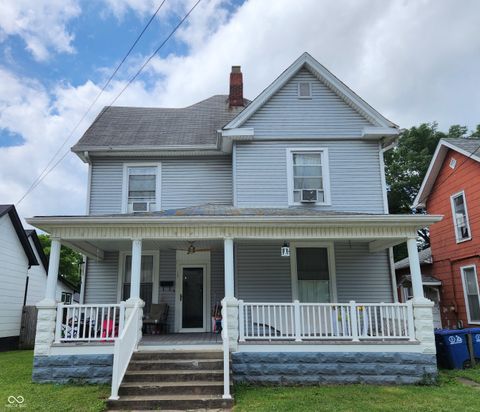
316 E Mechanic St, Shelbyville, IN 46176
$-127
Cash flow
-3.3%
Cash-on-Cash Return
5.4%
Cap rate
0.7%
Rent to Value Ratio
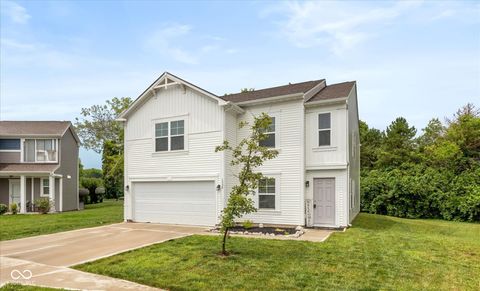
Active
$310,000
3
bds
|
3
ba
|
2,922
sqft
|
built
2021
1338 Delacorte Cir, Shelbyville, IN 46176
$-70
Cash flow
-1.2%
Cash-on-Cash Return
5.9%
Cap rate
0.7%
Rent to Value Ratio
Active
$292,000
3
bds
|
3
ba
|
1,827
sqft
|
built
1991
321 S Locust Dr, Morristown, IN 46161
$-116
Cash flow
-2.1%
Cash-on-Cash Return
5.7%
Cap rate
0.7%
Rent to Value Ratio
Active
$239,980
4
bds
|
3
ba
|
2,152
sqft
|
built
2005
854 Saraina Rd, Shelbyville, IN 46176
$-5
Cash flow
-0.1%
Cash-on-Cash Return
6.1%
Cap rate
0.8%
Rent to Value Ratio

Active
$299,000
3
bds
|
2
ba
|
1,344
sqft
|
built
1965
8990 N 850 W, Fairland, IN 46126
$-359
Cash flow
-6.3%
Cash-on-Cash Return
4.7%
Cap rate
0.6%
Rent to Value Ratio
Active
$340,000
4
bds
|
2
ba
|
1,540
sqft
|
built
1960
3348 W 800 N, Fairland, IN 46126
$-845
Cash flow
-13.0%
Cash-on-Cash Return
3.2%
Cap rate
0.4%
Rent to Value Ratio
Active
$239,990
3
bds
|
2
ba
|
1,150
sqft
|
built
2008
311 Fox Ridge Ct, Shelbyville, IN 46176
$-125
Cash flow
-2.7%
Cash-on-Cash Return
5.5%
Cap rate
0.7%
Rent to Value Ratio
Active
$240,000
2
bds
|
1
ba
|
1,472
sqft
|
built
1930
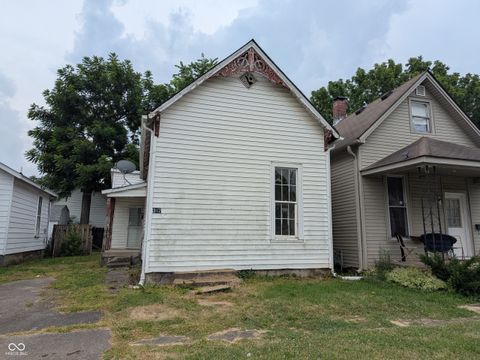
1121 W Washington Ave, Shelbyville, IN 46176
$-125
Cash flow
-2.7%
Cash-on-Cash Return
5.5%
Cap rate
0.7%
Rent to Value Ratio
Active
$225,000
4
bds
|
3
ba
|
2,416
sqft
|
built
1939
15 N Miller St, Shelbyville, IN 46176
$227
Cash flow
5.3%
Cash-on-Cash Return
7.4%
Cap rate
0.9%
Rent to Value Ratio
Active
$550,000
4
bds
|
3
ba
|
2,378
sqft
|
built
1974
7896 W 800 N, Fairland, IN 46126
$-1,299
Cash flow
-12.3%
Cash-on-Cash Return
3.3%
Cap rate
0.4%
Rent to Value Ratio
Active
$115,000
2
bds
|
0
ba
|
0
sqft
|
built
1915
123 Conrey St, Shelbyville, IN 46176
$170
Cash flow
7.7%
Cash-on-Cash Return
7.9%
Cap rate
1.0%
Rent to Value Ratio
Active
$230,000
3
bds
|
1
ba
|
1,392
sqft
|
built
1962
5719 N Frontage Rd, Fairland, IN 46126
$-74
Cash flow
-1.7%
Cash-on-Cash Return
5.8%
Cap rate
0.7%
Rent to Value Ratio
Active
$225,000
3
bds
|
2
ba
|
1,274
sqft
|
built
1968
1460 W Mc Kay Rd, Shelbyville, IN 46176
$20
Cash flow
0.5%
Cash-on-Cash Return
6.3%
Cap rate
0.8%
Rent to Value Ratio
Active
$419,900
4
bds
|
3
ba
|
3,631
sqft
|
built
2022
1305 Bontrager Ln, Shelbyville, IN 46176
$-451
Cash flow
-5.6%
Cash-on-Cash Return
4.9%
Cap rate
0.6%
Rent to Value Ratio
Active
$109,900
1
bds
|
1
ba
|
738
sqft
|
built
1964
931 W Mc Kay Rd, Shelbyville, IN 46176
$-166
Cash flow
-7.9%
Cash-on-Cash Return
4.3%
Cap rate
0.7%
Rent to Value Ratio
Active
$364,800
3
bds
|
3
ba
|
1,920
sqft
|
built
1974
2900 N Michigan Rd, Shelbyville, IN 46176
$-489
Cash flow
-7.0%
Cash-on-Cash Return
4.5%
Cap rate
0.5%
Rent to Value Ratio
Active
$418,000
3
bds
|
2
ba
|
1,994
sqft
|
built
1983
11546 N Shelby 300 W, New Palestine, IN 46163
$-554
Cash flow
-6.9%
Cash-on-Cash Return
4.6%
Cap rate
0.6%
Rent to Value Ratio
Active
$220,000
3
bds
|
2
ba
|
2,560
sqft
|
built
1910
11368 S Main St, Flat Rock, IN 47234
$-23
Cash flow
-0.5%
Cash-on-Cash Return
6.0%
Cap rate
0.7%
Rent to Value Ratio
Active
$324,900
1
bds
|
0
ba
|
0
sqft
|
built
1876
617 W Franklin St, Shelbyville, IN 46176
$-1,043
Cash flow
-16.7%
Cash-on-Cash Return
2.3%
Cap rate
0.3%
Rent to Value Ratio
Active
$354,900
3
bds
|
2
ba
|
2,695
sqft
|
built
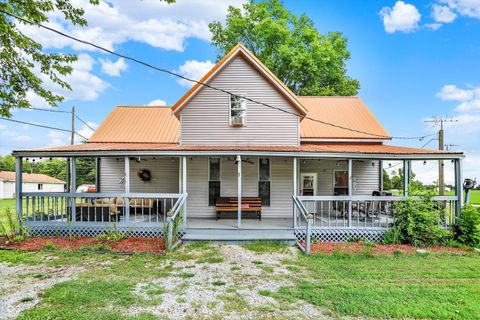
1956
504 S Main St, Waldron, IN 46182
$-645
Cash flow
-9.5%
Cash-on-Cash Return
4.0%
Cap rate
0.5%
Rent to Value Ratio
Active
$179,900
4
bds
|
2
ba
|
1,905
sqft
|
built
1954
1019 E Jackson St, Shelbyville, IN 46176
$44
Cash flow
1.3%
Cash-on-Cash Return
6.4%
Cap rate
0.8%
Rent to Value Ratio
Active
$499,900
4
bds
|
3
ba
|
2,349
sqft
|
built
1992
2413 Griton Ct, Shelbyville, IN 46176
$-383
Cash flow
-4.0%
Cash-on-Cash Return
5.2%
Cap rate
0.6%
Rent to Value Ratio
Active
$164,900
3
bds
|
1
ba
|
1,080
sqft
|
built
1920
1315 Meridian St, Shelbyville, IN 46176
$259
Cash flow
8.2%
Cash-on-Cash Return
8.0%
Cap rate
1.0%
Rent to Value Ratio
Active
$219,995
2
bds
|
2
ba
|
1,654
sqft
|
built
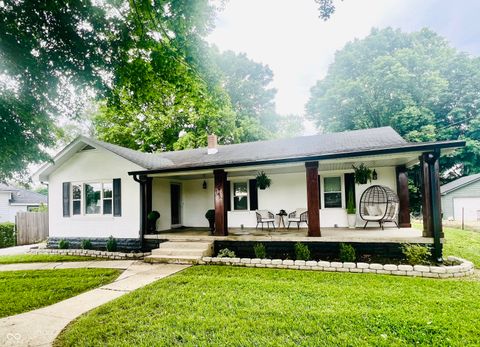
1950
1103 Fairfield Dr, Shelbyville, IN 46176
$-23
Cash flow
-0.5%
Cash-on-Cash Return
6.0%
Cap rate
0.7%
Rent to Value Ratio
Active
$399,900
5
bds
|
3
ba
|
2,832
sqft
|
built
1970
5081 N 500 W, Fairland, IN 46126
$-530
Cash flow
-6.9%
Cash-on-Cash Return
4.6%
Cap rate
0.6%
Rent to Value Ratio
Active
$319,000
4
bds
|
3
ba
|
2,463
sqft
|
built
2023
1435 Buttercup Ln, Shelbyville, IN 46176
$-154
Cash flow
-2.5%
Cash-on-Cash Return
5.6%
Cap rate
0.7%
Rent to Value Ratio
Active
$174,900
4
bds
|
1
ba
|
1,056
sqft
|
built
1959
609 Willow Dr, Shelbyville, IN 46176
$70
Cash flow
2.1%
Cash-on-Cash Return
6.6%
Cap rate
0.8%
Rent to Value Ratio
Active
$2,400,000
5
bds
|
5
ba
|
10,350
sqft
|
built
1996
3917 N 525 W, Fairland, IN 46126
$-8,913
Cash flow
-19.4%
Cash-on-Cash Return
1.7%
Cap rate
0.2%
Rent to Value Ratio
Active
$226,000
3
bds
|
2
ba
|
2,641
sqft
|
built
1900
430 W Locust St, Shelbyville, IN 46176
$15
Cash flow
0.3%
Cash-on-Cash Return
6.2%
Cap rate
0.8%
Rent to Value Ratio
Active
$119,900
3
bds
|
1
ba
|
864
sqft
|
built
1958
1688 Cardinal Ln, Shelbyville, IN 46176
$283
Cash flow
12.3%
Cash-on-Cash Return
9.0%
Cap rate
1.1%
Rent to Value Ratio