Indianapolis, IN Investment Properties for Sale
Browse homes for sale and investment properties in Indianapolis, IN. Refine your search by price, property type, or more.
Best cash flowing properties in Indianapolis, IN
Active
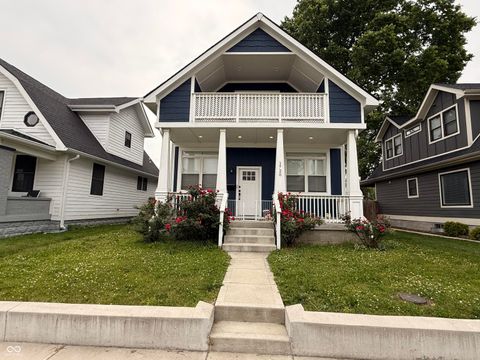
$324,900
3
bds
|
2
ba
|
1,776
sqft
|
built
2020
1720 Rembrandt St, Indianapolis, IN 46202
$512
Cash flow
8.2%
Cash-on-Cash Return
8.2%
Cap rate
1.0%
Rent to Value Ratio
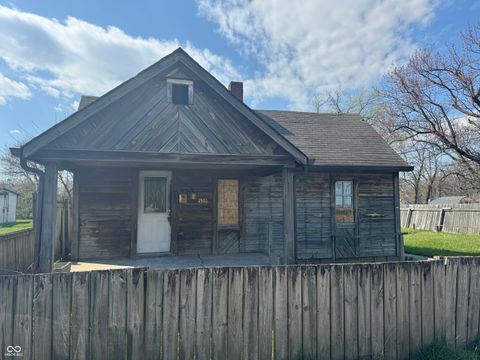
Active
$155,000
4
bds
|
2
ba
|
1,742
sqft
|
built
1900
1211 W 30th St, Indianapolis, IN 46208
$295
Cash flow
9.9%
Cash-on-Cash Return
8.5%
Cap rate
1.0%
Rent to Value Ratio
2,139 out of 2,296 properties for sale in Indianapolis, IN
Limited Results Shown
Create a free account, or log in to reveal all property listings and enjoy the complete experience.
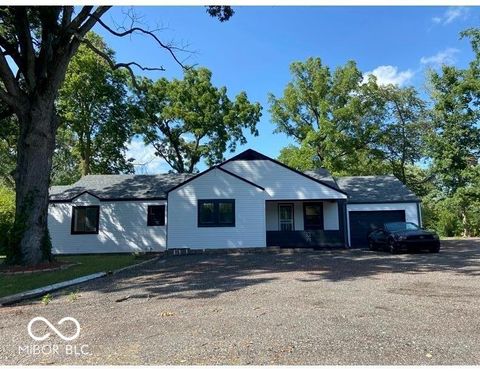
Active
$199,000
2
bds
|
1
ba
|
1,546
sqft
|
built
1948
3025 S Keystone Ave, Indianapolis, IN 46237
$-73
Cash flow
-1.9%
Cash-on-Cash Return
5.8%
Cap rate
0.7%
Rent to Value Ratio
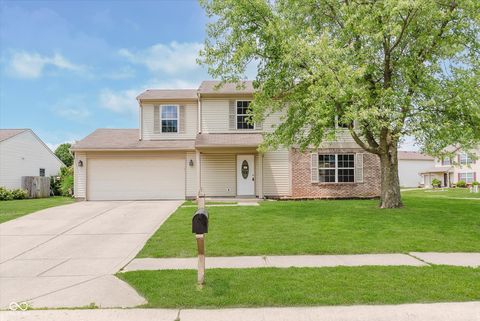
Active
$186,000
2
bds
|
1
ba
|
672
sqft
|
built
1949
1237 E Pleasant Run Parkway South Dr, Indianapolis, IN 46203
$-5
Cash flow
-0.1%
Cash-on-Cash Return
6.2%
Cap rate
0.8%
Rent to Value Ratio

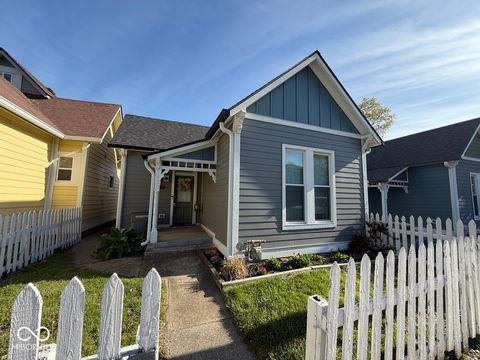
Active
$159,900
2
bds
|
2
ba
|
1,234
sqft
|
built
1985
9452 Maple Way, Indianapolis, IN 46268
$53
Cash flow
1.7%
Cash-on-Cash Return
6.7%
Cap rate
1.1%
Rent to Value Ratio

Active
$429,000
5
bds
|
4
ba
|
3,816
sqft
|
built
1994
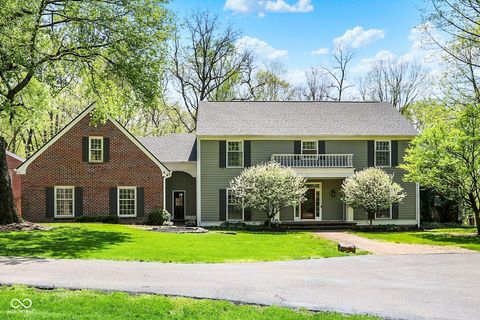
4719 Arabian Run, Indianapolis, IN 46228
$-126
Cash flow
-1.5%
Cash-on-Cash Return
5.9%
Cap rate
0.7%
Rent to Value Ratio
Active
$134,900
2
bds
|
1
ba
|
866
sqft
|
built
1910
1520 N Bancroft St, Indianapolis, IN 46201
$55
Cash flow
2.1%
Cash-on-Cash Return
6.8%
Cap rate
0.8%
Rent to Value Ratio
Active
$214,000
3
bds
|
2
ba
|
1,728
sqft
|
built
1948
8560 E 38th St, Indianapolis, IN 46226
$125
Cash flow
3.0%
Cash-on-Cash Return
7.0%
Cap rate
0.8%
Rent to Value Ratio
Active
$269,900
4
bds
|
3
ba
|
1,830
sqft
|
built
1997
6320 River Valley Way, Indianapolis, IN 46221
$-185
Cash flow
-3.6%
Cash-on-Cash Return
5.4%
Cap rate
0.7%
Rent to Value Ratio
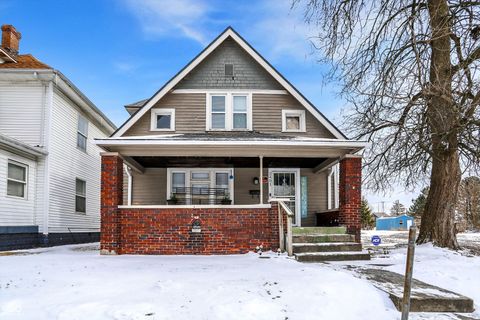
Active
$155,000
4
bds
|
2
ba
|
1,742
sqft
|
built
1900
1211 W 30th St, Indianapolis, IN 46208
$295
Cash flow
9.9%
Cash-on-Cash Return
8.5%
Cap rate
1.0%
Rent to Value Ratio
Active
$249,900
2
bds
|
1
ba
|
724
sqft
|
built
1890
630 E Mc Carty St, Indianapolis, IN 46203
$-201
Cash flow
-4.2%
Cash-on-Cash Return
5.3%
Cap rate
0.6%
Rent to Value Ratio
Active
$369,999
3
bds
|
3
ba
|
3,161
sqft
|
built
2006
6730 Shanghai Cir, Indianapolis, IN 46278
$-345
Cash flow
-4.9%
Cash-on-Cash Return
5.1%
Cap rate
0.6%
Rent to Value Ratio

Active
$369,000
3
bds
|
4
ba
|
3,326
sqft
|
built
1956
614 Debra Ln, Indianapolis, IN 46217
$-822
Cash flow
-11.6%
Cash-on-Cash Return
3.6%
Cap rate
0.4%
Rent to Value Ratio
Active
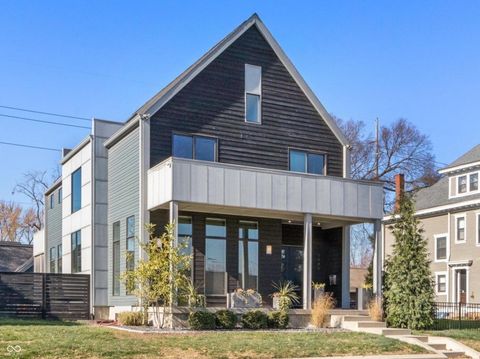
$1,075,000
5
bds
|
4
ba
|
4,344
sqft
|
built
2015
1948 Central Ave, Indianapolis, IN 46202
$-1,679
Cash flow
-8.1%
Cash-on-Cash Return
4.4%
Cap rate
0.5%
Rent to Value Ratio
Active
$375,000
4
bds
|
3
ba
|
2,869
sqft
|
built
2004
7322 Stones River Dr, Indianapolis, IN 46259
$-197
Cash flow
-2.7%
Cash-on-Cash Return
5.6%
Cap rate
0.7%
Rent to Value Ratio
Active
$138,000
2
bds
|
1
ba
|
1,492
sqft
|
built
1917
2401 N Olney St, Indianapolis, IN 46218
$246
Cash flow
9.3%
Cash-on-Cash Return
8.4%
Cap rate
1.0%
Rent to Value Ratio
Active
$2,000,000
4
bds
|
6
ba
|
6,016
sqft
|
built
1978
8820 Mud Creek Rd, Indianapolis, IN 46256
$-6,646
Cash flow
-17.3%
Cash-on-Cash Return
2.3%
Cap rate
0.3%
Rent to Value Ratio
Active
$240,000
4
bds
|
2
ba
|
1,473
sqft
|
built
1966
8445 Montery Rd, Indianapolis, IN 46226
$-218
Cash flow
-4.7%
Cash-on-Cash Return
5.2%
Cap rate
0.6%
Rent to Value Ratio
Active
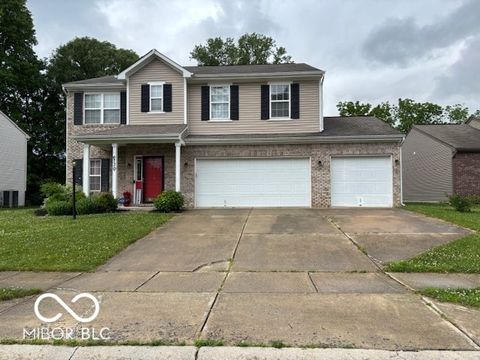
$324,900
3
bds
|
2
ba
|
1,776
sqft
|
built
2020
1720 Rembrandt St, Indianapolis, IN 46202
$512
Cash flow
8.2%
Cash-on-Cash Return
8.2%
Cap rate
1.0%
Rent to Value Ratio

Active
$345,000
3
bds
|
2
ba
|
1,314
sqft
|
built
1988
3404 Maritime Dr, Indianapolis, IN 46214
$-594
Cash flow
-9.0%
Cash-on-Cash Return
4.2%
Cap rate
0.5%
Rent to Value Ratio
Active
$339,900
3
bds
|
2
ba
|
1,942
sqft
|
built
1900
1007 Broadway St, Indianapolis, IN 46202
$19
Cash flow
0.3%
Cash-on-Cash Return
6.3%
Cap rate
0.8%
Rent to Value Ratio
Active
$333,000
3
bds
|
3
ba
|
1,764
sqft
|
built
1890
831 Weghorst St, Indianapolis, IN 46203
$-14
Cash flow
-0.2%
Cash-on-Cash Return
6.2%
Cap rate
0.8%
Rent to Value Ratio

Active
$630,000
5
bds
|
5
ba
|
4,686
sqft
|
built
1968
5917 Camelback Ct, Indianapolis, IN 46250
$-1,564
Cash flow
-13.0%
Cash-on-Cash Return
3.3%
Cap rate
0.4%
Rent to Value Ratio
Active
$189,995
4
bds
|
2
ba
|
2,043
sqft
|
built
1930
3102 N Arsenal Ave, Indianapolis, IN 46218
$-95
Cash flow
-2.6%
Cash-on-Cash Return
5.7%
Cap rate
0.7%
Rent to Value Ratio
Active
$409,900
3
bds
|
3
ba
|
2,660
sqft
|
built
1911
406 S Dearborn St, Indianapolis, IN 46201
$-208
Cash flow
-2.6%
Cash-on-Cash Return
5.7%
Cap rate
0.7%
Rent to Value Ratio
Active
$324,900
4
bds
|
3
ba
|
1,750
sqft
|
built
1961
4820 E 70th St, Indianapolis, IN 46220
$-178
Cash flow
-2.9%
Cash-on-Cash Return
5.6%
Cap rate
0.7%
Rent to Value Ratio
Active
$160,000
1
bds
|
2
ba
|
854
sqft
|
built
1907
230 E 9th St, Indianapolis, IN 46204
$-196
Cash flow
-6.4%
Cash-on-Cash Return
4.8%
Cap rate
1.0%
Rent to Value Ratio
Active
$140,000
3
bds
|
2
ba
|
671
sqft
|
built
1920
3035 Graceland Ave, Indianapolis, IN 46208
$97
Cash flow
3.6%
Cash-on-Cash Return
7.1%
Cap rate
0.9%
Rent to Value Ratio
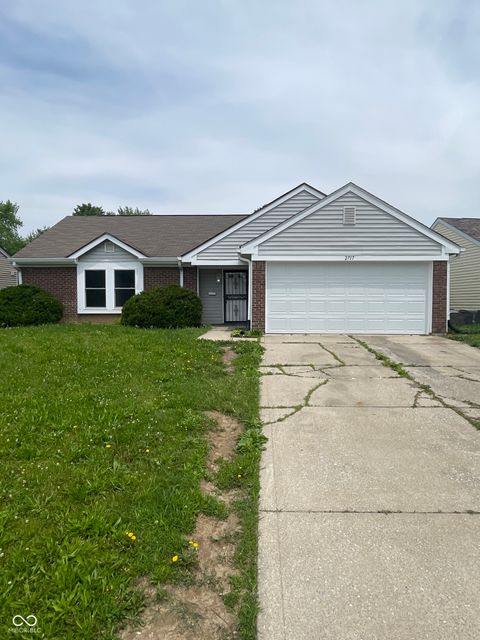
Active
$195,000
3
bds
|
2
ba
|
1,064
sqft
|
built
1994
2717 N Rural St, Indianapolis, IN 46218
$-52
Cash flow
-1.4%
Cash-on-Cash Return
5.9%
Cap rate
0.7%
Rent to Value Ratio
Active
$195,900
2
bds
|
3
ba
|
1,576
sqft
|
built
2004
8160 Shores Edge Way, Indianapolis, IN 46237
$-92
Cash flow
-2.5%
Cash-on-Cash Return
5.7%
Cap rate
0.9%
Rent to Value Ratio
Active
$345,000
4
bds
|
3
ba
|
1,812
sqft
|
built
1989
4736 Rocky Knob Ln, Indianapolis, IN 46254
$-283
Cash flow
-4.3%
Cash-on-Cash Return
5.3%
Cap rate
0.6%
Rent to Value Ratio
Active
$230,000
2
bds
|
2
ba
|
1,232
sqft
|
built
1977
4421 Greenmeadow Ct, Indianapolis, IN 46235
$-97
Cash flow
-2.2%
Cash-on-Cash Return
5.8%
Cap rate
0.7%
Rent to Value Ratio
Active
$749,900
4
bds
|
4
ba
|
4,493
sqft
|
built
1950
6220 Spring Mill Rd, Indianapolis, IN 46260
$-1,431
Cash flow
-10.0%
Cash-on-Cash Return
4.0%
Cap rate
0.5%
Rent to Value Ratio
Active
$549,900
4
bds
|
3
ba
|
2,322
sqft
|
built
1922
4247 Central Ave, Indianapolis, IN 46205
$-732
Cash flow
-6.9%
Cash-on-Cash Return
4.7%
Cap rate
0.6%
Rent to Value Ratio
Active
$495,000
4
bds
|
3
ba
|
2,554
sqft
|
built
1987
6712 Forrest Commons Blvd, Indianapolis, IN 46227
$-840
Cash flow
-8.9%
Cash-on-Cash Return
4.2%
Cap rate
0.5%
Rent to Value Ratio
Active
$324,900
3
bds
|
2
ba
|
1,451
sqft
|
built
1970
7721 Hollybrook Ln, Indianapolis, IN 46227
$-491
Cash flow
-7.9%
Cash-on-Cash Return
4.3%
Cap rate
0.5%
Rent to Value Ratio
Active
$489,000
3
bds
|
4
ba
|
3,064
sqft
|
built
1984
8133 Lower Bay Ln, Indianapolis, IN 46236
$-1,021
Cash flow
-10.9%
Cash-on-Cash Return
3.6%
Cap rate
0.6%
Rent to Value Ratio
Active
$285,000
3
bds
|
3
ba
|
1,687
sqft
|
built
1976
5802 Rymark Ct, Indianapolis, IN 46250
$-84
Cash flow
-1.5%
Cash-on-Cash Return
5.8%
Cap rate
0.7%
Rent to Value Ratio
Active
$344,900
4
bds
|
3
ba
|
2,016
sqft
|
built
1997
6329 Whitaker Farms Dr, Indianapolis, IN 46237
$-404
Cash flow
-6.1%
Cash-on-Cash Return
4.7%
Cap rate
0.6%
Rent to Value Ratio
Active
$240,000
4
bds
|
2
ba
|
2,444
sqft
|
built
1957
2211 Rosedale Dr, Indianapolis, IN 46227
$289
Cash flow
6.3%
Cash-on-Cash Return
7.6%
Cap rate
0.9%
Rent to Value Ratio
Active
$222,000
2
bds
|
2
ba
|
1,297
sqft
|
built
1984
4609 Framington Ct, Indianapolis, IN 46254
$-268
Cash flow
-6.3%
Cash-on-Cash Return
4.7%
Cap rate
0.8%
Rent to Value Ratio
Active
$795,000
4
bds
|
3
ba
|
3,230
sqft
|
built
1953
100 Wellington Rd, Indianapolis, IN 46260
$-1,381
Cash flow
-9.1%
Cash-on-Cash Return
4.1%
Cap rate
0.5%
Rent to Value Ratio