Indianapolis, IN Investment Properties for Sale
Browse homes for sale and investment properties in Indianapolis, IN. Refine your search by price, property type, or more.
Best cash flowing properties in Indianapolis, IN
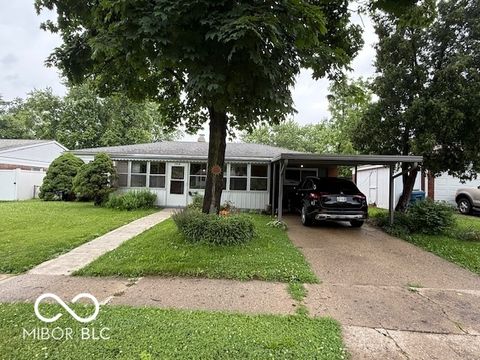
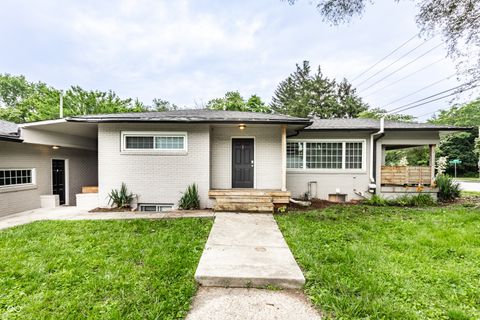
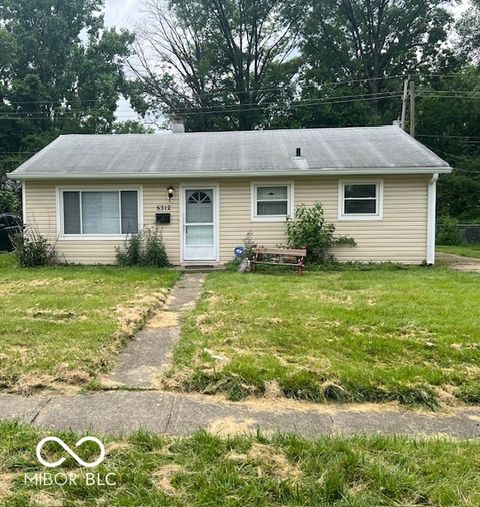
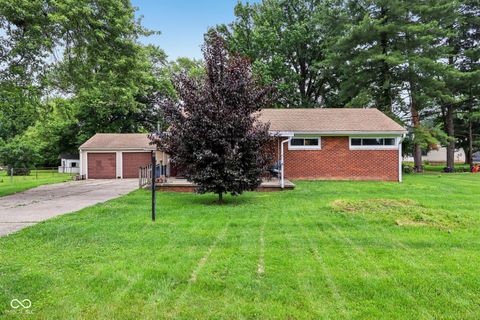
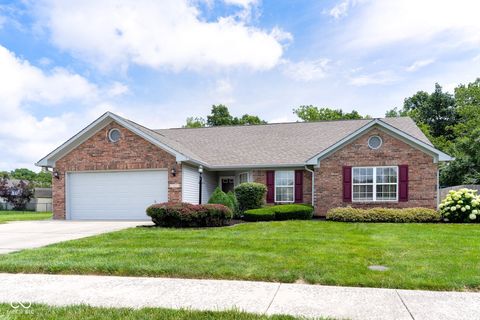
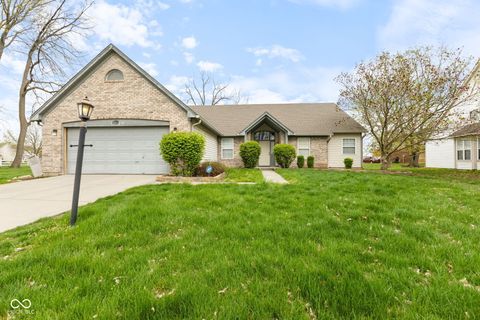
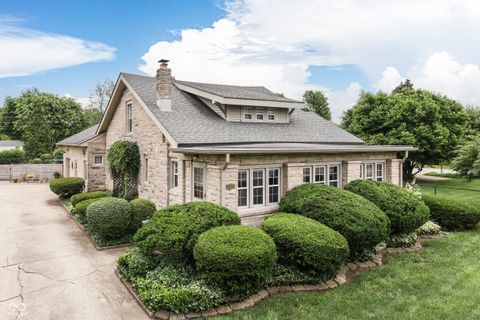
Active
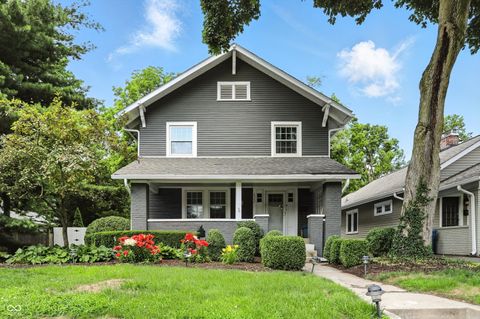
$154,999
3
bds
|
1
ba
|
1,421
sqft
|
built
1959
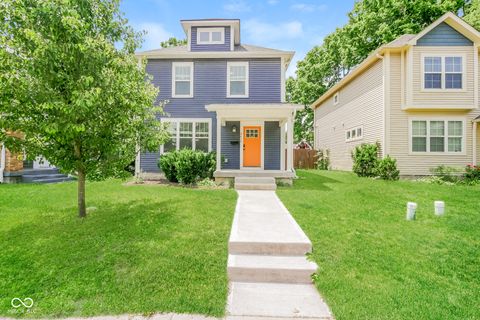
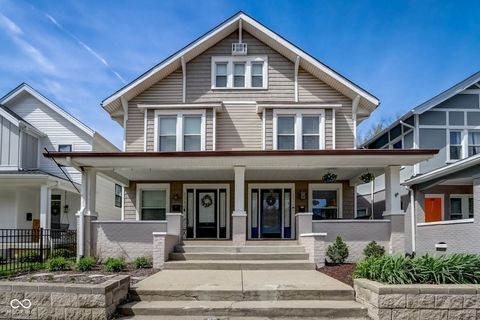
7918 Bonita Ct, Indianapolis, IN 46219
$310
Cash flow
10.4%
Cash-on-Cash Return
8.5%
Cap rate
1.0%
Rent to Value Ratio
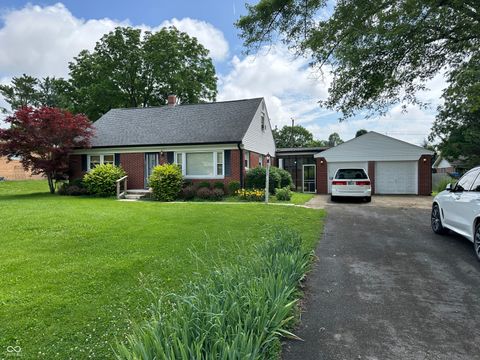
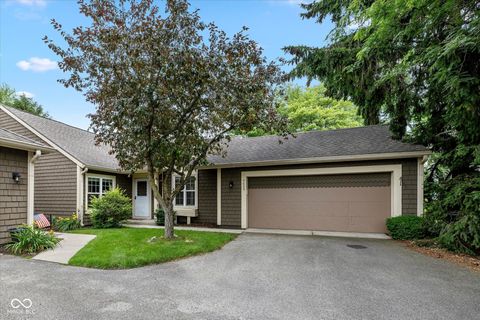
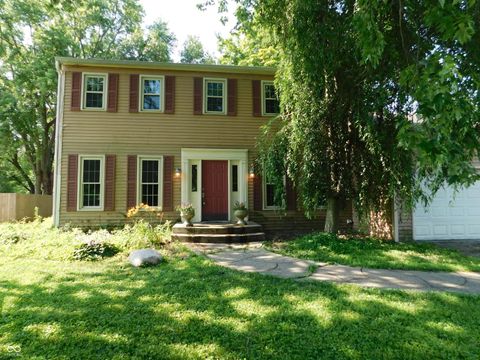
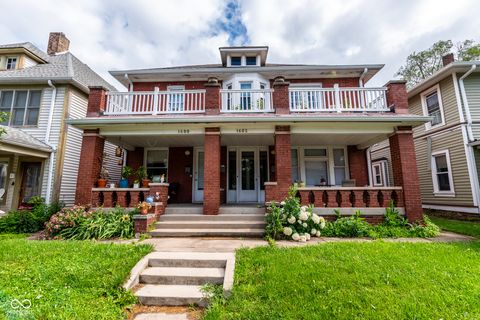
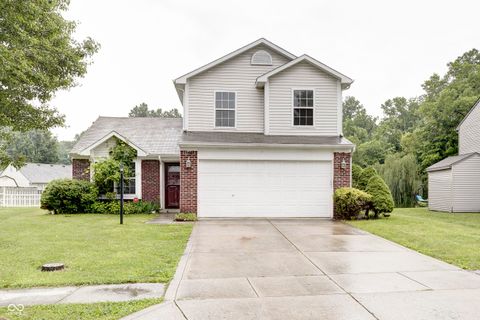
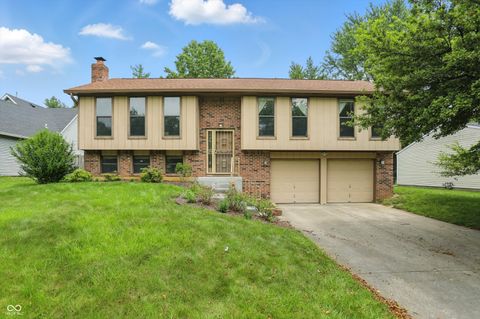
Active
$240,000
4
bds
|
2
ba
|
2,444
sqft
|
built
1957
2211 Rosedale Dr, Indianapolis, IN 46227
$289
Cash flow
6.3%
Cash-on-Cash Return
7.6%
Cap rate
0.9%
Rent to Value Ratio
2,151 out of 2,308 properties for sale in Indianapolis, IN
Limited Results Shown
Create a free account, or log in to reveal all property listings and enjoy the complete experience.
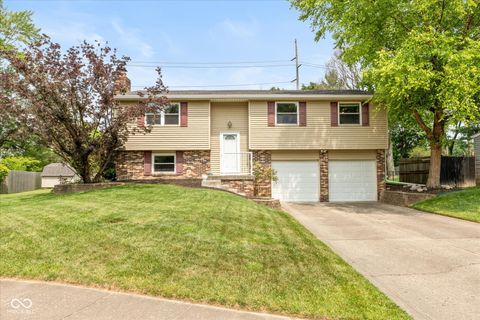
Active
$285,000
3
bds
|
3
ba
|
1,687
sqft
|
built
1976
5802 Rymark Ct, Indianapolis, IN 46250
$-84
Cash flow
-1.5%
Cash-on-Cash Return
5.8%
Cap rate
0.7%
Rent to Value Ratio
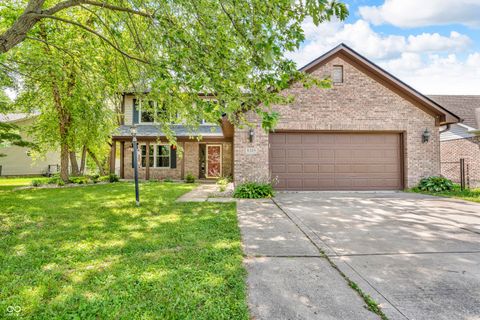
Active
$344,900
4
bds
|
3
ba
|
2,016
sqft
|
built
1997
6329 Whitaker Farms Dr, Indianapolis, IN 46237
$-404
Cash flow
-6.1%
Cash-on-Cash Return
4.7%
Cap rate
0.6%
Rent to Value Ratio
Active
$375,000
2
bds
|
0
ba
|
0
sqft
|
built
1957
5002 E Washington St, Indianapolis, IN 46201
$-817
Cash flow
-11.4%
Cash-on-Cash Return
3.5%
Cap rate
0.4%
Rent to Value Ratio
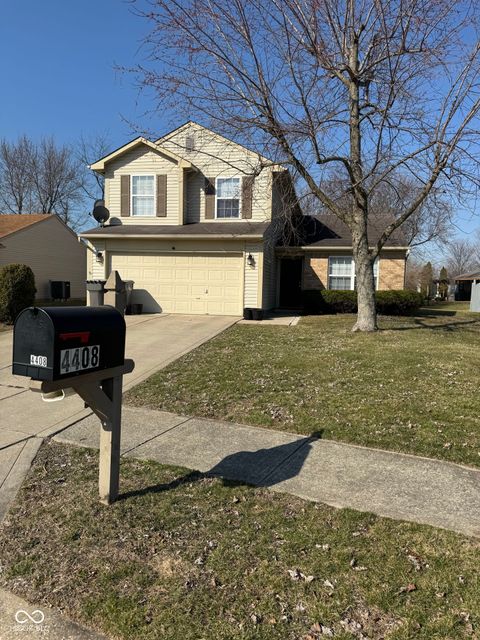
Active
$240,000
4
bds
|
2
ba
|
2,444
sqft
|
built
1957
2211 Rosedale Dr, Indianapolis, IN 46227
$289
Cash flow
6.3%
Cash-on-Cash Return
7.6%
Cap rate
0.9%
Rent to Value Ratio
Active
$222,000
2
bds
|
2
ba
|
1,297
sqft
|
built
1984
4609 Framington Ct, Indianapolis, IN 46254
$-268
Cash flow
-6.3%
Cash-on-Cash Return
4.7%
Cap rate
0.8%
Rent to Value Ratio
Active
$795,000
4
bds
|
3
ba
|
3,230
sqft
|
built
1953
100 Wellington Rd, Indianapolis, IN 46260
$-1,381
Cash flow
-9.1%
Cash-on-Cash Return
4.1%
Cap rate
0.5%
Rent to Value Ratio
Active
$835,000
4
bds
|
4
ba
|
6,649
sqft
|
built
1999
9190 Hastings Trce, Indianapolis, IN 46234
$-2,112
Cash flow
-13.2%
Cash-on-Cash Return
3.1%
Cap rate
0.4%
Rent to Value Ratio
Active
$170,000
2
bds
|
1
ba
|
864
sqft
|
built
1953
5312 N Kercheval Dr, Indianapolis, IN 46226
$26
Cash flow
0.8%
Cash-on-Cash Return
6.3%
Cap rate
0.8%
Rent to Value Ratio
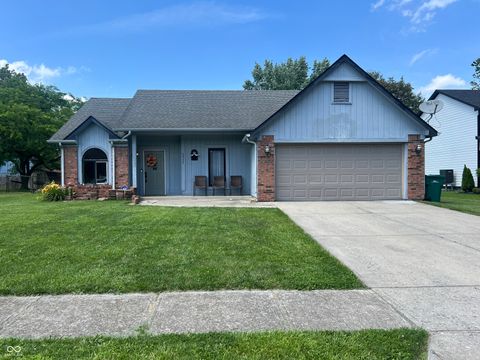
Active
$215,000
3
bds
|
3
ba
|
1,540
sqft
|
built
1998
4408 Vestry Pl, Indianapolis, IN 46237
$52
Cash flow
1.3%
Cash-on-Cash Return
6.4%
Cap rate
0.8%
Rent to Value Ratio
Active
$255,000
2
bds
|
2
ba
|
1,108
sqft
|
built
1987
6932 Deerbrook Ct, Indianapolis, IN 46214
$-202
Cash flow
-4.1%
Cash-on-Cash Return
5.2%
Cap rate
0.6%
Rent to Value Ratio
Active
$312,500
2
bds
|
3
ba
|
1,936
sqft
|
built
2006
2405 N Park Ave, Indianapolis, IN 46205
$-296
Cash flow
-4.9%
Cash-on-Cash Return
5.0%
Cap rate
0.8%
Rent to Value Ratio
Active
$550,000
3
bds
|
2
ba
|
2,408
sqft
|
built
1915
5922 Broadway St, Indianapolis, IN 46220
$-816
Cash flow
-7.7%
Cash-on-Cash Return
4.4%
Cap rate
0.5%
Rent to Value Ratio
Active
$250,000
3
bds
|
2
ba
|
1,445
sqft
|
built
1960
1231 S Catherwood Ave, Indianapolis, IN 46203
$-108
Cash flow
-2.3%
Cash-on-Cash Return
5.6%
Cap rate
0.7%
Rent to Value Ratio
Active
$225,000
2
bds
|
3
ba
|
2,124
sqft
|
built
1982
9323 Doubloon Rd, Indianapolis, IN 46268
$-102
Cash flow
-2.4%
Cash-on-Cash Return
5.6%
Cap rate
0.8%
Rent to Value Ratio
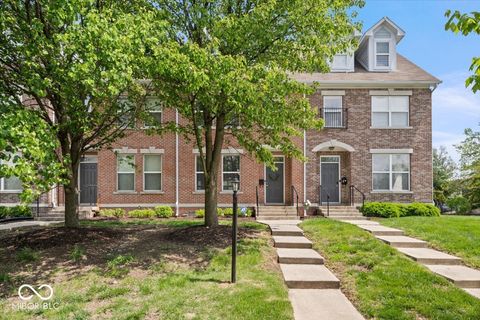
Active
$350,000
2
bds
|
3
ba
|
1,676
sqft
|
built
1911
914 N Alabama St, Indianapolis, IN 46202
$-506
Cash flow
-7.5%
Cash-on-Cash Return
4.4%
Cap rate
0.7%
Rent to Value Ratio
Active
$224,900
3
bds
|
1
ba
|
1,373
sqft
|
built
1953
3921 S Lasalle St, Indianapolis, IN 46237
$-48
Cash flow
-1.1%
Cash-on-Cash Return
5.9%
Cap rate
0.7%
Rent to Value Ratio
Active
$279,900
4
bds
|
3
ba
|
2,176
sqft
|
built
1975
8425 E 82nd St, Indianapolis, IN 46256
$110
Cash flow
2.1%
Cash-on-Cash Return
6.6%
Cap rate
0.8%
Rent to Value Ratio
Active
$220,000
4
bds
|
2
ba
|
995
sqft
|
built
1949
3201 W 22nd St, Indianapolis, IN 46222
$-23
Cash flow
-0.5%
Cash-on-Cash Return
6.0%
Cap rate
0.7%
Rent to Value Ratio
Active
$449,900
4
bds
|
3
ba
|
3,289
sqft
|
built
2021
9053 Fitzgerald Dr, Indianapolis, IN 46239
$-418
Cash flow
-4.8%
Cash-on-Cash Return
5.0%
Cap rate
0.6%
Rent to Value Ratio
Active
$264,900
3
bds
|
2
ba
|
1,664
sqft
|
built
1997
413 Blue Spring Dr, Indianapolis, IN 46239
$4
Cash flow
0.1%
Cash-on-Cash Return
6.2%
Cap rate
0.8%
Rent to Value Ratio
Active
$495,000
3
bds
|
0
ba
|
0
sqft
|
built
1910
1602 E Vermont St, Indianapolis, IN 46201
$-1,915
Cash flow
-20.2%
Cash-on-Cash Return
1.5%
Cap rate
0.2%
Rent to Value Ratio
Active
$215,000
4
bds
|
2
ba
|
1,596
sqft
|
built
1955
4923 University Ave, Indianapolis, IN 46201
$-342
Cash flow
-8.3%
Cash-on-Cash Return
4.2%
Cap rate
0.5%
Rent to Value Ratio
Active
$149,900
4
bds
|
2
ba
|
2,072
sqft
|
built
1910
321 N Elder Ave, Indianapolis, IN 46222
$198
Cash flow
6.9%
Cash-on-Cash Return
7.7%
Cap rate
0.9%
Rent to Value Ratio
Active
$270,000
4
bds
|
3
ba
|
1,632
sqft
|
built
2018
3626 N Capitol Ave, Indianapolis, IN 46208
$-3
Cash flow
-0.1%
Cash-on-Cash Return
6.1%
Cap rate
0.7%
Rent to Value Ratio
Active
$279,900
2
bds
|
1
ba
|
958
sqft
|
built
1941
5378 Rosslyn Ave, Indianapolis, IN 46220
$-54
Cash flow
-1.0%
Cash-on-Cash Return
5.9%
Cap rate
0.7%
Rent to Value Ratio
Active
$165,000
3
bds
|
1
ba
|
934
sqft
|
built
1966
1605 S Leland Ave, Indianapolis, IN 46203
$121
Cash flow
3.8%
Cash-on-Cash Return
7.0%
Cap rate
0.8%
Rent to Value Ratio
Active
$99,900
0
bds
|
0
ba
|
0
sqft
|
built
1910
21 N Gladstone Ave, Indianapolis, IN 46201
$109
Cash flow
5.7%
Cash-on-Cash Return
7.5%
Cap rate
0.9%
Rent to Value Ratio
Active
$425,000
3
bds
|
3
ba
|
2,450
sqft
|
built
1915
2332 Central Ave, Indianapolis, IN 46205
$-245
Cash flow
-3.0%
Cash-on-Cash Return
5.5%
Cap rate
0.7%
Rent to Value Ratio
Active
$194,900
2
bds
|
1
ba
|
1,296
sqft
|
built
1950
5430 E 17th St, Indianapolis, IN 46218
$106
Cash flow
2.8%
Cash-on-Cash Return
6.8%
Cap rate
0.8%
Rent to Value Ratio
Active
$185,000
3
bds
|
2
ba
|
1,016
sqft
|
built
1954
4723 Crittenden Ave, Indianapolis, IN 46205
$225
Cash flow
6.3%
Cash-on-Cash Return
7.6%
Cap rate
0.9%
Rent to Value Ratio
Active
$400,000
4
bds
|
3
ba
|
1,656
sqft
|
built
1900
519 Sutherland Ave, Indianapolis, IN 46205
$-481
Cash flow
-6.3%
Cash-on-Cash Return
4.7%
Cap rate
0.6%
Rent to Value Ratio
Active
$270,000
3
bds
|
3
ba
|
2,155
sqft
|
built
1998
8038 Midlothian Way, Indianapolis, IN 46214
$-53
Cash flow
-1.0%
Cash-on-Cash Return
5.9%
Cap rate
0.7%
Rent to Value Ratio
Active
$250,900
3
bds
|
3
ba
|
1,540
sqft
|
built
2000
5234 Melbourne Rd, Indianapolis, IN 46228
$-93
Cash flow
-1.9%
Cash-on-Cash Return
5.7%
Cap rate
0.7%
Rent to Value Ratio
Active
$217,900
3
bds
|
2
ba
|
1,304
sqft
|
built
1917
2720 S Taft Ave, Indianapolis, IN 46241
$-288
Cash flow
-6.9%
Cash-on-Cash Return
4.6%
Cap rate
0.6%
Rent to Value Ratio
Active
$234,900
3
bds
|
3
ba
|
1,745
sqft
|
built
1999
11532 Glenn Abbey Ln, Indianapolis, IN 46235
$150
Cash flow
3.3%
Cash-on-Cash Return
6.9%
Cap rate
0.9%
Rent to Value Ratio
Active
$399,900
3
bds
|
2
ba
|
2,282
sqft
|
built
1925
6649 Madison Ave, Indianapolis, IN 46227
$-668
Cash flow
-8.7%
Cash-on-Cash Return
4.1%
Cap rate
0.5%
Rent to Value Ratio
Active
$274,500
3
bds
|
3
ba
|
2,484
sqft
|
built
1987
5847 Democracy Dr, Indianapolis, IN 46254
$87
Cash flow
1.7%
Cash-on-Cash Return
6.5%
Cap rate
0.8%
Rent to Value Ratio
Active
$549,000
4
bds
|
3
ba
|
3,367
sqft
|
built
1921
4356 N College Ave, Indianapolis, IN 46205
$-1,018
Cash flow
-9.7%
Cash-on-Cash Return
3.9%
Cap rate
0.5%
Rent to Value Ratio
Active
$350,000
3
bds
|
3
ba
|
2,144
sqft
|
built
1988
8313 Tequista Cir, Indianapolis, IN 46236
$-256
Cash flow
-3.8%
Cash-on-Cash Return
5.3%
Cap rate
0.7%
Rent to Value Ratio
Active
$154,999
3
bds
|
1
ba
|
1,421
sqft
|
built
1959
7918 Bonita Ct, Indianapolis, IN 46219
$310
Cash flow
10.4%
Cash-on-Cash Return
8.5%
Cap rate
1.0%
Rent to Value Ratio