Indianapolis, IN Investment Properties for Sale
Browse homes for sale and investment properties in Indianapolis, IN. Refine your search by price, property type, or more.
Best cash flowing properties in Indianapolis, IN
Active
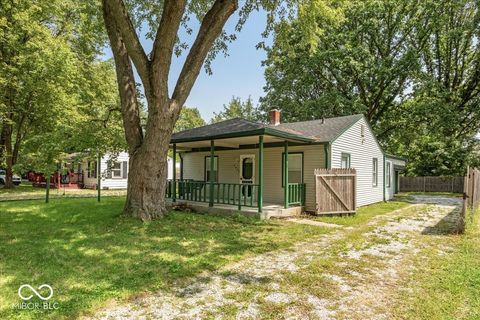
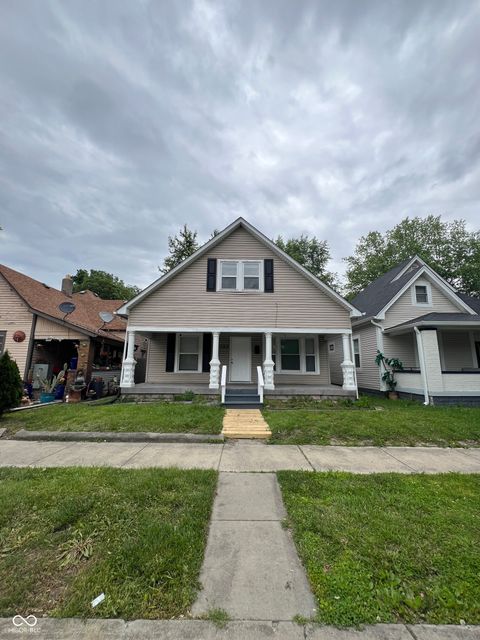
$67,900
2
bds
|
1
ba
|
720
sqft
|
built
1951
2959 N Lasalle St, Indianapolis, IN 46218
$759
Cash flow
13.0%
Cash-on-Cash Return
13.4%
Cap rate
1.6%
Rent to Value Ratio

Active
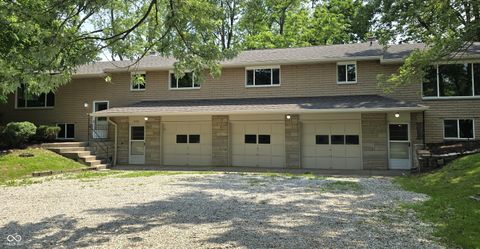
$450,000
3
bds
|
3
ba
|
3,695
sqft
|
built
1979
8954 Briarclift Rd, Indianapolis, IN 46256
$411
Cash flow
4.8%
Cash-on-Cash Return
7.4%
Cap rate
0.9%
Rent to Value Ratio
2,136 out of 2,292 properties for sale in Indianapolis, IN
Limited Results Shown
Create a free account, or log in to reveal all property listings and enjoy the complete experience.
Active
$450,000
3
bds
|
3
ba
|
3,695
sqft
|
built
1979
8954 Briarclift Rd, Indianapolis, IN 46256
$411
Cash flow
4.8%
Cash-on-Cash Return
7.4%
Cap rate
0.9%
Rent to Value Ratio
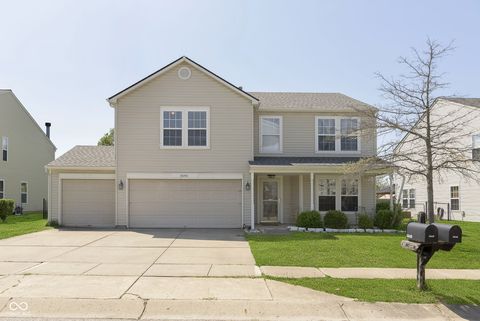
Active
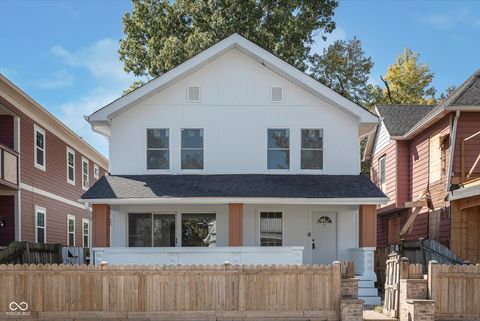
$389,900
5
bds
|
3
ba
|
2,516
sqft
|
built
2000
1334 Legacy Ct, Indianapolis, IN 46234
$-317
Cash flow
-4.2%
Cash-on-Cash Return
5.3%
Cap rate
0.6%
Rent to Value Ratio
Active
$94,900
2
bds
|
2
ba
|
1,063
sqft
|
built
1910
2702 Boulevard Pl, Indianapolis, IN 46208
$264
Cash flow
14.5%
Cash-on-Cash Return
9.6%
Cap rate
1.2%
Rent to Value Ratio
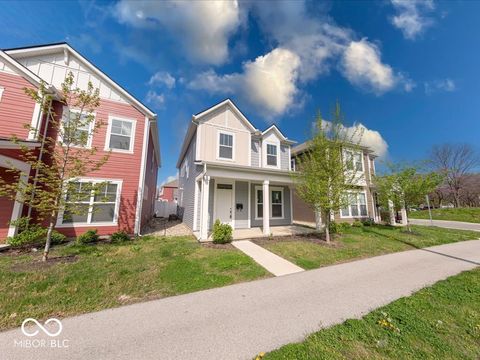
Active
$289,000
3
bds
|
2
ba
|
1,696
sqft
|
built
2007
5304 Appleseed Way, Indianapolis, IN 46217
$-298
Cash flow
-5.4%
Cash-on-Cash Return
5.0%
Cap rate
0.6%
Rent to Value Ratio
Active
$185,000
3
bds
|
1
ba
|
1,224
sqft
|
built
1954
3649 N Sadlier Dr, Indianapolis, IN 46226
$138
Cash flow
3.9%
Cash-on-Cash Return
7.2%
Cap rate
0.9%
Rent to Value Ratio
Active
$420,000
2
bds
|
0
ba
|
0
sqft
|
built
1964
10016 E Troy Ave, Indianapolis, IN 46239
$-1,227
Cash flow
-15.2%
Cash-on-Cash Return
2.8%
Cap rate
0.3%
Rent to Value Ratio

Active
$245,000
3
bds
|
3
ba
|
1,928
sqft
|
built
1885
1653 S Delaware St, Indianapolis, IN 46225
$239
Cash flow
5.1%
Cash-on-Cash Return
7.4%
Cap rate
0.9%
Rent to Value Ratio
Active
$375,000
4
bds
|
3
ba
|
2,464
sqft
|
built
1920
2442 Guilford Ave, Indianapolis, IN 46205
$-578
Cash flow
-8.0%
Cash-on-Cash Return
4.4%
Cap rate
0.5%
Rent to Value Ratio

Active
$225,000
3
bds
|
1
ba
|
1,040
sqft
|
built
1955
4213 N Audubon Rd, Indianapolis, IN 46226
$-2
Cash flow
0.0%
Cash-on-Cash Return
6.3%
Cap rate
0.8%
Rent to Value Ratio
Active
$330,000
3
bds
|
3
ba
|
1,804
sqft
|
built
2022
326 N Warman Ave, Indianapolis, IN 46222
$-376
Cash flow
-5.9%
Cash-on-Cash Return
4.9%
Cap rate
0.6%
Rent to Value Ratio
Active
$310,000
3
bds
|
3
ba
|
2,463
sqft
|
built
2004
5646 Skipping Stone Dr, Indianapolis, IN 46237
$-260
Cash flow
-4.4%
Cash-on-Cash Return
5.3%
Cap rate
0.6%
Rent to Value Ratio

Active
$259,000
4
bds
|
3
ba
|
1,411
sqft
|
built
1931
1429 Udell St, Indianapolis, IN 46208
$-386
Cash flow
-7.8%
Cash-on-Cash Return
4.5%
Cap rate
0.5%
Rent to Value Ratio
Active
$67,900
2
bds
|
1
ba
|
720
sqft
|
built
1951
2959 N Lasalle St, Indianapolis, IN 46218
$759
Cash flow
13.0%
Cash-on-Cash Return
13.4%
Cap rate
1.6%
Rent to Value Ratio
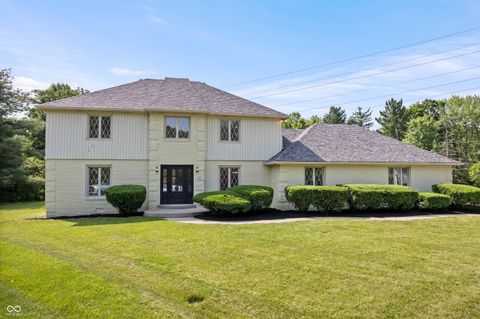
Active
$449,990
4
bds
|
3
ba
|
2,660
sqft
|
built
1975
9205 Selkirk Ct, Indianapolis, IN 46260
$-897
Cash flow
-10.4%
Cash-on-Cash Return
3.9%
Cap rate
0.5%
Rent to Value Ratio
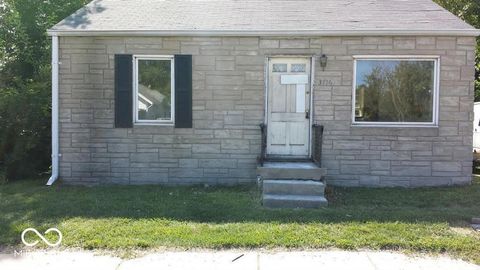
Active
$219,900
2
bds
|
1
ba
|
672
sqft
|
built
1950
3716 N Emerson Ave, Indianapolis, IN 46218
$-389
Cash flow
-9.2%
Cash-on-Cash Return
4.1%
Cap rate
0.5%
Rent to Value Ratio
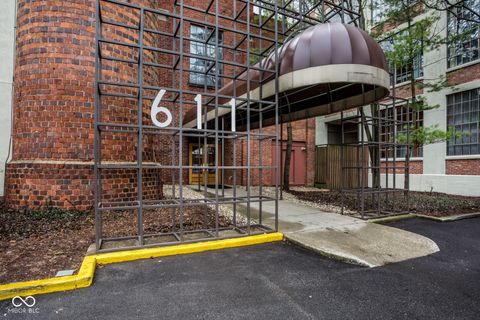
Active
$385,000
2
bds
|
2
ba
|
1,230
sqft
|
built
1926
611 N Park Ave, Indianapolis, IN 46204
$-755
Cash flow
-10.2%
Cash-on-Cash Return
3.9%
Cap rate
0.7%
Rent to Value Ratio
Active
$184,000
5
bds
|
2
ba
|
1,866
sqft
|
built
1910
733 Haugh St, Indianapolis, IN 46222
$5
Cash flow
0.1%
Cash-on-Cash Return
6.3%
Cap rate
0.8%
Rent to Value Ratio

Active
$175,000
2
bds
|
1
ba
|
1,642
sqft
|
built
1920
448 N Gray St, Indianapolis, IN 46201
$190
Cash flow
5.7%
Cash-on-Cash Return
7.6%
Cap rate
0.9%
Rent to Value Ratio
Active
$299,000
2
bds
|
2
ba
|
1,555
sqft
|
built
2006
2326 N Pennsylvania St, Indianapolis, IN 46205
$-361
Cash flow
-6.3%
Cash-on-Cash Return
4.8%
Cap rate
0.7%
Rent to Value Ratio

Active
$299,900
3
bds
|
2
ba
|
1,420
sqft
|
built
1994
12250 Longstraw Dr, Indianapolis, IN 46236
$-197
Cash flow
-3.4%
Cash-on-Cash Return
5.5%
Cap rate
0.7%
Rent to Value Ratio
Active
$485,000
2
bds
|
3
ba
|
1,880
sqft
|
built
2022
1816 Rosette Way, Indianapolis, IN 46202
$-434
Cash flow
-4.7%
Cash-on-Cash Return
5.2%
Cap rate
0.7%
Rent to Value Ratio
Active
$465,000
5
bds
|
3
ba
|
3,179
sqft
|
built
2022
8811 Dorill Creek Ln, Indianapolis, IN 46259
$-496
Cash flow
-5.6%
Cash-on-Cash Return
5.0%
Cap rate
0.6%
Rent to Value Ratio

Active
$359,000
3
bds
|
3
ba
|
2,686
sqft
|
built
1980
7440 Sylvan Ridge Rd, Indianapolis, IN 46240
$-644
Cash flow
-9.4%
Cash-on-Cash Return
4.1%
Cap rate
0.7%
Rent to Value Ratio

Active
$190,000
3
bds
|
1
ba
|
1,128
sqft
|
built
1962
1601 Draper St, Indianapolis, IN 46203
$250
Cash flow
6.9%
Cash-on-Cash Return
7.8%
Cap rate
0.9%
Rent to Value Ratio

Active
$479,900
5
bds
|
5
ba
|
3,553
sqft
|
built
1959
4904 Kessler Boulevard North Dr, Indianapolis, IN 46228
$-297
Cash flow
-3.2%
Cash-on-Cash Return
5.5%
Cap rate
0.7%
Rent to Value Ratio

Active
$95,000
3
bds
|
1
ba
|
1,080
sqft
|
built
1951
4109 E 21st St, Indianapolis, IN 46218
$401
Cash flow
22.0%
Cash-on-Cash Return
11.3%
Cap rate
1.4%
Rent to Value Ratio
Active
$199,000
1
bds
|
1
ba
|
1,040
sqft
|
built
1968
4000 N Meridian St, Indianapolis, IN 46208
$-795
Cash flow
-20.8%
Cash-on-Cash Return
1.5%
Cap rate
0.8%
Rent to Value Ratio

Active
$170,000
0
bds
|
0
ba
|
0
sqft
|
built
1920
4918 E New York St, Indianapolis, IN 46201
$-474
Cash flow
-14.5%
Cash-on-Cash Return
2.9%
Cap rate
0.4%
Rent to Value Ratio

Active
$225,000
3
bds
|
2
ba
|
1,379
sqft
|
built
2006
5406 Shamus Dr, Indianapolis, IN 46235
$37
Cash flow
0.9%
Cash-on-Cash Return
6.5%
Cap rate
0.8%
Rent to Value Ratio
Active
$199,900
3
bds
|
3
ba
|
1,400
sqft
|
built
1955
2035 Carrollton Ave, Indianapolis, IN 46202
$60
Cash flow
1.6%
Cash-on-Cash Return
6.6%
Cap rate
0.8%
Rent to Value Ratio

Active
$84,900
2
bds
|
2
ba
|
1,584
sqft
|
built
1911
439 N Colorado Ave, Indianapolis, IN 46201
$316
Cash flow
19.4%
Cash-on-Cash Return
10.7%
Cap rate
1.3%
Rent to Value Ratio
Active
$200,000
2
bds
|
1
ba
|
797
sqft
|
built
1920
108 E Saint Clair St, Indianapolis, IN 46204
$-157
Cash flow
-4.1%
Cash-on-Cash Return
5.3%
Cap rate
0.9%
Rent to Value Ratio

Active
$185,000
2
bds
|
3
ba
|
1,325
sqft
|
built
1990
3213 Oceanline East Dr, Indianapolis, IN 46214
$44
Cash flow
1.2%
Cash-on-Cash Return
6.6%
Cap rate
1.0%
Rent to Value Ratio

Active
$359,900
3
bds
|
3
ba
|
1,638
sqft
|
built
1910
1665 N College Ave, Indianapolis, IN 46202
$53
Cash flow
0.8%
Cash-on-Cash Return
6.4%
Cap rate
0.8%
Rent to Value Ratio

Active
$149,900
2
bds
|
2
ba
|
1,603
sqft
|
built
1974
1602 Queensbridge Sq, Indianapolis, IN 46219
$-127
Cash flow
-4.4%
Cash-on-Cash Return
5.3%
Cap rate
0.9%
Rent to Value Ratio
Active
$334,900
3
bds
|
2
ba
|
1,856
sqft
|
built
2016
4420 Wild Turkey Dr, Indianapolis, IN 46239
$-119
Cash flow
-1.9%
Cash-on-Cash Return
5.8%
Cap rate
0.7%
Rent to Value Ratio

Active
$359,900
3
bds
|
3
ba
|
1,760
sqft
|
built
1880
730 Sanders St, Indianapolis, IN 46203
$53
Cash flow
0.8%
Cash-on-Cash Return
6.4%
Cap rate
0.8%
Rent to Value Ratio
Active
$249,950
4
bds
|
3
ba
|
1,963
sqft
|
built
1923
641 E 33rd St, Indianapolis, IN 46205
$75
Cash flow
1.6%
Cash-on-Cash Return
6.6%
Cap rate
0.8%
Rent to Value Ratio
Active
$145,000
2
bds
|
1
ba
|
2,112
sqft
|
built
1941
3752 N Oxford St, Indianapolis, IN 46218
$209
Cash flow
7.5%
Cash-on-Cash Return
8.0%
Cap rate
1.0%
Rent to Value Ratio

Active
$225,000
2
bds
|
3
ba
|
1,286
sqft
|
built
1991
7529 Oceanline Dr, Indianapolis, IN 46214
$-143
Cash flow
-3.3%
Cash-on-Cash Return
5.5%
Cap rate
0.8%
Rent to Value Ratio