Indianapolis, IN Investment Properties for Sale
Browse homes for sale and investment properties in Indianapolis, IN. Refine your search by price, property type, or more.
Best cash flowing properties in Indianapolis, IN

Active
$43,000
bds
|
0
ba
|
576
sqft
|
built
1995
1254 S Leland Ave, Indianapolis, IN 46203
$759
Cash flow
20.6%
Cash-on-Cash Return
21.2%
Cap rate
2.6%
Rent to Value Ratio

Active
$82,000
2
bds
|
1
ba
|
916
sqft
|
built
1954
1047 N Concord St, Indianapolis, IN 46222
$538
Cash flow
34.2%
Cash-on-Cash Return
14.1%
Cap rate
1.7%
Rent to Value Ratio
2,139 out of 2,296 properties for sale in Indianapolis, IN
Limited Results Shown
Create a free account, or log in to reveal all property listings and enjoy the complete experience.
Active
$269,900
2
bds
|
2
ba
|
1,539
sqft
|
built
1945
2032 N Auburn St, Indianapolis, IN 46224
$-443
Cash flow
-8.6%
Cash-on-Cash Return
4.3%
Cap rate
0.5%
Rent to Value Ratio
Active
$149,999
3
bds
|
3
ba
|
1,857
sqft
|
built
1940
3919 E 34th St, Indianapolis, IN 46218
$183
Cash flow
6.4%
Cash-on-Cash Return
7.7%
Cap rate
0.9%
Rent to Value Ratio
Active
$335,000
5
bds
|
4
ba
|
2,517
sqft
|
built
1930
5053 E Michigan St, Indianapolis, IN 46201
$114
Cash flow
1.8%
Cash-on-Cash Return
6.7%
Cap rate
0.8%
Rent to Value Ratio
Active
$385,000
4
bds
|
3
ba
|
1,920
sqft
|
built
1909
2308 Nowland Ave, Indianapolis, IN 46201
$-78
Cash flow
-1.1%
Cash-on-Cash Return
6.0%
Cap rate
0.7%
Rent to Value Ratio
Active
$390,000
4
bds
|
4
ba
|
3,976
sqft
|
built
2004
10312 Gladeview Dr, Indianapolis, IN 46239
$-363
Cash flow
-4.9%
Cash-on-Cash Return
5.1%
Cap rate
0.6%
Rent to Value Ratio

Active
$244,900
4
bds
|
2
ba
|
1,380
sqft
|
built
2003
5437 Powder River Ct, Indianapolis, IN 46221
$-193
Cash flow
-4.1%
Cash-on-Cash Return
5.3%
Cap rate
0.7%
Rent to Value Ratio
Active
$292,000
3
bds
|
2
ba
|
1,668
sqft
|
built
1952
6047 W 56th St, Indianapolis, IN 46254
$-282
Cash flow
-5.0%
Cash-on-Cash Return
5.1%
Cap rate
0.6%
Rent to Value Ratio
Active
$110,900
3
bds
|
1
ba
|
1,780
sqft
|
built
1935
2955 N Olney St, Indianapolis, IN 46218
$387
Cash flow
18.2%
Cash-on-Cash Return
10.5%
Cap rate
1.3%
Rent to Value Ratio

Active
$450,000
3
bds
|
3
ba
|
3,695
sqft
|
built
1979
8954 Briarclift Rd, Indianapolis, IN 46256
$411
Cash flow
4.8%
Cash-on-Cash Return
7.4%
Cap rate
0.9%
Rent to Value Ratio
Active
$389,900
5
bds
|
3
ba
|
2,516
sqft
|
built
2000
1334 Legacy Ct, Indianapolis, IN 46234
$-317
Cash flow
-4.2%
Cash-on-Cash Return
5.3%
Cap rate
0.6%
Rent to Value Ratio
Active
$94,900
2
bds
|
2
ba
|
1,063
sqft
|
built
1910
2702 Boulevard Pl, Indianapolis, IN 46208
$264
Cash flow
14.5%
Cash-on-Cash Return
9.6%
Cap rate
1.2%
Rent to Value Ratio
Active
$289,000
3
bds
|
2
ba
|
1,696
sqft
|
built
2007
5304 Appleseed Way, Indianapolis, IN 46217
$-298
Cash flow
-5.4%
Cash-on-Cash Return
5.0%
Cap rate
0.6%
Rent to Value Ratio
Active
$185,000
3
bds
|
1
ba
|
1,224
sqft
|
built
1954
3649 N Sadlier Dr, Indianapolis, IN 46226
$138
Cash flow
3.9%
Cash-on-Cash Return
7.2%
Cap rate
0.9%
Rent to Value Ratio
Active
$420,000
2
bds
|
0
ba
|
0
sqft
|
built
1964
10016 E Troy Ave, Indianapolis, IN 46239
$-1,227
Cash flow
-15.2%
Cash-on-Cash Return
2.8%
Cap rate
0.3%
Rent to Value Ratio

Active
$245,000
3
bds
|
3
ba
|
1,928
sqft
|
built
1885
1653 S Delaware St, Indianapolis, IN 46225
$239
Cash flow
5.1%
Cash-on-Cash Return
7.4%
Cap rate
0.9%
Rent to Value Ratio
Active
$375,000
4
bds
|
3
ba
|
2,464
sqft
|
built
1920
2442 Guilford Ave, Indianapolis, IN 46205
$-578
Cash flow
-8.0%
Cash-on-Cash Return
4.4%
Cap rate
0.5%
Rent to Value Ratio

Active
$225,000
3
bds
|
1
ba
|
1,040
sqft
|
built
1955
4213 N Audubon Rd, Indianapolis, IN 46226
$-2
Cash flow
0.0%
Cash-on-Cash Return
6.3%
Cap rate
0.8%
Rent to Value Ratio
Active
$313,999
3
bds
|
3
ba
|
2,378
sqft
|
built
1969
2605 Carrollton Ave, Indianapolis, IN 46205
$-121
Cash flow
-2.0%
Cash-on-Cash Return
5.8%
Cap rate
0.7%
Rent to Value Ratio

Active
$599,900
3
bds
|
7
ba
|
3,072
sqft
|
built
1868
902 Broadway St, Indianapolis, IN 46202
$249
Cash flow
2.2%
Cash-on-Cash Return
6.8%
Cap rate
0.8%
Rent to Value Ratio
Active
$225,000
2
bds
|
2
ba
|
1,056
sqft
|
built
2002
1833 Southernwood Ln, Indianapolis, IN 46231
$-98
Cash flow
-2.3%
Cash-on-Cash Return
5.7%
Cap rate
0.7%
Rent to Value Ratio
Active
$380,000
0
bds
|
0
ba
|
0
sqft
|
built
1927
38 Hendricks Pl, Indianapolis, IN 46201
$-1,432
Cash flow
-19.7%
Cash-on-Cash Return
1.7%
Cap rate
0.2%
Rent to Value Ratio
Active
$410,000
4
bds
|
3
ba
|
3,001
sqft
|
built
1978
8934 Pinyon Ct, Indianapolis, IN 46260
$-282
Cash flow
-3.6%
Cash-on-Cash Return
5.4%
Cap rate
0.7%
Rent to Value Ratio
Active
$114,900
2
bds
|
1
ba
|
1,008
sqft
|
built
1911
642 N Oxford St, Indianapolis, IN 46201
$90
Cash flow
4.1%
Cash-on-Cash Return
7.2%
Cap rate
0.9%
Rent to Value Ratio

Active
$242,000
3
bds
|
4
ba
|
2,692
sqft
|
built
1962
2521 Beechcrest Dr, Indianapolis, IN 46203
$117
Cash flow
2.5%
Cash-on-Cash Return
6.8%
Cap rate
0.8%
Rent to Value Ratio
Active
$220,000
4
bds
|
3
ba
|
1,699
sqft
|
built
2001
4063 Orchard Valley Blvd, Indianapolis, IN 46235
$-1
Cash flow
0.0%
Cash-on-Cash Return
6.3%
Cap rate
0.8%
Rent to Value Ratio
Active
$215,000
2
bds
|
1
ba
|
1,580
sqft
|
built
1958
5240 Southdale Dr, Indianapolis, IN 46217
$-156
Cash flow
-3.8%
Cash-on-Cash Return
5.4%
Cap rate
0.7%
Rent to Value Ratio

Active
$350,000
4
bds
|
2
ba
|
2,757
sqft
|
built
1967
8937 W 800 N, Indianapolis, IN 46259
$174
Cash flow
2.6%
Cash-on-Cash Return
6.9%
Cap rate
0.8%
Rent to Value Ratio

Active
$285,000
3
bds
|
3
ba
|
2,052
sqft
|
built
1914
2936 N New Jersey St, Indianapolis, IN 46205
$237
Cash flow
4.3%
Cash-on-Cash Return
7.3%
Cap rate
0.9%
Rent to Value Ratio

Active
$109,900
2
bds
|
1
ba
|
606
sqft
|
built
1955
1049 N Traub Ave, Indianapolis, IN 46222
$185
Cash flow
8.8%
Cash-on-Cash Return
8.3%
Cap rate
1.0%
Rent to Value Ratio

Active
$198,000
3
bds
|
2
ba
|
1,080
sqft
|
built
1928
1518 Lawton Ave, Indianapolis, IN 46203
$-137
Cash flow
-3.6%
Cash-on-Cash Return
5.4%
Cap rate
0.7%
Rent to Value Ratio

Active
$164,900
3
bds
|
1
ba
|
1,582
sqft
|
built
2014
243 E Caven St, Indianapolis, IN 46225
$105
Cash flow
3.3%
Cash-on-Cash Return
7.0%
Cap rate
0.8%
Rent to Value Ratio

Active
$319,900
3
bds
|
3
ba
|
3,030
sqft
|
built
2014
11851 Fawn Crest Dr, Indianapolis, IN 46235
$55
Cash flow
0.9%
Cash-on-Cash Return
6.5%
Cap rate
0.8%
Rent to Value Ratio
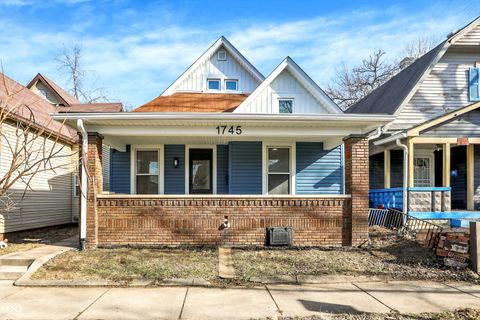
Active
$274,900
3
bds
|
3
ba
|
1,436
sqft
|
built
1955
1745 S Talbott St, Indianapolis, IN 46225
$497
Cash flow
9.4%
Cash-on-Cash Return
8.4%
Cap rate
1.0%
Rent to Value Ratio
Active
$82,000
2
bds
|
1
ba
|
916
sqft
|
built
1954
1047 N Concord St, Indianapolis, IN 46222
$538
Cash flow
34.2%
Cash-on-Cash Return
14.1%
Cap rate
1.7%
Rent to Value Ratio
Active
$43,000
bds
|
0
ba
|
576
sqft
|
built
1995
1254 S Leland Ave, Indianapolis, IN 46203
$759
Cash flow
20.6%
Cash-on-Cash Return
21.2%
Cap rate
2.6%
Rent to Value Ratio

Active
$549,900
4
bds
|
3
ba
|
3,203
sqft
|
built
1993
12335 Old Stone Dr, Indianapolis, IN 46236
$-500
Cash flow
-4.7%
Cash-on-Cash Return
5.2%
Cap rate
0.6%
Rent to Value Ratio

Active
$399,900
2
bds
|
3
ba
|
1,702
sqft
|
built
1924
350 N Meridian St, Indianapolis, IN 46204
$-1,025
Cash flow
-13.4%
Cash-on-Cash Return
3.2%
Cap rate
0.7%
Rent to Value Ratio

Active
$350,000
2
bds
|
2
ba
|
1,255
sqft
|
built
2006
355 E Ohio St, Indianapolis, IN 46204
$-327
Cash flow
-4.9%
Cash-on-Cash Return
5.1%
Cap rate
0.8%
Rent to Value Ratio
Active
$365,000
3
bds
|
2
ba
|
2,640
sqft
|
built
2012
5560 Goodwin St, Indianapolis, IN 46234
$-219
Cash flow
-3.1%
Cash-on-Cash Return
5.5%
Cap rate
0.7%
Rent to Value Ratio

Active
$134,900
2
bds
|
1
ba
|
1,845
sqft
|
built
1910
724 E Beecher St, Indianapolis, IN 46203
$262
Cash flow
10.1%
Cash-on-Cash Return
8.6%
Cap rate
1.0%
Rent to Value Ratio