Indianapolis, IN Investment Properties for Sale
Browse homes for sale and investment properties in Indianapolis, IN. Refine your search by price, property type, or more.
Best cash flowing properties in Indianapolis, IN

Active
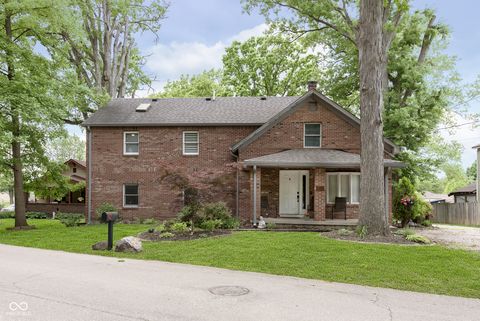
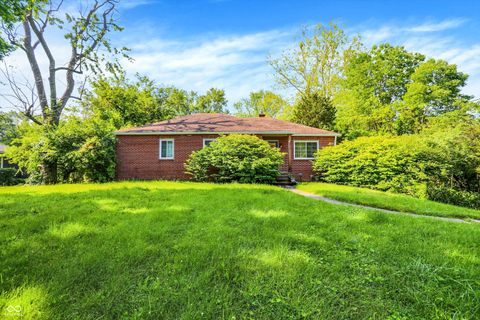
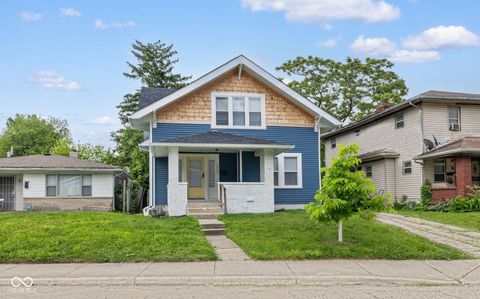
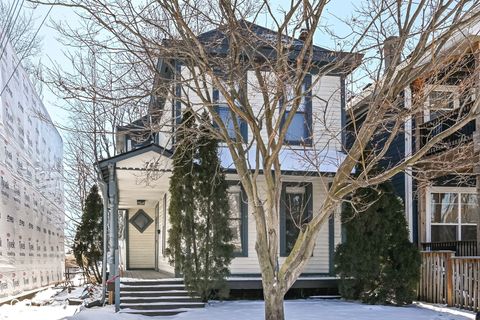
$235,000
3
bds
|
2
ba
|
1,344
sqft
|
built
1919
1016 Churchman Ave, Indianapolis, IN 46203
$567
Cash flow
12.6%
Cash-on-Cash Return
9.2%
Cap rate
1.1%
Rent to Value Ratio
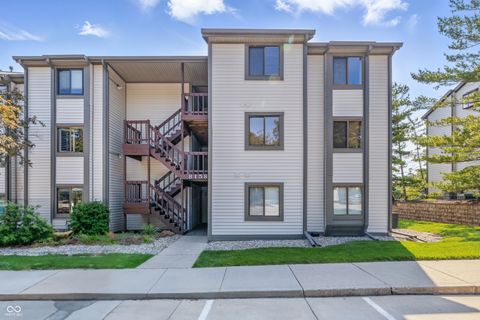
Active
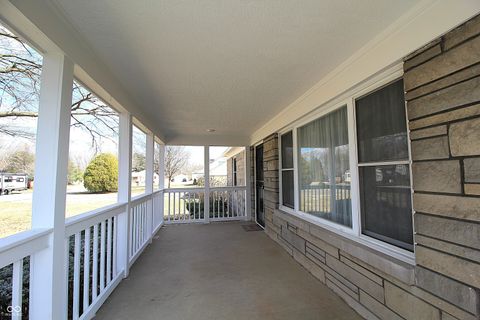
$949,900
4
bds
|
6
ba
|
5,611
sqft
|
built
1970
4339 Royal Pine Blvd, Indianapolis, IN 46250
$543
Cash flow
3.0%
Cash-on-Cash Return
7.0%
Cap rate
0.8%
Rent to Value Ratio
2,136 out of 2,292 properties for sale in Indianapolis, IN
Limited Results Shown
Create a free account, or log in to reveal all property listings and enjoy the complete experience.
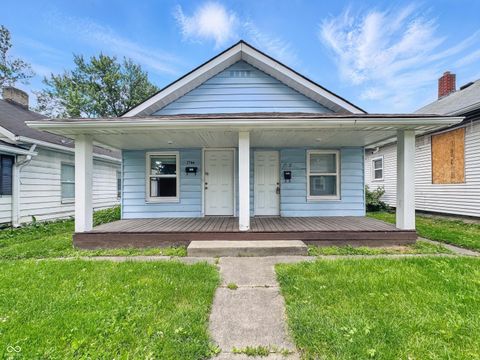
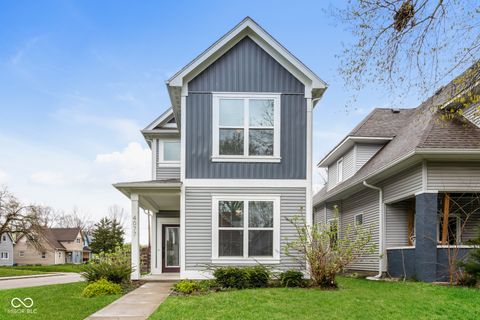
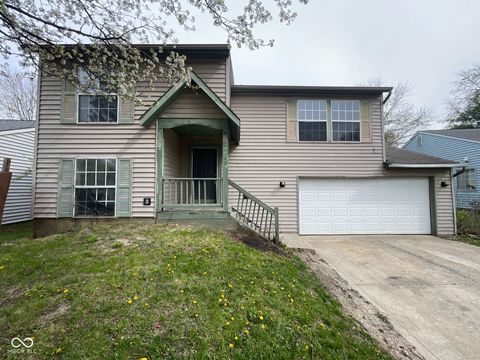
Active
$215,000
4
bds
|
2
ba
|
2,034
sqft
|
built
1962
3668 Chatsbee Ct, Indianapolis, IN 46224
$120
Cash flow
2.9%
Cash-on-Cash Return
6.9%
Cap rate
0.8%
Rent to Value Ratio
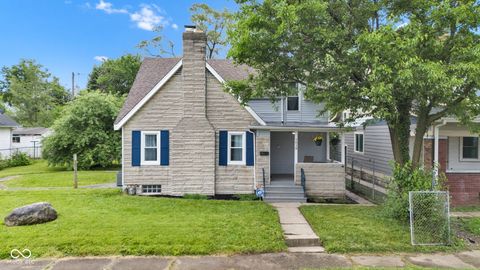
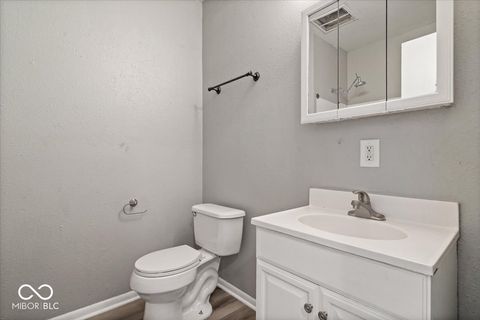
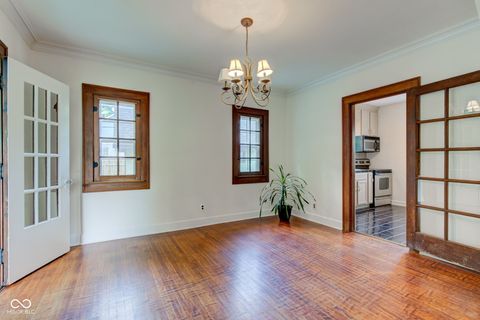
Active
$259,900
3
bds
|
2
ba
|
1,367
sqft
|
built
1948
909 E Markwood Ave, Indianapolis, IN 46227
$23
Cash flow
0.5%
Cash-on-Cash Return
6.4%
Cap rate
0.8%
Rent to Value Ratio
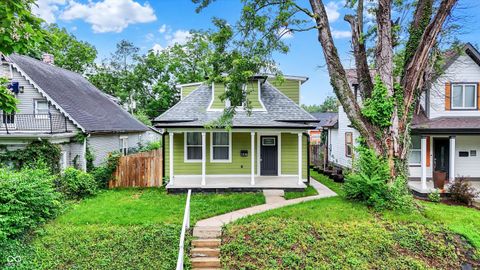
Active
$173,900
3
bds
|
1
ba
|
1,181
sqft
|
built
1959
7641 E 35th St, Indianapolis, IN 46226
$58
Cash flow
1.7%
Cash-on-Cash Return
6.7%
Cap rate
0.8%
Rent to Value Ratio
Active
$339,900
5
bds
|
4
ba
|
2,409
sqft
|
built
1940
5110 S State Ave, Indianapolis, IN 46227
$-50
Cash flow
-0.8%
Cash-on-Cash Return
6.1%
Cap rate
0.7%
Rent to Value Ratio
Active
$949,900
4
bds
|
6
ba
|
5,611
sqft
|
built
1970
4339 Royal Pine Blvd, Indianapolis, IN 46250
$543
Cash flow
3.0%
Cash-on-Cash Return
7.0%
Cap rate
0.8%
Rent to Value Ratio

Active
$324,900
3
bds
|
3
ba
|
2,008
sqft
|
built
1890
1626 S Delaware St, Indianapolis, IN 46225
$98
Cash flow
1.6%
Cash-on-Cash Return
6.6%
Cap rate
0.8%
Rent to Value Ratio
Active
$315,000
4
bds
|
3
ba
|
2,260
sqft
|
built
1949
1739 Forest Dr, Indianapolis, IN 46227
$-472
Cash flow
-7.8%
Cash-on-Cash Return
4.5%
Cap rate
0.5%
Rent to Value Ratio
Active
$110,900
1
bds
|
0
ba
|
0
sqft
|
built
1920
1742 Laurel St, Indianapolis, IN 46203
$-27
Cash flow
-1.3%
Cash-on-Cash Return
6.0%
Cap rate
0.7%
Rent to Value Ratio
Active
$320,000
4
bds
|
3
ba
|
2,783
sqft
|
built
1937
1618 Villa Ave, Indianapolis, IN 46203
$-153
Cash flow
-2.5%
Cash-on-Cash Return
5.7%
Cap rate
0.7%
Rent to Value Ratio

Active
$175,000
2
bds
|
0
ba
|
0
sqft
|
built
1925
1305 W 36th St, Indianapolis, IN 46208
$-224
Cash flow
-6.7%
Cash-on-Cash Return
4.7%
Cap rate
0.6%
Rent to Value Ratio
Active
$275,000
3
bds
|
2
ba
|
1,709
sqft
|
built
1949
3215 E Edgewood Ave, Indianapolis, IN 46227
$-332
Cash flow
-6.3%
Cash-on-Cash Return
4.8%
Cap rate
0.6%
Rent to Value Ratio

Active
$233,900
5
bds
|
2
ba
|
2,053
sqft
|
built
1964
4020 N Mitthoefer Rd, Indianapolis, IN 46235
$-117
Cash flow
-2.6%
Cash-on-Cash Return
5.7%
Cap rate
0.7%
Rent to Value Ratio
Active
$175,000
2
bds
|
1
ba
|
890
sqft
|
built
1928
55 E Regent St, Indianapolis, IN 46225
$-155
Cash flow
-4.6%
Cash-on-Cash Return
5.2%
Cap rate
0.6%
Rent to Value Ratio

Active
$314,900
3
bds
|
4
ba
|
2,502
sqft
|
built
2005
6927 Havenmoor Pl, Indianapolis, IN 46250
$-180
Cash flow
-3.0%
Cash-on-Cash Return
5.6%
Cap rate
0.7%
Rent to Value Ratio
Active
$276,900
3
bds
|
3
ba
|
2,267
sqft
|
built
2004
2730 Foxbriar Pl, Indianapolis, IN 46203
$-66
Cash flow
-1.2%
Cash-on-Cash Return
6.0%
Cap rate
0.7%
Rent to Value Ratio
Active
$250,000
2
bds
|
3
ba
|
1,549
sqft
|
built
1983
4635 Stansbury Ct, Indianapolis, IN 46254
$-320
Cash flow
-6.7%
Cash-on-Cash Return
4.7%
Cap rate
0.8%
Rent to Value Ratio
Active
$295,000
4
bds
|
3
ba
|
2,800
sqft
|
built
2020
4067 Denali Dr, Indianapolis, IN 46235
$21
Cash flow
0.4%
Cash-on-Cash Return
6.3%
Cap rate
0.8%
Rent to Value Ratio
Active
$138,000
2
bds
|
1
ba
|
1,524
sqft
|
built
1915
918 N Olney St, Indianapolis, IN 46201
$177
Cash flow
6.7%
Cash-on-Cash Return
7.8%
Cap rate
0.9%
Rent to Value Ratio

Active
$250,000
4
bds
|
2
ba
|
1,616
sqft
|
built
1960
4407 Barnor Dr, Indianapolis, IN 46226
$75
Cash flow
1.6%
Cash-on-Cash Return
6.6%
Cap rate
0.8%
Rent to Value Ratio

Active
$265,000
4
bds
|
2
ba
|
1,634
sqft
|
built
1949
2905 N Warman Ave, Indianapolis, IN 46222
$135
Cash flow
2.7%
Cash-on-Cash Return
6.9%
Cap rate
0.8%
Rent to Value Ratio
Active
$290,000
3
bds
|
3
ba
|
1,873
sqft
|
built
1890
202 Mc Kim Ave, Indianapolis, IN 46201
$4
Cash flow
0.1%
Cash-on-Cash Return
6.3%
Cap rate
0.8%
Rent to Value Ratio

Active
$130,000
3
bds
|
0
ba
|
0
sqft
|
built
1922
1816 Olive St, Indianapolis, IN 46203
$80
Cash flow
3.2%
Cash-on-Cash Return
7.0%
Cap rate
0.8%
Rent to Value Ratio

Active
$150,000
2
bds
|
1
ba
|
672
sqft
|
built
1949
564 S Bosart Ave, Indianapolis, IN 46203
$114
Cash flow
4.0%
Cash-on-Cash Return
7.2%
Cap rate
0.9%
Rent to Value Ratio
Active
$149,900
2
bds
|
0
ba
|
0
sqft
|
built
1920
1445 Lee St, Indianapolis, IN 46221
$-162
Cash flow
-5.6%
Cash-on-Cash Return
5.0%
Cap rate
0.6%
Rent to Value Ratio
Active
$264,000
3
bds
|
2
ba
|
1,581
sqft
|
built
1908
3227 Guilford Ave, Indianapolis, IN 46205
$-205
Cash flow
-4.1%
Cash-on-Cash Return
5.3%
Cap rate
0.6%
Rent to Value Ratio

Active
$160,000
3
bds
|
1
ba
|
1,311
sqft
|
built
1961
9048 E 36th St, Indianapolis, IN 46235
$131
Cash flow
4.3%
Cash-on-Cash Return
7.2%
Cap rate
0.9%
Rent to Value Ratio
Active
$229,900
2
bds
|
2
ba
|
1,100
sqft
|
built
1983
8158 Shorewalk Dr, Indianapolis, IN 46236
$-354
Cash flow
-8.0%
Cash-on-Cash Return
4.4%
Cap rate
0.8%
Rent to Value Ratio
Active
$339,000
3
bds
|
3
ba
|
2,040
sqft
|
built
2018
4077 Rookwood Ave, Indianapolis, IN 46208
$369
Cash flow
5.7%
Cash-on-Cash Return
7.6%
Cap rate
0.9%
Rent to Value Ratio
Active
$239,900
3
bds
|
1
ba
|
1,637
sqft
|
built
1910
1709 Hoyt Ave, Indianapolis, IN 46203
$128
Cash flow
2.8%
Cash-on-Cash Return
6.9%
Cap rate
0.8%
Rent to Value Ratio
Active
$289,900
3
bds
|
2
ba
|
1,822
sqft
|
built
1900
747 E Mc Carty St, Indianapolis, IN 46203
$5
Cash flow
0.1%
Cash-on-Cash Return
6.3%
Cap rate
0.8%
Rent to Value Ratio

Active
$185,000
3
bds
|
1
ba
|
836
sqft
|
built
1927
531 N Alton Ave, Indianapolis, IN 46222
$0
Cash flow
0.0%
Cash-on-Cash Return
6.3%
Cap rate
0.8%
Rent to Value Ratio

Active
$1,250,000
3
bds
|
4
ba
|
4,070
sqft
|
built
1875
501 Fletcher Ave, Indianapolis, IN 46203
$-4,471
Cash flow
-18.7%
Cash-on-Cash Return
2.0%
Cap rate
0.4%
Rent to Value Ratio
Active
$235,000
3
bds
|
2
ba
|
1,344
sqft
|
built
1919
1016 Churchman Ave, Indianapolis, IN 46203
$567
Cash flow
12.6%
Cash-on-Cash Return
9.2%
Cap rate
1.1%
Rent to Value Ratio
Active
$192,000
3
bds
|
2
ba
|
1,500
sqft
|
built
1991
11106 Wismar Dr, Indianapolis, IN 46235
$240
Cash flow
6.5%
Cash-on-Cash Return
7.8%
Cap rate
0.9%
Rent to Value Ratio

Active
$172,500
2
bds
|
1
ba
|
872
sqft
|
built
1944
3644 N Parker Ave, Indianapolis, IN 46218
$-73
Cash flow
-2.2%
Cash-on-Cash Return
5.8%
Cap rate
0.7%
Rent to Value Ratio
Active
$415,000
3
bds
|
2
ba
|
1,680
sqft
|
built
1926
715 Kessler Boulevard East Dr, Indianapolis, IN 46220
$-580
Cash flow
-7.3%
Cash-on-Cash Return
4.6%
Cap rate
0.6%
Rent to Value Ratio

Active
$319,900
3
bds
|
3
ba
|
1,820
sqft
|
built
1928
6051 Lowell Ave, Indianapolis, IN 46219
$-428
Cash flow
-7.0%
Cash-on-Cash Return
4.7%
Cap rate
0.6%
Rent to Value Ratio
Active
$319,900
3
bds
|
3
ba
|
1,572
sqft
|
built
1955
1338 N Parker Ave, Indianapolis, IN 46201
$-566
Cash flow
-9.2%
Cash-on-Cash Return
4.1%
Cap rate
0.5%
Rent to Value Ratio
Active
$345,900
4
bds
|
2
ba
|
1,552
sqft
|
built
1973
8510 E Mc Gregor Rd, Indianapolis, IN 46259
$-426
Cash flow
-6.4%
Cash-on-Cash Return
4.8%
Cap rate
0.6%
Rent to Value Ratio

Active
$260,000
2
bds
|
0
ba
|
960
sqft
|
built
1950
5159 E Edgewood Ave, Indianapolis, IN 46237
$-253
Cash flow
-5.1%
Cash-on-Cash Return
5.1%
Cap rate
0.6%
Rent to Value Ratio