Indianapolis, IN Investment Properties for Sale
Browse homes for sale and investment properties in Indianapolis, IN. Refine your search by price, property type, or more.
Best cash flowing properties in Indianapolis, IN
Active
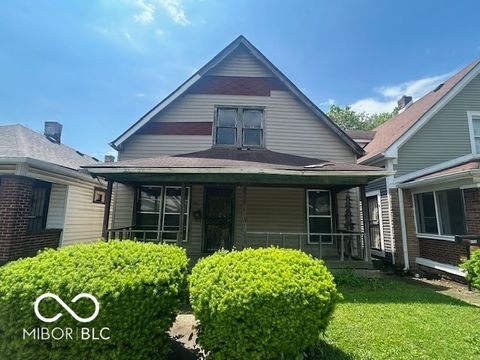
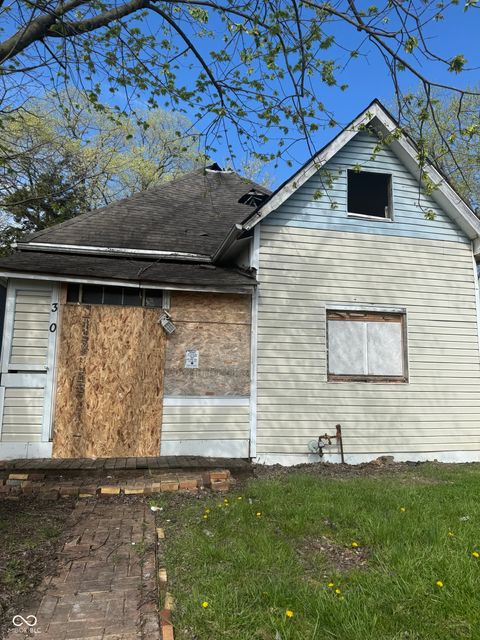
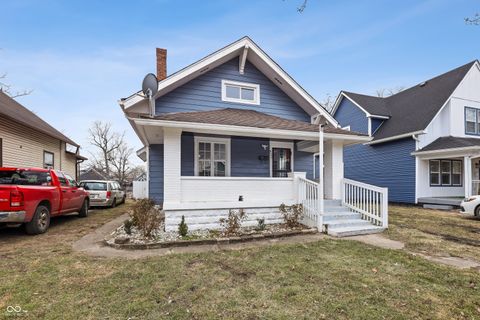
$63,500
3
bds
|
2
ba
|
1,192
sqft
|
built
1920
811 W 25th St, Indianapolis, IN 46208
$966
Cash flow
17.7%
Cash-on-Cash Return
18.3%
Cap rate
2.2%
Rent to Value Ratio
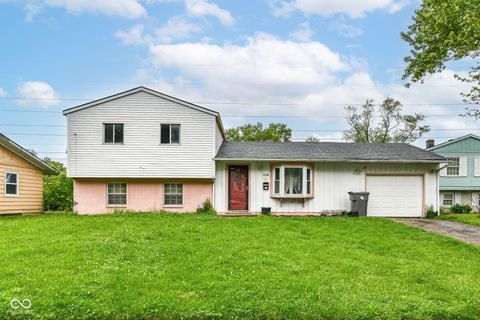
Active
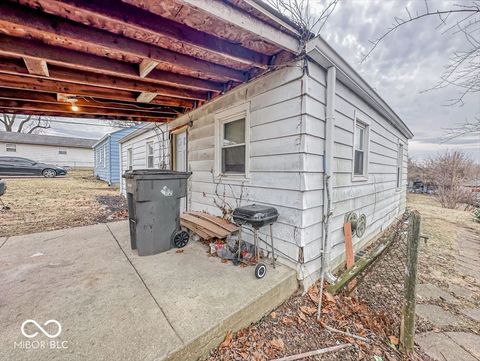
$67,900
2
bds
|
1
ba
|
720
sqft
|
built
1951
2959 N Lasalle St, Indianapolis, IN 46218
$759
Cash flow
13.0%
Cash-on-Cash Return
13.4%
Cap rate
1.6%
Rent to Value Ratio
2,139 out of 2,296 properties for sale in Indianapolis, IN
Limited Results Shown
Create a free account, or log in to reveal all property listings and enjoy the complete experience.
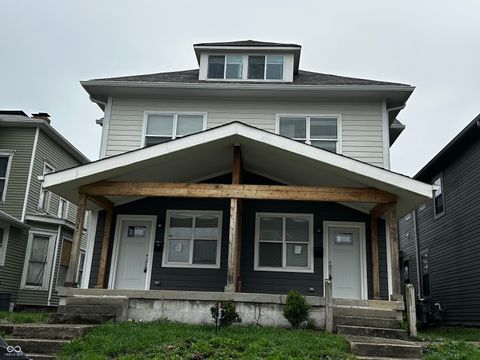
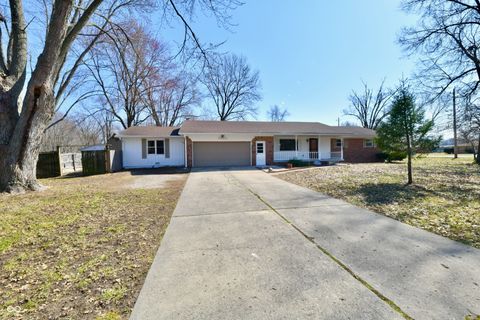
Active
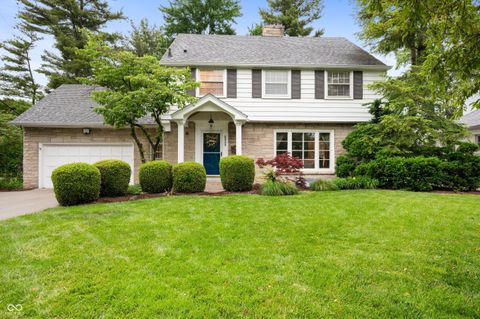
$345,900
4
bds
|
2
ba
|
1,552
sqft
|
built
1973
8510 E Mc Gregor Rd, Indianapolis, IN 46259
$-426
Cash flow
-6.4%
Cash-on-Cash Return
4.8%
Cap rate
0.6%
Rent to Value Ratio

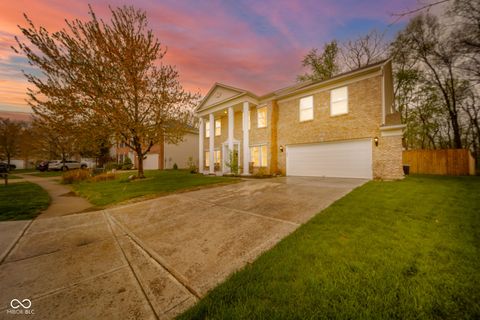
Active
$260,000
2
bds
|
0
ba
|
960
sqft
|
built
1950
5159 E Edgewood Ave, Indianapolis, IN 46237
$-253
Cash flow
-5.1%
Cash-on-Cash Return
5.1%
Cap rate
0.6%
Rent to Value Ratio
Active
$337,000
2
bds
|
0
ba
|
0
sqft
|
built
1955
1701 Woodlawn Ave, Indianapolis, IN 46203
$-517
Cash flow
-8.0%
Cash-on-Cash Return
4.4%
Cap rate
0.5%
Rent to Value Ratio

Active
$599,000
3
bds
|
4
ba
|
2,082
sqft
|
built
1980
239 E 11th St, Indianapolis, IN 46202
$-1,195
Cash flow
-10.4%
Cash-on-Cash Return
3.9%
Cap rate
0.5%
Rent to Value Ratio
Active
$79,000
2
bds
|
1
ba
|
840
sqft
|
built
1910
330 N Lasalle St, Indianapolis, IN 46201
$554
Cash flow
36.6%
Cash-on-Cash Return
14.7%
Cap rate
1.8%
Rent to Value Ratio

Active
$261,900
3
bds
|
2
ba
|
1,440
sqft
|
built
1955
8810 Beechwood Ave, Indianapolis, IN 46219
$151
Cash flow
3.0%
Cash-on-Cash Return
7.0%
Cap rate
0.8%
Rent to Value Ratio
Active
$624,900
4
bds
|
3
ba
|
3,091
sqft
|
built
1942
6020 Gladden Dr, Indianapolis, IN 46220
$-847
Cash flow
-7.1%
Cash-on-Cash Return
4.6%
Cap rate
0.6%
Rent to Value Ratio

Active
$340,000
2
bds
|
2
ba
|
1,120
sqft
|
built
1982
354 E Arch St, Indianapolis, IN 46202
$-398
Cash flow
-6.1%
Cash-on-Cash Return
4.9%
Cap rate
0.7%
Rent to Value Ratio
Active
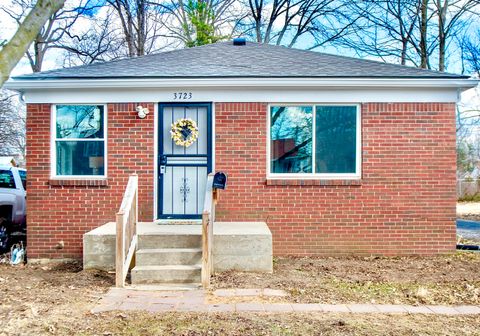
$166,900
2
bds
|
1
ba
|
900
sqft
|
built
1950
3723 N Olney St, Indianapolis, IN 46218
$-43
Cash flow
-1.3%
Cash-on-Cash Return
6.0%
Cap rate
0.7%
Rent to Value Ratio
Active
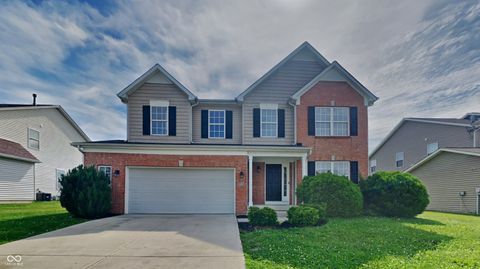
$339,900
4
bds
|
4
ba
|
3,269
sqft
|
built
2009
1305 Gleneagle Dr, Indianapolis, IN 46239
$-83
Cash flow
-1.3%
Cash-on-Cash Return
6.0%
Cap rate
0.7%
Rent to Value Ratio

Active
$294,900
4
bds
|
3
ba
|
1,984
sqft
|
built
2001
7814 Crooked Meadows Dr, Indianapolis, IN 46268
$-52
Cash flow
-0.9%
Cash-on-Cash Return
6.1%
Cap rate
0.7%
Rent to Value Ratio
Active
$330,000
4
bds
|
3
ba
|
1,868
sqft
|
built
1920
832 N Parker Ave, Indianapolis, IN 46201
$2
Cash flow
0.0%
Cash-on-Cash Return
6.3%
Cap rate
0.8%
Rent to Value Ratio

Active
$155,000
3
bds
|
1
ba
|
1,809
sqft
|
built
1949
3305 N Keystone Ave, Indianapolis, IN 46218
$88
Cash flow
3.0%
Cash-on-Cash Return
6.9%
Cap rate
0.8%
Rent to Value Ratio
Active
$164,900
3
bds
|
2
ba
|
2,800
sqft
|
built
1960
6238 E 43rd St, Indianapolis, IN 46226
$381
Cash flow
12.1%
Cash-on-Cash Return
9.0%
Cap rate
1.1%
Rent to Value Ratio

Active
$334,900
4
bds
|
3
ba
|
3,348
sqft
|
built
2011
5145 Greenside Dr, Indianapolis, IN 46235
$6
Cash flow
0.1%
Cash-on-Cash Return
6.3%
Cap rate
0.8%
Rent to Value Ratio

Active
$349,900
3
bds
|
2
ba
|
1,452
sqft
|
built
1988
7838 Chesapeake Dr E, Indianapolis, IN 46236
$-485
Cash flow
-7.2%
Cash-on-Cash Return
4.6%
Cap rate
0.6%
Rent to Value Ratio

Active
$260,000
3
bds
|
2
ba
|
1,688
sqft
|
built
1996
4528 Hunt Master Ct, Indianapolis, IN 46268
$0
Cash flow
0.0%
Cash-on-Cash Return
6.3%
Cap rate
0.8%
Rent to Value Ratio

Active
$153,000
3
bds
|
1
ba
|
960
sqft
|
built
1950
1643 E Tabor St, Indianapolis, IN 46203
$98
Cash flow
3.3%
Cash-on-Cash Return
7.0%
Cap rate
0.8%
Rent to Value Ratio

Active
$263,000
4
bds
|
2
ba
|
2,270
sqft
|
built
1920
234 S State Ave, Indianapolis, IN 46201
$214
Cash flow
4.2%
Cash-on-Cash Return
7.2%
Cap rate
0.9%
Rent to Value Ratio

Active
$359,000
3
bds
|
3
ba
|
2,686
sqft
|
built
1980
7440 Sylvan Ridge Rd, Indianapolis, IN 46240
$-644
Cash flow
-9.4%
Cash-on-Cash Return
4.1%
Cap rate
0.7%
Rent to Value Ratio

Active
$170,000
0
bds
|
0
ba
|
0
sqft
|
built
1920
4918 E New York St, Indianapolis, IN 46201
$-474
Cash flow
-14.5%
Cash-on-Cash Return
2.9%
Cap rate
0.4%
Rent to Value Ratio

Active
$225,000
3
bds
|
2
ba
|
1,379
sqft
|
built
2006
5406 Shamus Dr, Indianapolis, IN 46235
$37
Cash flow
0.9%
Cash-on-Cash Return
6.5%
Cap rate
0.8%
Rent to Value Ratio
Active
$199,900
3
bds
|
3
ba
|
1,400
sqft
|
built
1955
2035 Carrollton Ave, Indianapolis, IN 46202
$60
Cash flow
1.6%
Cash-on-Cash Return
6.6%
Cap rate
0.8%
Rent to Value Ratio

Active
$88,900
2
bds
|
1
ba
|
1,041
sqft
|
built
1925
3610 Robson St, Indianapolis, IN 46201
$295
Cash flow
17.3%
Cash-on-Cash Return
10.2%
Cap rate
1.2%
Rent to Value Ratio

Active
$84,900
2
bds
|
2
ba
|
1,584
sqft
|
built
1911
439 N Colorado Ave, Indianapolis, IN 46201
$316
Cash flow
19.4%
Cash-on-Cash Return
10.7%
Cap rate
1.3%
Rent to Value Ratio
Active
$405,000
4
bds
|
3
ba
|
4,040
sqft
|
built
2005
10090 Eagle Eye Way, Indianapolis, IN 46234
$-228
Cash flow
-2.9%
Cash-on-Cash Return
5.6%
Cap rate
0.7%
Rent to Value Ratio
Active
$275,000
4
bds
|
3
ba
|
1,901
sqft
|
built
1966
7953 Forest Park Dr, Indianapolis, IN 46217
$-263
Cash flow
-5.0%
Cash-on-Cash Return
5.1%
Cap rate
0.6%
Rent to Value Ratio
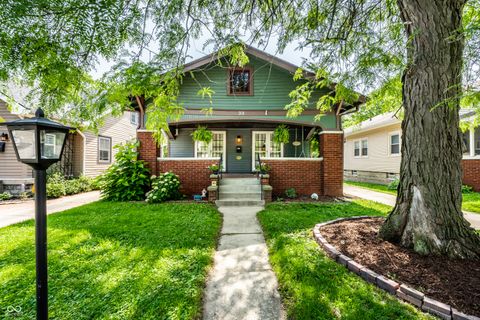
Active
$285,000
3
bds
|
2
ba
|
1,688
sqft
|
built
1920
33 N Webster Ave, Indianapolis, IN 46219
$30
Cash flow
0.5%
Cash-on-Cash Return
6.4%
Cap rate
0.8%
Rent to Value Ratio
Active
$495,000
4
bds
|
4
ba
|
2,720
sqft
|
built
1921
1048 Saint Peter St, Indianapolis, IN 46203
$107
Cash flow
1.1%
Cash-on-Cash Return
6.5%
Cap rate
0.8%
Rent to Value Ratio
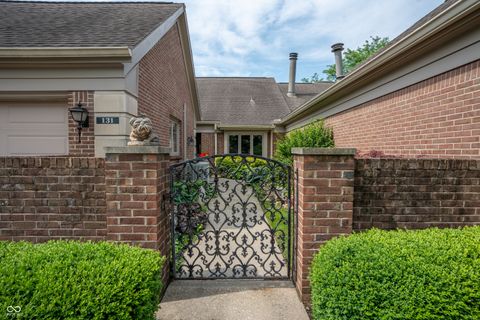
Active
$534,900
2
bds
|
2
ba
|
1,916
sqft
|
built
1983
131 Olde Mill Bay, Indianapolis, IN 46260
$-1,835
Cash flow
-17.9%
Cash-on-Cash Return
2.1%
Cap rate
0.5%
Rent to Value Ratio
Active
$63,500
3
bds
|
2
ba
|
1,192
sqft
|
built
1920
811 W 25th St, Indianapolis, IN 46208
$966
Cash flow
17.7%
Cash-on-Cash Return
18.3%
Cap rate
2.2%
Rent to Value Ratio

Active
$199,000
4
bds
|
1
ba
|
1,500
sqft
|
built
1955
3161 Normandy Rd, Indianapolis, IN 46222
$65
Cash flow
1.7%
Cash-on-Cash Return
6.7%
Cap rate
0.8%
Rent to Value Ratio
Active
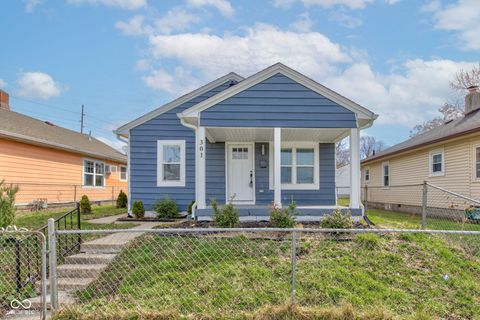
$226,900
3
bds
|
2
ba
|
1,139
sqft
|
built
1916
301 Villa Ave, Indianapolis, IN 46201
$195
Cash flow
4.5%
Cash-on-Cash Return
7.3%
Cap rate
0.9%
Rent to Value Ratio

Active
$525,000
1
bds
|
0
ba
|
0
sqft
|
built
1922
6038 N College Ave, Indianapolis, IN 46220
$-1,568
Cash flow
-15.6%
Cash-on-Cash Return
2.7%
Cap rate
0.3%
Rent to Value Ratio
Active
$319,900
2
bds
|
2
ba
|
1,323
sqft
|
built
1890
1002 N New Jersey St, Indianapolis, IN 46202
$-525
Cash flow
-8.6%
Cash-on-Cash Return
4.3%
Cap rate
0.7%
Rent to Value Ratio
Active
$339,900
3
bds
|
3
ba
|
2,960
sqft
|
built
1977
1053 Millwood Ct, Indianapolis, IN 46260
$-828
Cash flow
-12.7%
Cash-on-Cash Return
3.3%
Cap rate
0.6%
Rent to Value Ratio
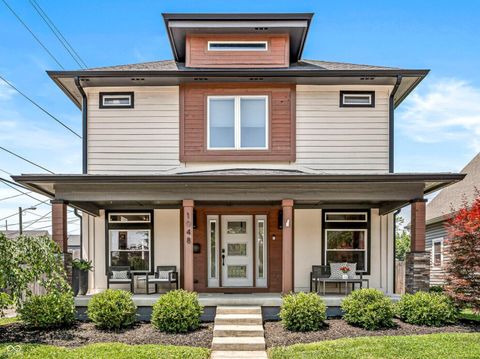
Active
$489,000
3
bds
|
3
ba
|
2,125
sqft
|
built
2021
401 Sanders St, Indianapolis, IN 46225
$-138
Cash flow
-1.5%
Cash-on-Cash Return
5.9%
Cap rate
0.7%
Rent to Value Ratio

Active
$173,000
2
bds
|
2
ba
|
1,124
sqft
|
built
2003
4925 Opal Ridge Ln, Indianapolis, IN 46237
$-174
Cash flow
-5.2%
Cash-on-Cash Return
5.1%
Cap rate
0.8%
Rent to Value Ratio
Active
$67,900
2
bds
|
1
ba
|
720
sqft
|
built
1951
2959 N Lasalle St, Indianapolis, IN 46218
$759
Cash flow
13.0%
Cash-on-Cash Return
13.4%
Cap rate
1.6%
Rent to Value Ratio
Active
$449,990
4
bds
|
3
ba
|
2,660
sqft
|
built
1975
9205 Selkirk Ct, Indianapolis, IN 46260
$-897
Cash flow
-10.4%
Cash-on-Cash Return
3.9%
Cap rate
0.5%
Rent to Value Ratio