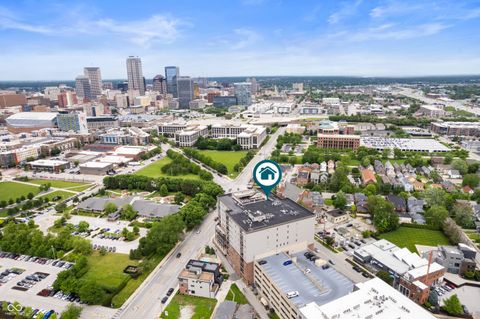
Indianapolis, IN Investment Properties for Sale
Browse homes for sale and investment properties in Indianapolis, IN. Refine your search by price, property type, or more.
Best cash flowing properties in Indianapolis, IN
Active
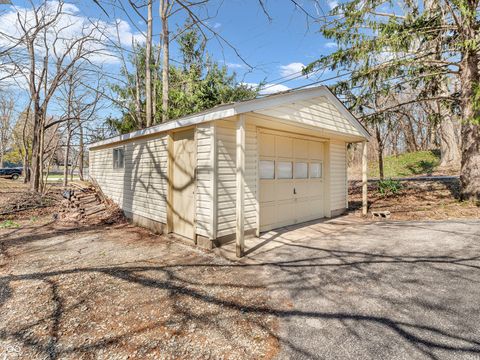
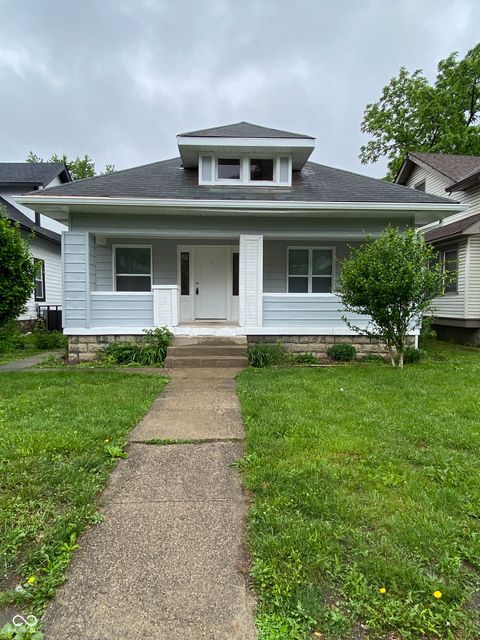
$380,000
3
bds
|
4
ba
|
4,080
sqft
|
built
1827
7540 S Mooresville Rd, Indianapolis, IN 46221
$431
Cash flow
5.9%
Cash-on-Cash Return
7.6%
Cap rate
0.9%
Rent to Value Ratio
Active
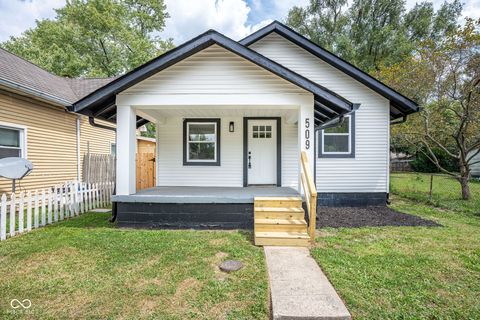
$190,000
2
bds
|
2
ba
|
900
sqft
|
built
1955
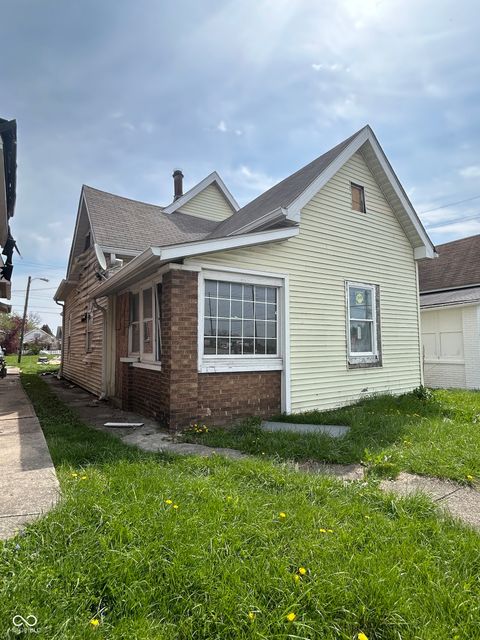
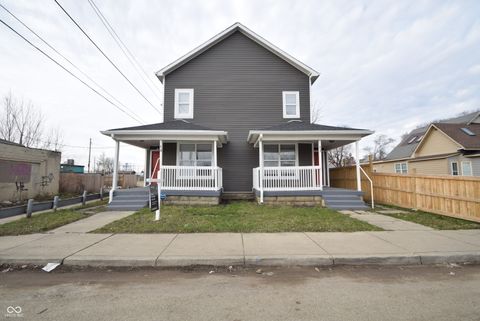
509 Saint Paul St, Indianapolis, IN 46203
$388
Cash flow
10.7%
Cash-on-Cash Return
8.7%
Cap rate
1.1%
Rent to Value Ratio
2,136 out of 2,292 properties for sale in Indianapolis, IN
Limited Results Shown
Create a free account, or log in to reveal all property listings and enjoy the complete experience.
Active
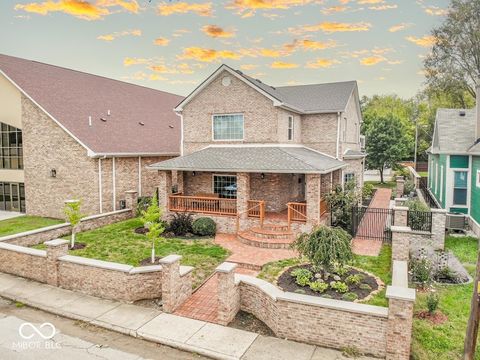
$899,900
4
bds
|
5
ba
|
3,871
sqft
|
built
1988
1817 Bellefontaine St, Indianapolis, IN 46202
$-903
Cash flow
-5.2%
Cash-on-Cash Return
5.1%
Cap rate
0.6%
Rent to Value Ratio
Active
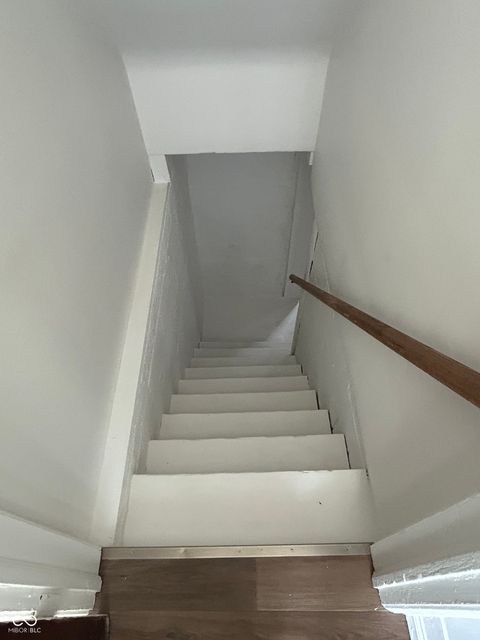
$190,000
2
bds
|
2
ba
|
900
sqft
|
built
1955
509 Saint Paul St, Indianapolis, IN 46203
$388
Cash flow
10.7%
Cash-on-Cash Return
8.7%
Cap rate
1.1%
Rent to Value Ratio

Active
$185,000
4
bds
|
2
ba
|
1,440
sqft
|
built
1930
3308 Schofield Ave, Indianapolis, IN 46218
$138
Cash flow
3.9%
Cash-on-Cash Return
7.2%
Cap rate
0.9%
Rent to Value Ratio
Active
$169,500
2
bds
|
1
ba
|
789
sqft
|
built
1941
330 S Butler Ave, Indianapolis, IN 46219
$81
Cash flow
2.5%
Cash-on-Cash Return
6.8%
Cap rate
0.8%
Rent to Value Ratio
Active
$160,000
3
bds
|
2
ba
|
1,584
sqft
|
built
1955
2157 S Meridian St, Indianapolis, IN 46225
$269
Cash flow
8.8%
Cash-on-Cash Return
8.3%
Cap rate
1.0%
Rent to Value Ratio

Active
$189,900
2
bds
|
1
ba
|
832
sqft
|
built
1920
5206 E Saint Clair St, Indianapolis, IN 46219
$113
Cash flow
3.1%
Cash-on-Cash Return
7.0%
Cap rate
0.8%
Rent to Value Ratio
Active
$169,000
3
bds
|
2
ba
|
1,530
sqft
|
built
1911
19 Parkview Ave, Indianapolis, IN 46201
$-399
Cash flow
-12.3%
Cash-on-Cash Return
3.4%
Cap rate
0.4%
Rent to Value Ratio

Active
$134,900
2
bds
|
1
ba
|
936
sqft
|
built
1928
1168 N Gladstone Ave, Indianapolis, IN 46201
$262
Cash flow
10.1%
Cash-on-Cash Return
8.6%
Cap rate
1.0%
Rent to Value Ratio
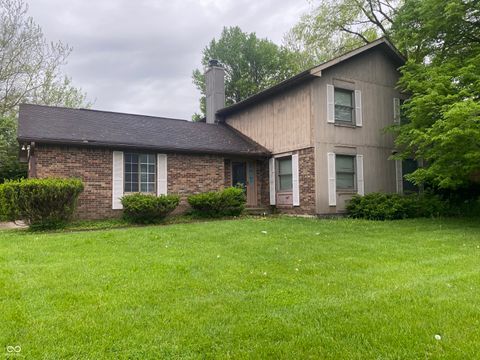
Active
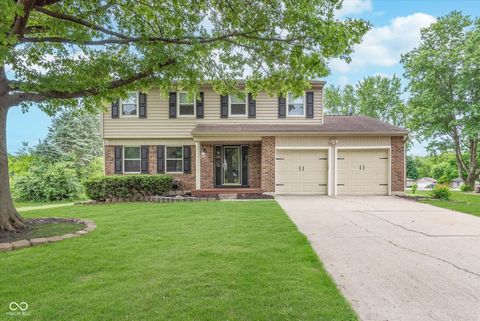
$334,900
4
bds
|
3
ba
|
2,055
sqft
|
built
1969
7731 Scarborough Blvd South Dr, Indianapolis, IN 46256
$-23
Cash flow
-0.4%
Cash-on-Cash Return
6.2%
Cap rate
0.7%
Rent to Value Ratio
Active
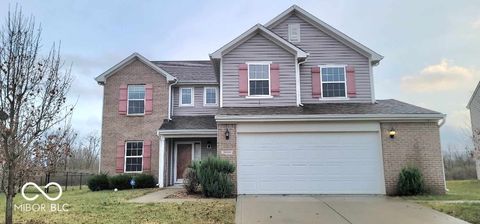
$359,900
5
bds
|
3
ba
|
2,510
sqft
|
built
2022
10125 Caprock Canyon Dr, Indianapolis, IN 46229
$-183
Cash flow
-2.7%
Cash-on-Cash Return
5.7%
Cap rate
0.7%
Rent to Value Ratio
Active
$400,000
4
bds
|
3
ba
|
2,865
sqft
|
built
1974
8205 Picadilly Ln, Indianapolis, IN 46256
$-395
Cash flow
-5.2%
Cash-on-Cash Return
5.1%
Cap rate
0.6%
Rent to Value Ratio
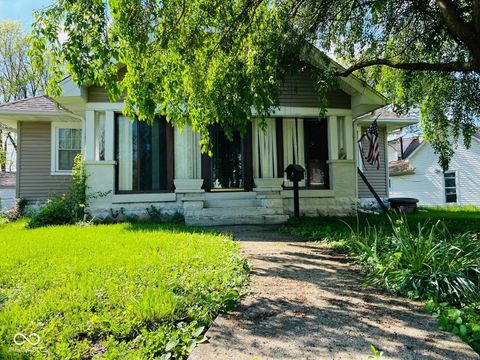
Active
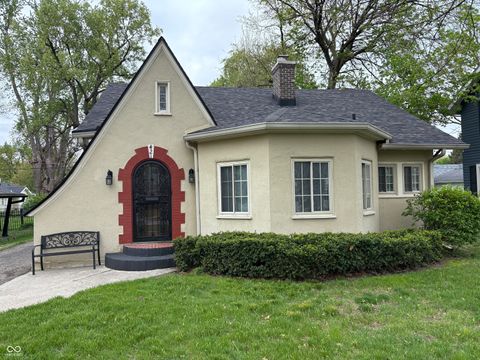
$319,900
2
bds
|
1
ba
|
996
sqft
|
built
1925
421 W 44th St, Indianapolis, IN 46208
$-290
Cash flow
-4.7%
Cash-on-Cash Return
5.2%
Cap rate
0.6%
Rent to Value Ratio
Active
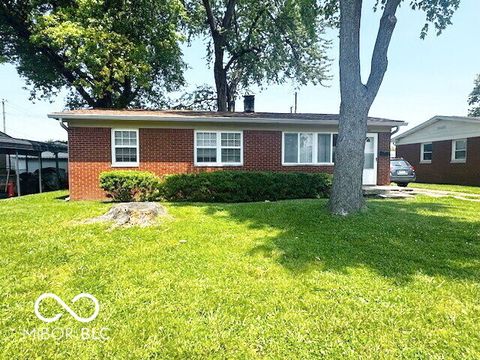
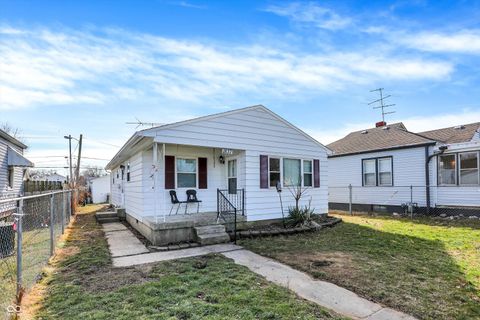
$166,000
3
bds
|
1
ba
|
975
sqft
|
built
1959
1820 Martin St, Indianapolis, IN 46237
$99
Cash flow
3.1%
Cash-on-Cash Return
7.0%
Cap rate
0.8%
Rent to Value Ratio
Active
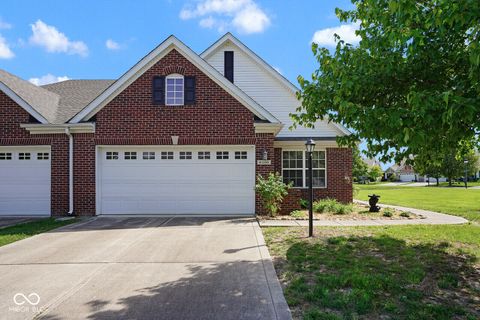
$259,900
3
bds
|
2
ba
|
1,634
sqft
|
built
2005
6105 Franklin Villas Way, Indianapolis, IN 46237
$-215
Cash flow
-4.3%
Cash-on-Cash Return
5.3%
Cap rate
0.7%
Rent to Value Ratio
Active
$339,000
2
bds
|
0
ba
|
0
sqft
|
built
1900
10 N Keystone Ave, Indianapolis, IN 46201
$-1,011
Cash flow
-15.6%
Cash-on-Cash Return
2.7%
Cap rate
0.3%
Rent to Value Ratio

Active
$235,000
3
bds
|
1
ba
|
1,640
sqft
|
built
2009
2114 N Dexter St, Indianapolis, IN 46202
$153
Cash flow
3.4%
Cash-on-Cash Return
7.0%
Cap rate
0.9%
Rent to Value Ratio

Active
$479,000
5
bds
|
3
ba
|
3,214
sqft
|
built
2022
7414 Glen Park Ln, Indianapolis, IN 46259
$130
Cash flow
1.4%
Cash-on-Cash Return
6.6%
Cap rate
0.8%
Rent to Value Ratio
Active
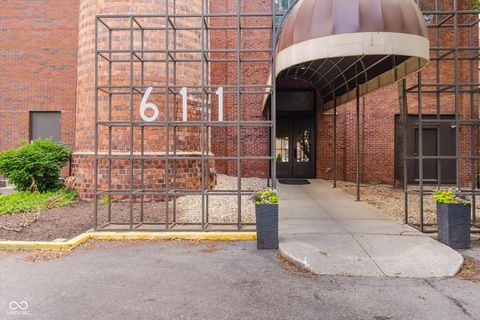
$400,000
2
bds
|
2
ba
|
1,230
sqft
|
built
1926
611 N Park Ave, Indianapolis, IN 46204
$-1,036
Cash flow
-13.5%
Cash-on-Cash Return
3.2%
Cap rate
0.6%
Rent to Value Ratio
Active
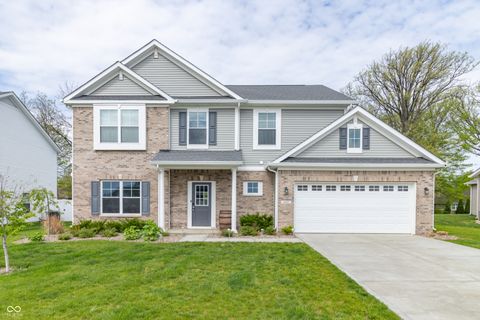
$391,900
4
bds
|
3
ba
|
2,728
sqft
|
built
2022
192 Lynnette Way, Indianapolis, IN 46229
$-154
Cash flow
-2.1%
Cash-on-Cash Return
5.8%
Cap rate
0.7%
Rent to Value Ratio
Active
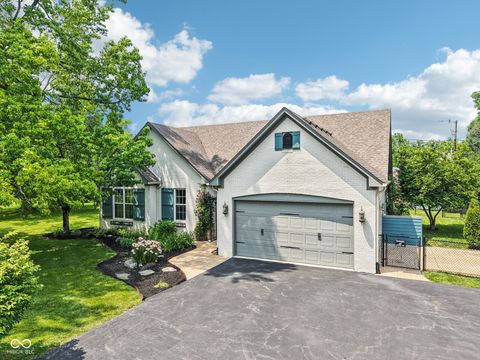
$464,900
4
bds
|
2
ba
|
2,150
sqft
|
built
1995
10444 Indian Lake Blvd N, Indianapolis, IN 46236
$-702
Cash flow
-7.9%
Cash-on-Cash Return
4.5%
Cap rate
0.5%
Rent to Value Ratio
Active
$185,000
2
bds
|
1
ba
|
1,296
sqft
|
built
1913
802 N Oakland Ave, Indianapolis, IN 46201
$-276
Cash flow
-7.8%
Cash-on-Cash Return
4.5%
Cap rate
0.5%
Rent to Value Ratio

Active
$275,000
2
bds
|
2
ba
|
1,507
sqft
|
built
2018
6026 Rockdell Dr, Indianapolis, IN 46237
$-97
Cash flow
-1.8%
Cash-on-Cash Return
5.8%
Cap rate
0.7%
Rent to Value Ratio
Active
$339,900
4
bds
|
3
ba
|
2,408
sqft
|
built
2019
7303 Beal Ln, Indianapolis, IN 46217
$-285
Cash flow
-4.4%
Cash-on-Cash Return
5.3%
Cap rate
0.6%
Rent to Value Ratio
Active
$304,900
3
bds
|
2
ba
|
1,894
sqft
|
built
2018
4323 Stubbington Ln, Indianapolis, IN 46239
$-128
Cash flow
-2.2%
Cash-on-Cash Return
5.8%
Cap rate
0.7%
Rent to Value Ratio
Active
$249,900
3
bds
|
3
ba
|
1,766
sqft
|
built
2001
10722 Mistflower Way, Indianapolis, IN 46235
$-93
Cash flow
-1.9%
Cash-on-Cash Return
5.8%
Cap rate
0.7%
Rent to Value Ratio
Active
$234,000
3
bds
|
3
ba
|
1,740
sqft
|
built
1977
3202 Acacia Dr, Indianapolis, IN 46214
$158
Cash flow
3.5%
Cash-on-Cash Return
7.1%
Cap rate
0.9%
Rent to Value Ratio
Active
$241,000
4
bds
|
1
ba
|
1,780
sqft
|
built
1923
4850 University Ave, Indianapolis, IN 46201
$-292
Cash flow
-6.3%
Cash-on-Cash Return
4.8%
Cap rate
0.6%
Rent to Value Ratio
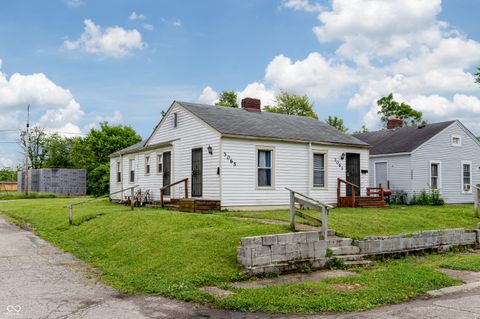
Active
$129,000
0
bds
|
0
ba
|
0
sqft
|
built
1942
3065 N Colorado Ave, Indianapolis, IN 46218
$-121
Cash flow
-4.9%
Cash-on-Cash Return
5.1%
Cap rate
0.6%
Rent to Value Ratio
Active
$205,000
3
bds
|
2
ba
|
1,270
sqft
|
built
1913
2729 Massachusetts Ave, Indianapolis, IN 46218
$-380
Cash flow
-9.7%
Cash-on-Cash Return
4.0%
Cap rate
0.5%
Rent to Value Ratio
Active
$380,000
3
bds
|
4
ba
|
4,080
sqft
|
built
1827
7540 S Mooresville Rd, Indianapolis, IN 46221
$431
Cash flow
5.9%
Cash-on-Cash Return
7.6%
Cap rate
0.9%
Rent to Value Ratio
Active
$765,000
3
bds
|
3
ba
|
2,080
sqft
|
built
2006
435 Virginia Ave, Indianapolis, IN 46203
$-2,463
Cash flow
-16.8%
Cash-on-Cash Return
2.4%
Cap rate
0.5%
Rent to Value Ratio

Active
$220,000
4
bds
|
3
ba
|
1,760
sqft
|
built
1910
59 E Troy Ave, Indianapolis, IN 46225
$-459
Cash flow
-10.9%
Cash-on-Cash Return
3.8%
Cap rate
0.5%
Rent to Value Ratio
Active
$439,000
3
bds
|
3
ba
|
2,152
sqft
|
built
1885
1627 Pleasant St, Indianapolis, IN 46203
$-153
Cash flow
-1.8%
Cash-on-Cash Return
5.8%
Cap rate
0.7%
Rent to Value Ratio
Active
$310,000
3
bds
|
2
ba
|
1,806
sqft
|
built
1974
813 Boulder Rd, Indianapolis, IN 46217
$-334
Cash flow
-5.6%
Cash-on-Cash Return
5.0%
Cap rate
0.6%
Rent to Value Ratio
Active
$244,000
3
bds
|
2
ba
|
1,542
sqft
|
built
1910
2230 Pleasant St, Indianapolis, IN 46203
$37
Cash flow
0.8%
Cash-on-Cash Return
6.4%
Cap rate
0.8%
Rent to Value Ratio
Active
$320,000
4
bds
|
3
ba
|
2,099
sqft
|
built
2016
3801 Boundary Bay Dr, Indianapolis, IN 46217
$-329
Cash flow
-5.4%
Cash-on-Cash Return
5.0%
Cap rate
0.6%
Rent to Value Ratio

Active
$1,200,000
5
bds
|
4
ba
|
3,362
sqft
|
built
1991
8151 E Southport Rd, Indianapolis, IN 46259
$-3,229
Cash flow
-14.0%
Cash-on-Cash Return
3.0%
Cap rate
0.4%
Rent to Value Ratio

Active
$299,900
4
bds
|
3
ba
|
2,357
sqft
|
built
1972
1641 Whistler Ter, Indianapolis, IN 46229
$-324
Cash flow
-5.6%
Cash-on-Cash Return
5.0%
Cap rate
0.6%
Rent to Value Ratio
Active
$289,900
3
bds
|
3
ba
|
1,848
sqft
|
built
1998
6412 Cradle River Dr, Indianapolis, IN 46221
$-292
Cash flow
-5.3%
Cash-on-Cash Return
5.1%
Cap rate
0.6%
Rent to Value Ratio
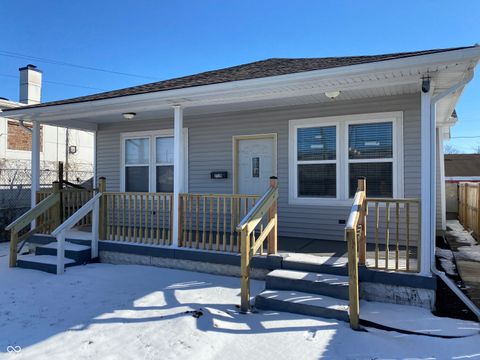
Active
$169,990
3
bds
|
1
ba
|
1,060
sqft
|
built
1962
1837 E Legrande Ave, Indianapolis, IN 46203
$79
Cash flow
2.4%
Cash-on-Cash Return
6.8%
Cap rate
0.8%
Rent to Value Ratio