Indianapolis, IN Investment Properties for Sale
Browse homes for sale and investment properties in Indianapolis, IN. Refine your search by price, property type, or more.
Best cash flowing properties in Indianapolis, IN
Active
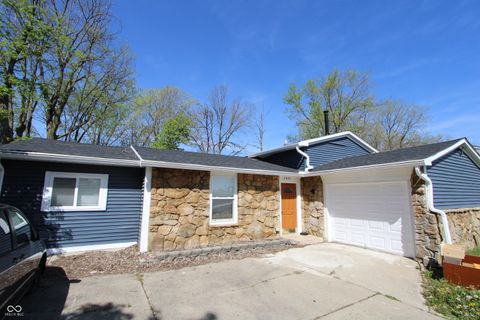
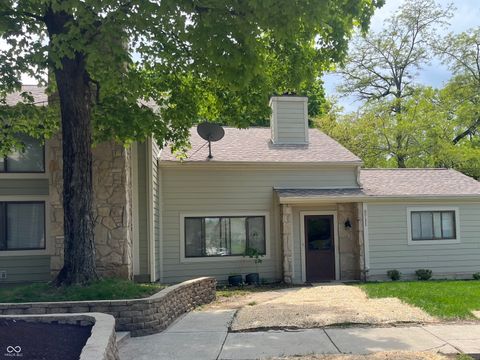
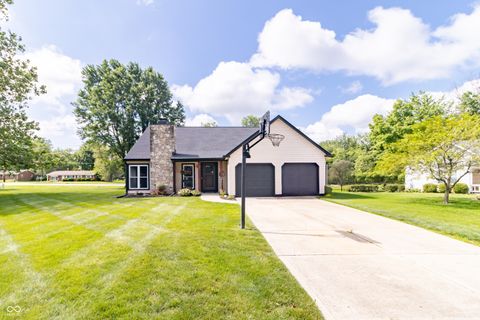
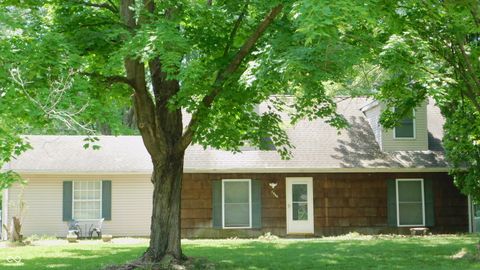
$169,900
4
bds
|
2
ba
|
1,950
sqft
|
built
1978
3836 N Wittfield St, Indianapolis, IN 46235
$510
Cash flow
15.7%
Cash-on-Cash Return
9.7%
Cap rate
1.2%
Rent to Value Ratio
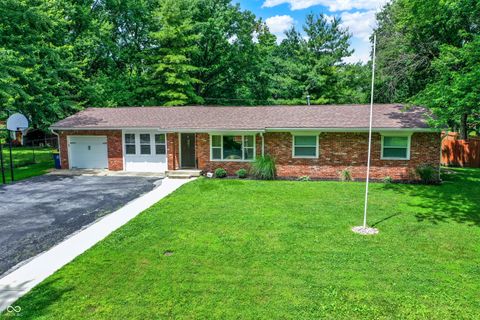
Active
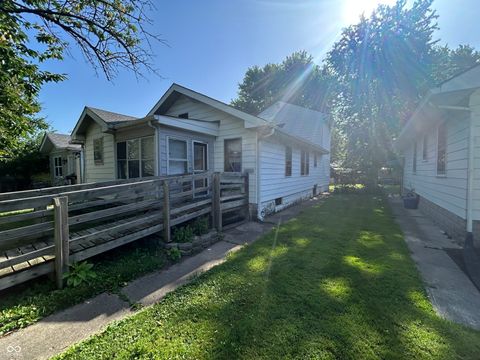
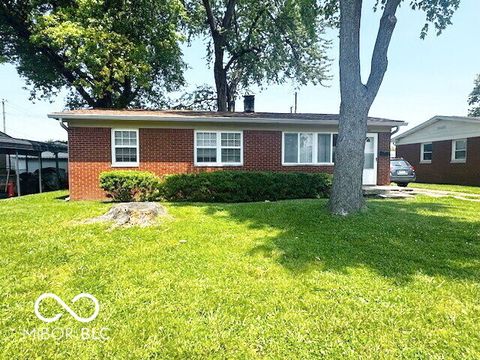
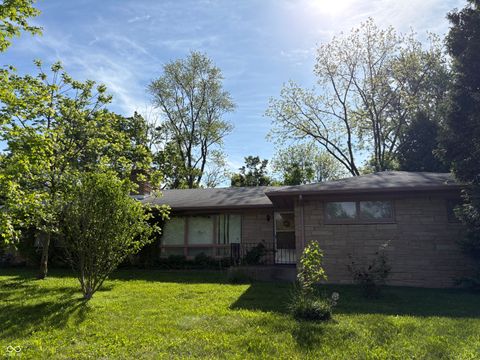
$130,000
3
bds
|
2
ba
|
1,464
sqft
|
built
1926
2509 S New Jersey St, Indianapolis, IN 46225
$438
Cash flow
17.6%
Cash-on-Cash Return
10.2%
Cap rate
1.2%
Rent to Value Ratio
2,136 out of 2,292 properties for sale in Indianapolis, IN
Limited Results Shown
Create a free account, or log in to reveal all property listings and enjoy the complete experience.
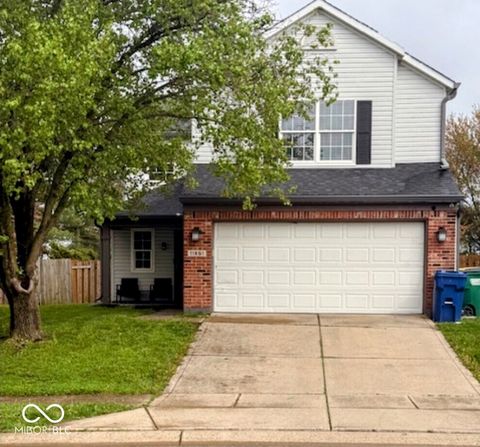
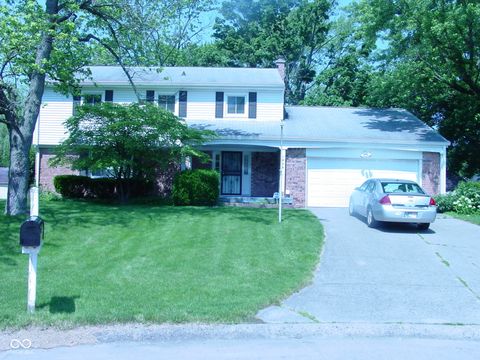
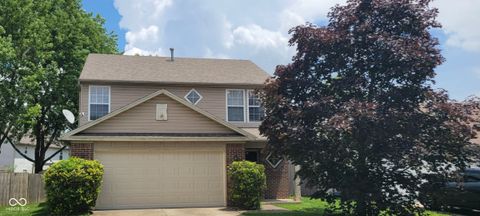
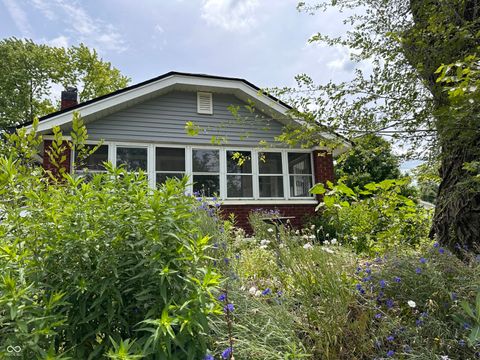
Active
$230,000
4
bds
|
3
ba
|
1,962
sqft
|
built
1999
11651 Congressional Ln, Indianapolis, IN 46235
$150
Cash flow
3.4%
Cash-on-Cash Return
7.0%
Cap rate
0.9%
Rent to Value Ratio
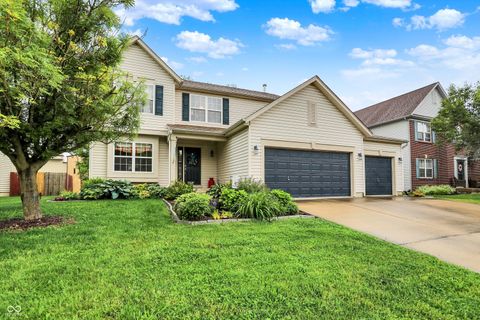
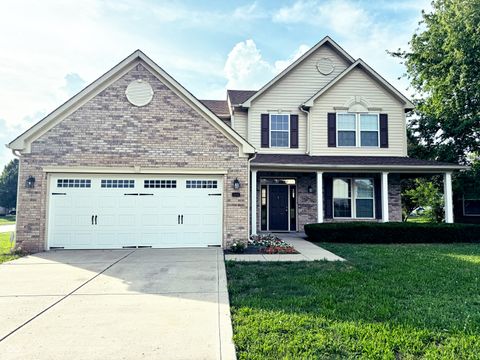
Active
$325,000
4
bds
|
3
ba
|
2,178
sqft
|
built
2001
2623 Senators Way, Indianapolis, IN 46217
$-479
Cash flow
-7.7%
Cash-on-Cash Return
4.5%
Cap rate
0.6%
Rent to Value Ratio
Active
$134,900
2
bds
|
2
ba
|
1,109
sqft
|
built
1978
5711 Bradston Way, Indianapolis, IN 46237
$-11
Cash flow
-0.4%
Cash-on-Cash Return
6.2%
Cap rate
1.0%
Rent to Value Ratio
Active
$166,000
3
bds
|
1
ba
|
975
sqft
|
built
1959
1820 Martin St, Indianapolis, IN 46237
$99
Cash flow
3.1%
Cash-on-Cash Return
7.0%
Cap rate
0.8%
Rent to Value Ratio
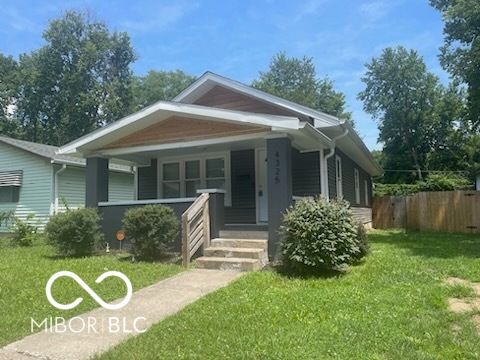
Active
$170,000
3
bds
|
1
ba
|
824
sqft
|
built
1926
4325 Norwaldo Ave, Indianapolis, IN 46205
$216
Cash flow
6.6%
Cash-on-Cash Return
7.8%
Cap rate
0.9%
Rent to Value Ratio
Active
$195,000
3
bds
|
1
ba
|
1,230
sqft
|
built
1967
821 S Worth Ave, Indianapolis, IN 46241
$-121
Cash flow
-3.2%
Cash-on-Cash Return
5.5%
Cap rate
0.7%
Rent to Value Ratio
Active
$220,000
2
bds
|
1
ba
|
1,240
sqft
|
built
1952
120 Hoss Rd, Indianapolis, IN 46217
$-45
Cash flow
-1.1%
Cash-on-Cash Return
6.0%
Cap rate
0.7%
Rent to Value Ratio

Active
$299,900
4
bds
|
3
ba
|
2,357
sqft
|
built
1972
1641 Whistler Ter, Indianapolis, IN 46229
$-324
Cash flow
-5.6%
Cash-on-Cash Return
5.0%
Cap rate
0.6%
Rent to Value Ratio

Active
$174,900
3
bds
|
1
ba
|
1,073
sqft
|
built
1959
1716 Arlene Dr, Indianapolis, IN 46219
$53
Cash flow
1.6%
Cash-on-Cash Return
6.6%
Cap rate
0.8%
Rent to Value Ratio
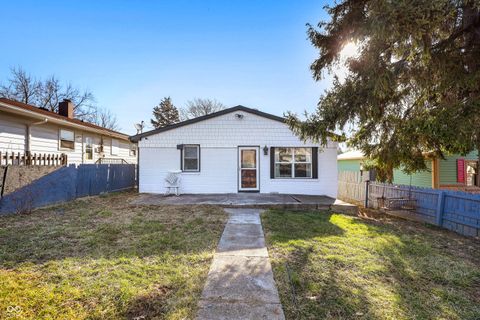
Active
$120,000
3
bds
|
1
ba
|
816
sqft
|
built
1955
1617 E Kelly St, Indianapolis, IN 46203
$340
Cash flow
14.8%
Cash-on-Cash Return
9.7%
Cap rate
1.2%
Rent to Value Ratio
Active
$339,000
2
bds
|
0
ba
|
0
sqft
|
built
1900
10 N Keystone Ave, Indianapolis, IN 46201
$-1,011
Cash flow
-15.6%
Cash-on-Cash Return
2.7%
Cap rate
0.3%
Rent to Value Ratio

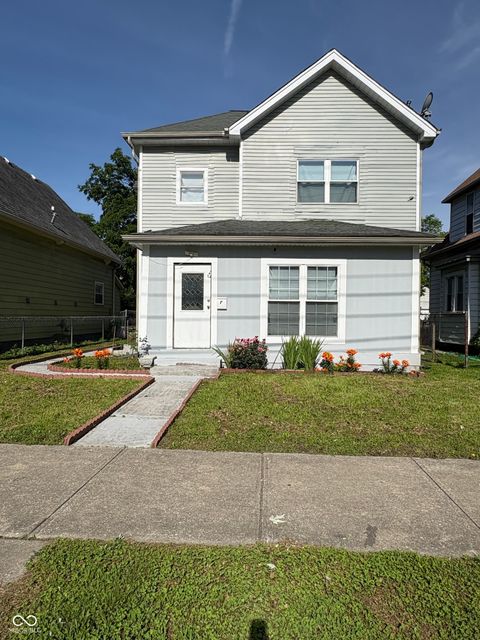
Active
$235,000
3
bds
|
1
ba
|
1,640
sqft
|
built
2009
2114 N Dexter St, Indianapolis, IN 46202
$153
Cash flow
3.4%
Cash-on-Cash Return
7.0%
Cap rate
0.9%
Rent to Value Ratio
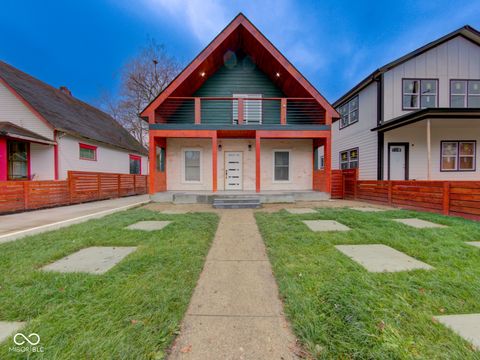
Active
$194,900
3
bds
|
2
ba
|
1,691
sqft
|
built
1911
806 N Gray St, Indianapolis, IN 46201
$175
Cash flow
4.7%
Cash-on-Cash Return
7.2%
Cap rate
0.9%
Rent to Value Ratio
Active
$299,000
3
bds
|
2
ba
|
1,469
sqft
|
built
1969
3841 Meridee Dr, Indianapolis, IN 46237
$-290
Cash flow
-5.1%
Cash-on-Cash Return
5.0%
Cap rate
0.6%
Rent to Value Ratio
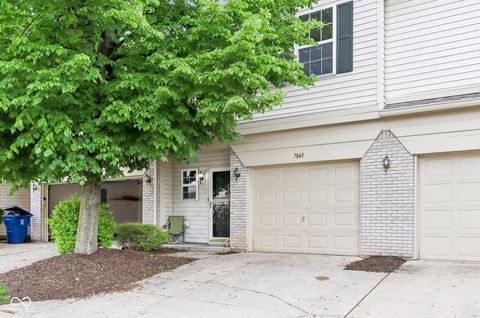
Active
$205,000
2
bds
|
3
ba
|
1,304
sqft
|
built
2001
7045 Gavin Dr, Indianapolis, IN 46217
$-379
Cash flow
-9.6%
Cash-on-Cash Return
3.9%
Cap rate
0.7%
Rent to Value Ratio
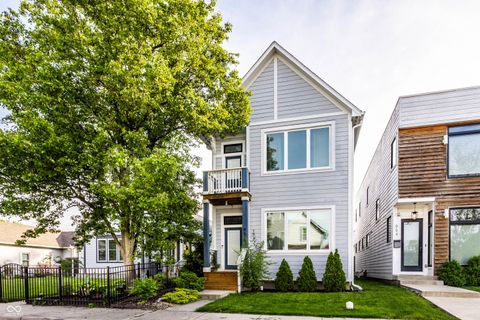
Active
$515,000
3
bds
|
4
ba
|
2,200
sqft
|
built
2017
952 Elm St, Indianapolis, IN 46203
$-430
Cash flow
-4.4%
Cash-on-Cash Return
5.1%
Cap rate
0.6%
Rent to Value Ratio
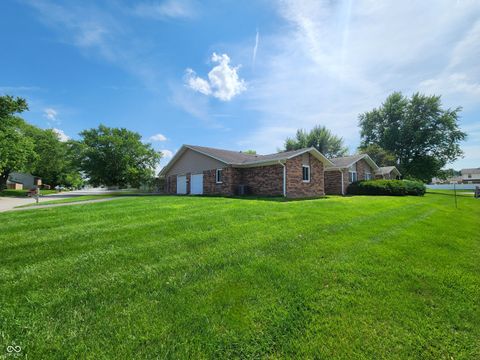
Active
$149,500
2
bds
|
2
ba
|
1,182
sqft
|
built
1974
3415 Winchester Dr, Indianapolis, IN 46227
$-65
Cash flow
-2.3%
Cash-on-Cash Return
5.6%
Cap rate
0.9%
Rent to Value Ratio
Active
$795,000
4
bds
|
5
ba
|
3,688
sqft
|
built
1956
6465 Lawrence Dr, Indianapolis, IN 46226
$-2,685
Cash flow
-17.6%
Cash-on-Cash Return
2.1%
Cap rate
0.4%
Rent to Value Ratio
Active
$360,000
3
bds
|
2
ba
|
1,574
sqft
|
built
1997
5943 Red Maple Dr, Indianapolis, IN 46237
$-485
Cash flow
-7.0%
Cash-on-Cash Return
4.5%
Cap rate
0.6%
Rent to Value Ratio
Active
$290,000
3
bds
|
3
ba
|
1,680
sqft
|
built
1993
6439 Bower Dr, Indianapolis, IN 46241
$-244
Cash flow
-4.4%
Cash-on-Cash Return
5.1%
Cap rate
0.6%
Rent to Value Ratio
Active
$275,000
3
bds
|
1
ba
|
1,440
sqft
|
built
1958
7125 Chandler Dr, Indianapolis, IN 46217
$-305
Cash flow
-5.8%
Cash-on-Cash Return
4.8%
Cap rate
0.6%
Rent to Value Ratio
Active
$319,000
2
bds
|
2
ba
|
1,836
sqft
|
built
2014
5932 Edelle Dr, Indianapolis, IN 46237
$-303
Cash flow
-5.0%
Cash-on-Cash Return
5.0%
Cap rate
0.6%
Rent to Value Ratio
Active
$143,000
3
bds
|
1
ba
|
1,214
sqft
|
built
1930
435 N Rural St, Indianapolis, IN 46201
$95
Cash flow
3.5%
Cash-on-Cash Return
6.9%
Cap rate
0.8%
Rent to Value Ratio

Active
$345,000
3
bds
|
2
ba
|
1,964
sqft
|
built
2017
8820 Hemingway Dr, Indianapolis, IN 46239
$-42
Cash flow
-0.6%
Cash-on-Cash Return
6.0%
Cap rate
0.7%
Rent to Value Ratio
Active
$125,000
2
bds
|
1
ba
|
744
sqft
|
built
1954
8210 Patton Dr, Indianapolis, IN 46226
$326
Cash flow
13.6%
Cash-on-Cash Return
9.3%
Cap rate
1.1%
Rent to Value Ratio
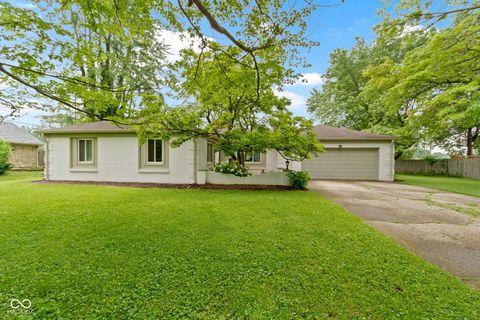
Active
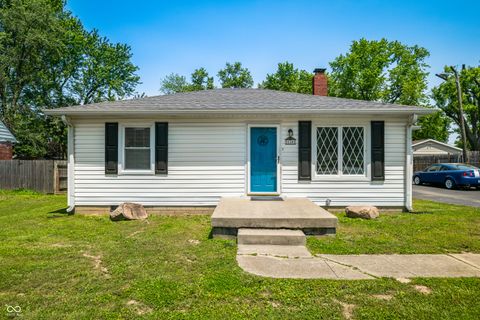
$169,900
4
bds
|
2
ba
|
1,950
sqft
|
built
1978
3836 N Wittfield St, Indianapolis, IN 46235
$510
Cash flow
15.7%
Cash-on-Cash Return
9.7%
Cap rate
1.2%
Rent to Value Ratio
Active
$699,900
3
bds
|
4
ba
|
2,511
sqft
|
built
1928
5760 Central Ave, Indianapolis, IN 46220
$-1,446
Cash flow
-10.8%
Cash-on-Cash Return
3.7%
Cap rate
0.4%
Rent to Value Ratio
Active
$329,500
4
bds
|
3
ba
|
2,360
sqft
|
built
1968
1808 Orchid Ct, Indianapolis, IN 46219
$-308
Cash flow
-4.9%
Cash-on-Cash Return
5.0%
Cap rate
0.6%
Rent to Value Ratio
Active
$314,000
3
bds
|
3
ba
|
2,640
sqft
|
built
2007
2444 Cole Branch Ct, Indianapolis, IN 46239
$-192
Cash flow
-3.2%
Cash-on-Cash Return
5.4%
Cap rate
0.7%
Rent to Value Ratio
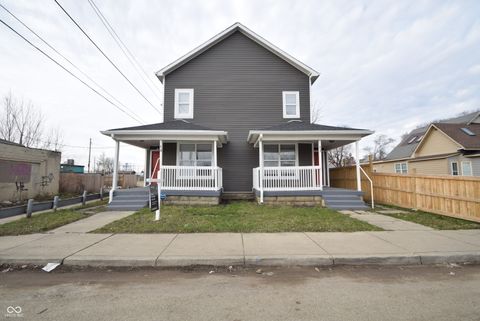
Active
$339,000
3
bds
|
2
ba
|
1,432
sqft
|
built
1921
1360 N Dearborn St, Indianapolis, IN 46201
$264
Cash flow
4.1%
Cash-on-Cash Return
7.1%
Cap rate
0.9%
Rent to Value Ratio
Active
$185,000
4
bds
|
1
ba
|
2,604
sqft
|
built
1900
46 S Warman Ave, Indianapolis, IN 46222
$225
Cash flow
6.3%
Cash-on-Cash Return
7.6%
Cap rate
0.9%
Rent to Value Ratio
Active
$280,000
3
bds
|
2
ba
|
1,760
sqft
|
built
1984
8925 Sunburst Cir, Indianapolis, IN 46227
$-54
Cash flow
-1.0%
Cash-on-Cash Return
5.9%
Cap rate
0.7%
Rent to Value Ratio
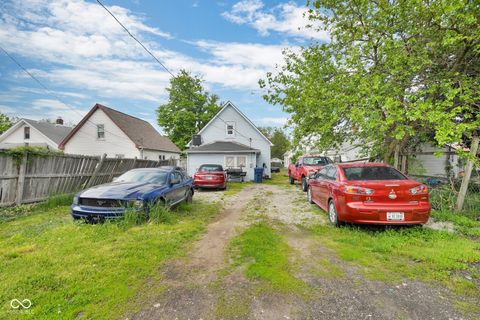
Active
$130,000
3
bds
|
2
ba
|
1,464
sqft
|
built
1926
2509 S New Jersey St, Indianapolis, IN 46225
$438
Cash flow
17.6%
Cash-on-Cash Return
10.2%
Cap rate
1.2%
Rent to Value Ratio
Active
$269,900
3
bds
|
2
ba
|
1,428
sqft
|
built
1963
4132 Tincher Rd, Indianapolis, IN 46221
$-3
Cash flow
-0.1%
Cash-on-Cash Return
6.1%
Cap rate
0.7%
Rent to Value Ratio

Active
$238,750
4
bds
|
2
ba
|
1,480
sqft
|
built
1947
4405 Primrose Ave, Indianapolis, IN 46205
$-119
Cash flow
-2.6%
Cash-on-Cash Return
5.5%
Cap rate
0.7%
Rent to Value Ratio
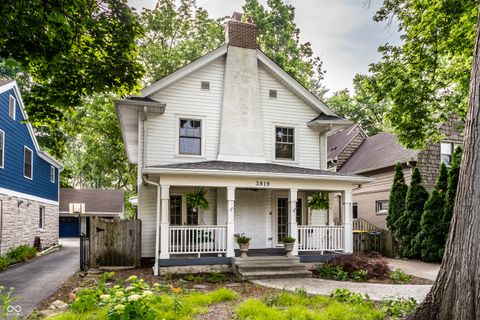
Active
$550,000
3
bds
|
2
ba
|
1,884
sqft
|
built
1926
5919 Central Ave, Indianapolis, IN 46220
$-816
Cash flow
-7.7%
Cash-on-Cash Return
4.4%
Cap rate
0.5%
Rent to Value Ratio
Active
$260,000
3
bds
|
3
ba
|
1,728
sqft
|
built
2003
403 Bagley Ln, Indianapolis, IN 46231
$28
Cash flow
0.6%
Cash-on-Cash Return
6.3%
Cap rate
0.8%
Rent to Value Ratio
Active
$232,900
4
bds
|
2
ba
|
1,920
sqft
|
built
1976
7966 Chiltern Dr, Indianapolis, IN 46268
$49
Cash flow
1.1%
Cash-on-Cash Return
6.4%
Cap rate
0.8%
Rent to Value Ratio
Active
$324,900
3
bds
|
2
ba
|
1,582
sqft
|
built
1956
4609 Andover Rd, Indianapolis, IN 46226
$-422
Cash flow
-6.8%
Cash-on-Cash Return
4.6%
Cap rate
0.6%
Rent to Value Ratio
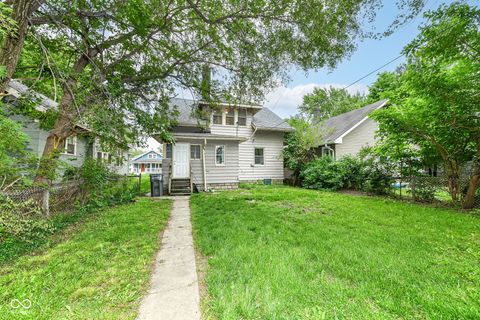
Active
$185,000
2
bds
|
1
ba
|
924
sqft
|
built
1945
1433 N Colorado Ave, Indianapolis, IN 46201
$18
Cash flow
0.5%
Cash-on-Cash Return
6.3%
Cap rate
0.8%
Rent to Value Ratio