Indianapolis, IN Investment Properties for Sale
Browse homes for sale and investment properties in Indianapolis, IN. Refine your search by price, property type, or more.
Best cash flowing properties in Indianapolis, IN
Active
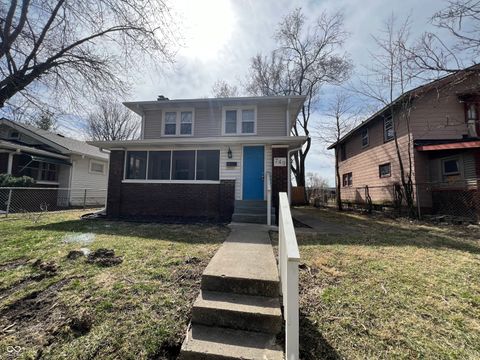
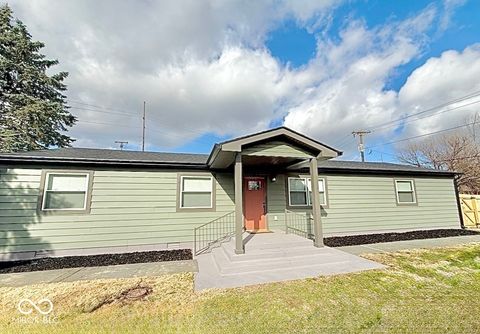
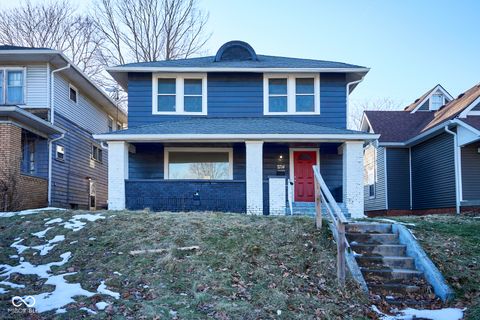
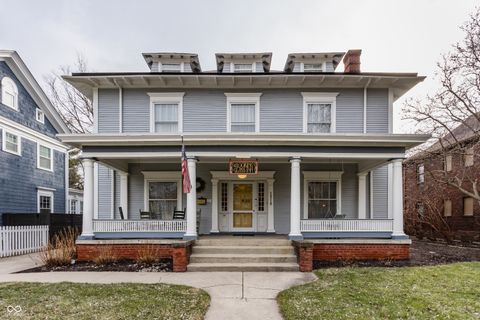
$205,000
4
bds
|
2
ba
|
2,396
sqft
|
built
1930
749 W 32nd St, Indianapolis, IN 46208
$330
Cash flow
8.4%
Cash-on-Cash Return
8.1%
Cap rate
1.0%
Rent to Value Ratio
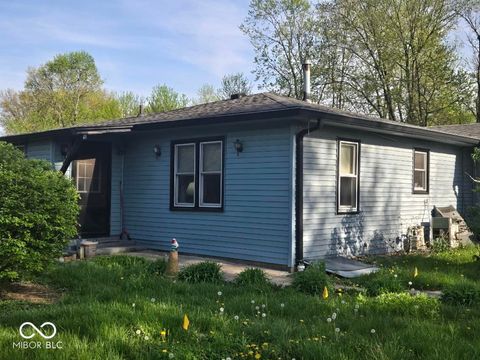
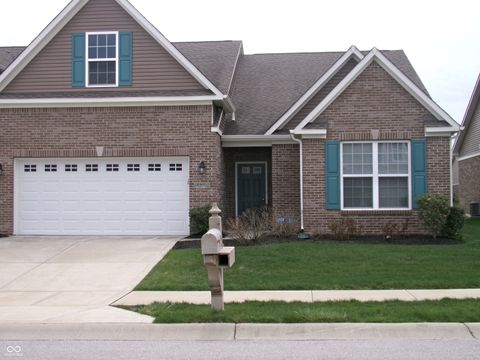
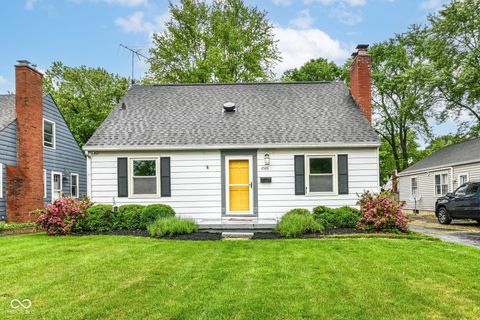
Pending
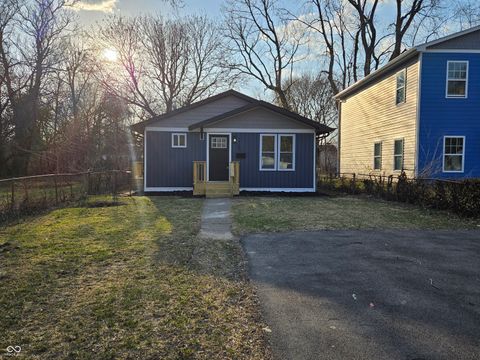
$124,900
2
bds
|
1
ba
|
1,190
sqft
|
built
1965
1817 Sparrow Ave, Indianapolis, IN 46227
$326
Cash flow
13.6%
Cash-on-Cash Return
9.3%
Cap rate
1.1%
Rent to Value Ratio
1,959 out of 2,099 properties for sale in Indianapolis, IN
Limited Results Shown
Create a free account, or log in to reveal all property listings and enjoy the complete experience.
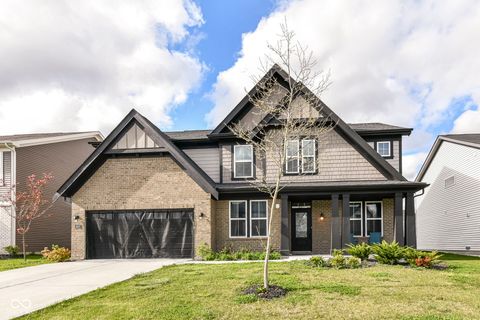
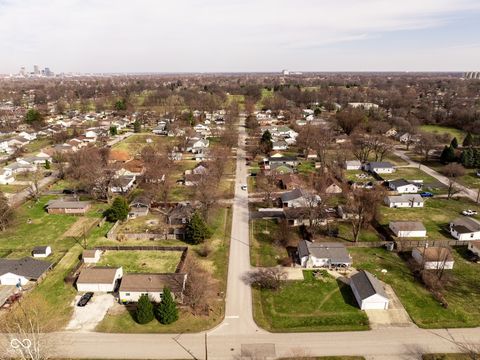
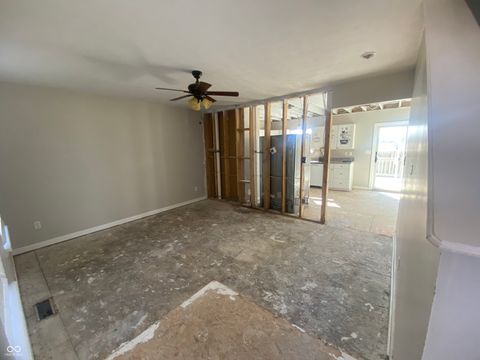
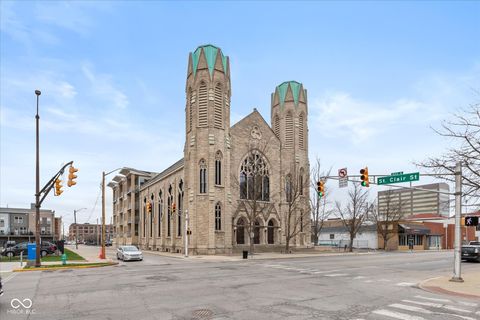
Active
$695,000
4
bds
|
5
ba
|
3,384
sqft
|
built
2013
6519 Rothchild Blvd, Indianapolis, IN 46278
$-859
Cash flow
-6.4%
Cash-on-Cash Return
4.7%
Cap rate
0.6%
Rent to Value Ratio
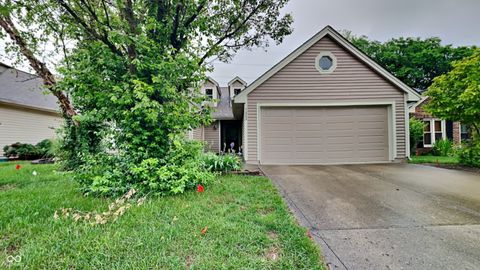
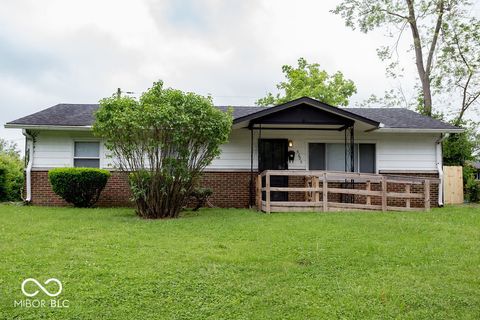
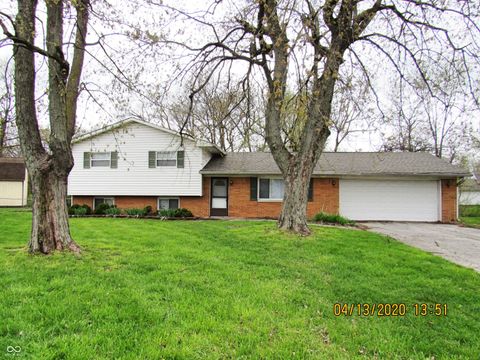
Pending
$299,900
3
bds
|
2
ba
|
1,460
sqft
|
built
1988
7859 Chesapeake Dr E, Indianapolis, IN 46236
$-156
Cash flow
-2.7%
Cash-on-Cash Return
5.5%
Cap rate
0.7%
Rent to Value Ratio
Active
$499,000
3
bds
|
0
ba
|
0
sqft
|
built
1958
3041 S Kercheval Dr, Indianapolis, IN 46239
$-1,176
Cash flow
-12.3%
Cash-on-Cash Return
3.3%
Cap rate
0.4%
Rent to Value Ratio
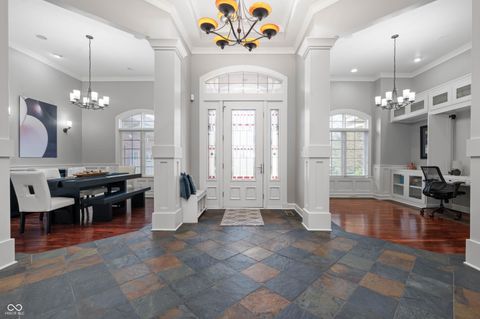
Active
$975,000
4
bds
|
4
ba
|
3,030
sqft
|
built
1885
434 E New York St, Indianapolis, IN 46202
$-3,959
Cash flow
-21.2%
Cash-on-Cash Return
1.3%
Cap rate
0.2%
Rent to Value Ratio
Active
$959,000
5
bds
|
5
ba
|
5,380
sqft
|
built
2007
5202 Logan Ln, Indianapolis, IN 46250
$-2,528
Cash flow
-13.8%
Cash-on-Cash Return
3.0%
Cap rate
0.4%
Rent to Value Ratio
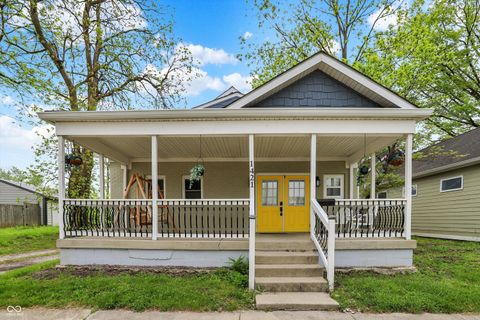
Active
$385,000
3
bds
|
3
ba
|
1,690
sqft
|
built
1885
1421 Laurel St, Indianapolis, IN 46203
$-868
Cash flow
-11.8%
Cash-on-Cash Return
3.4%
Cap rate
0.4%
Rent to Value Ratio
Active
$589,900
5
bds
|
3
ba
|
2,745
sqft
|
built
2022
9920 Deep Royal Way, Indianapolis, IN 46239
$-607
Cash flow
-5.4%
Cash-on-Cash Return
4.9%
Cap rate
0.6%
Rent to Value Ratio
Active
$105,000
4
bds
|
2
ba
|
1,876
sqft
|
built
1876
2701 N Gale St, Indianapolis, IN 46218
$290
Cash flow
14.4%
Cash-on-Cash Return
9.5%
Cap rate
1.1%
Rent to Value Ratio
Active
$114,900
2
bds
|
1
ba
|
938
sqft
|
built
1928
3031 E 38th St, Indianapolis, IN 46218
$170
Cash flow
7.7%
Cash-on-Cash Return
7.9%
Cap rate
1.0%
Rent to Value Ratio
Active
$250,000
2
bds
|
1
ba
|
1,006
sqft
|
built
1923
1342 N Oakland Ave, Indianapolis, IN 46201
$99
Cash flow
2.1%
Cash-on-Cash Return
6.6%
Cap rate
0.8%
Rent to Value Ratio
Active
$139,900
3
bds
|
1
ba
|
1,152
sqft
|
built
1930
3306 N Drexel Ave, Indianapolis, IN 46218
$111
Cash flow
4.1%
Cash-on-Cash Return
7.1%
Cap rate
0.9%
Rent to Value Ratio
Active
$180,000
3
bds
|
2
ba
|
1,528
sqft
|
built
1955
2309 N Dearborn St, Indianapolis, IN 46218
$44
Cash flow
1.3%
Cash-on-Cash Return
6.4%
Cap rate
0.8%
Rent to Value Ratio
Active
$194,900
3
bds
|
2
ba
|
1,191
sqft
|
built
1973
2453 Larnie Ln, Indianapolis, IN 46219
$106
Cash flow
2.8%
Cash-on-Cash Return
6.8%
Cap rate
0.8%
Rent to Value Ratio
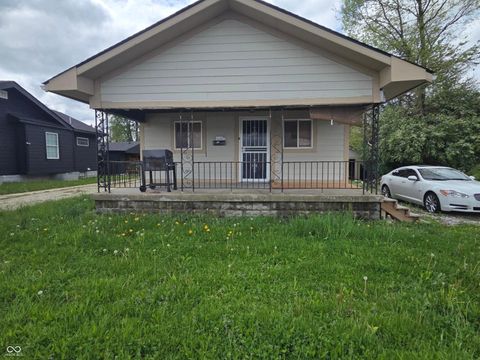
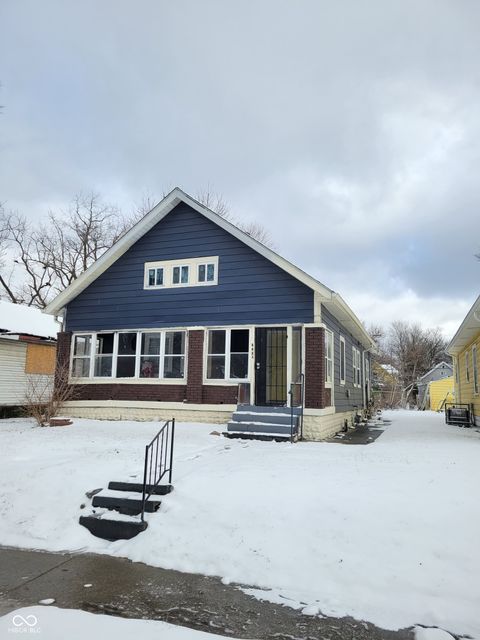
Pending
$124,900
2
bds
|
1
ba
|
1,190
sqft
|
built
1965
1817 Sparrow Ave, Indianapolis, IN 46227
$326
Cash flow
13.6%
Cash-on-Cash Return
9.3%
Cap rate
1.1%
Rent to Value Ratio
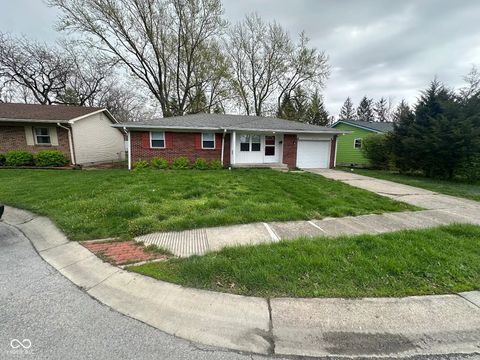
Active
$334,000
3
bds
|
2
ba
|
1,924
sqft
|
built
1962
3991 Bennett Dr, Indianapolis, IN 46254
$-469
Cash flow
-7.3%
Cash-on-Cash Return
4.5%
Cap rate
0.5%
Rent to Value Ratio
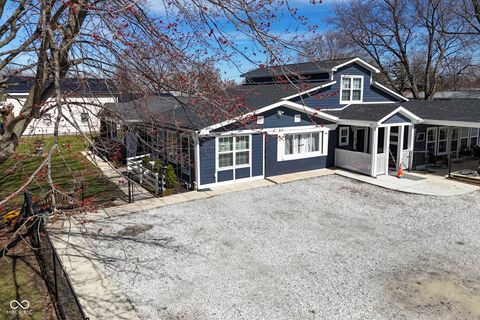
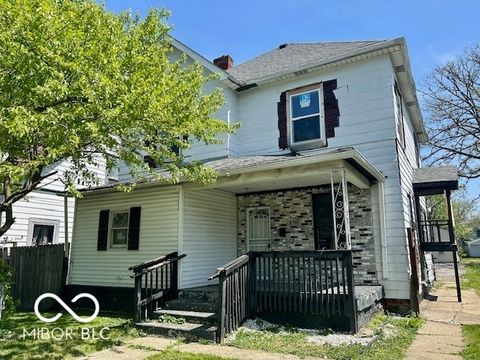
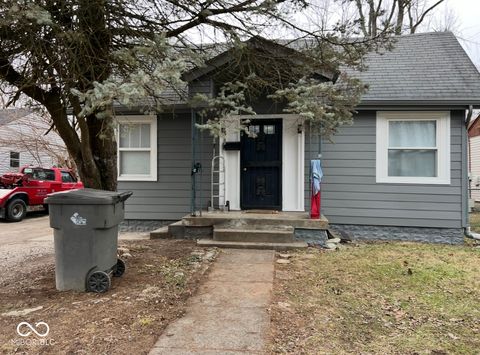
Active
$205,000
4
bds
|
2
ba
|
2,396
sqft
|
built
1930
749 W 32nd St, Indianapolis, IN 46208
$330
Cash flow
8.4%
Cash-on-Cash Return
8.1%
Cap rate
1.0%
Rent to Value Ratio
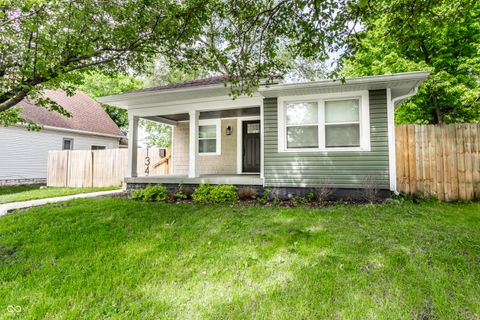
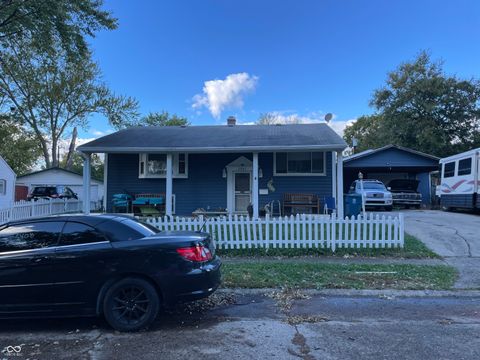
Active
$266,000
3
bds
|
1
ba
|
1,175
sqft
|
built
1977
240 E Caven St, Indianapolis, IN 46225
$155
Cash flow
3.0%
Cash-on-Cash Return
6.8%
Cap rate
0.8%
Rent to Value Ratio

Active
$135,883
3
bds
|
1
ba
|
720
sqft
|
built
1953
929 Olin Ave, Indianapolis, IN 46222
$270
Cash flow
10.4%
Cash-on-Cash Return
8.5%
Cap rate
1.0%
Rent to Value Ratio
Active
$289,900
2
bds
|
2
ba
|
2,014
sqft
|
built
2017
8801 Twain Ln, Indianapolis, IN 46239
$217
Cash flow
3.9%
Cash-on-Cash Return
7.0%
Cap rate
0.9%
Rent to Value Ratio
Active
$95,000
1
bds
|
1
ba
|
700
sqft
|
built
1940
3104 Alice Ave, Indianapolis, IN 46237
$203
Cash flow
11.1%
Cash-on-Cash Return
8.7%
Cap rate
1.1%
Rent to Value Ratio
Active
$169,900
4
bds
|
2
ba
|
1,056
sqft
|
built
1957
5605 Glencoe St, Indianapolis, IN 46226
$96
Cash flow
2.9%
Cash-on-Cash Return
6.8%
Cap rate
0.8%
Rent to Value Ratio
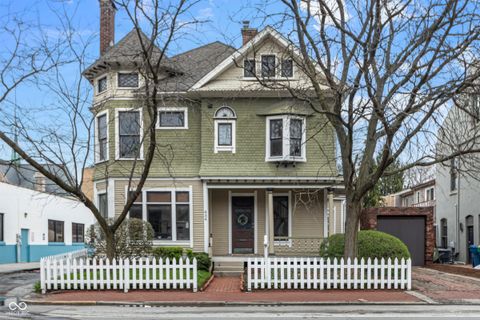
Pending
$282,500
5
bds
|
3
ba
|
2,241
sqft
|
built
1910
2714 N Capitol Ave, Indianapolis, IN 46208
$140
Cash flow
2.6%
Cash-on-Cash Return
6.7%
Cap rate
0.8%
Rent to Value Ratio
Active
$182,500
3
bds
|
2
ba
|
912
sqft
|
built
1962
3262 Orchard Ave, Indianapolis, IN 46218
$31
Cash flow
0.9%
Cash-on-Cash Return
6.4%
Cap rate
0.8%
Rent to Value Ratio
Active
$240,000
4
bds
|
3
ba
|
2,482
sqft
|
built
2000
12151 Bearsdale Dr, Indianapolis, IN 46235
$273
Cash flow
5.9%
Cash-on-Cash Return
7.5%
Cap rate
0.9%
Rent to Value Ratio
Active
$232,600
4
bds
|
2
ba
|
1,863
sqft
|
built
1962
2414 Constellation Dr, Indianapolis, IN 46229
$51
Cash flow
1.1%
Cash-on-Cash Return
6.4%
Cap rate
0.8%
Rent to Value Ratio
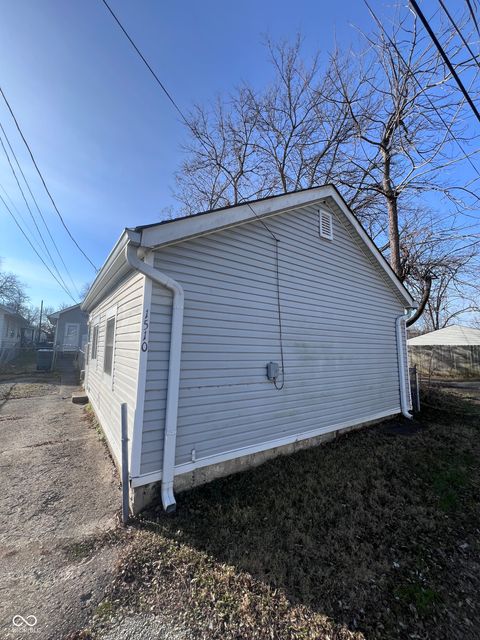
Active
$119,900
2
bds
|
1
ba
|
980
sqft
|
built
1920
1510 E Gimber St, Indianapolis, IN 46203
$76
Cash flow
3.3%
Cash-on-Cash Return
6.9%
Cap rate
0.8%
Rent to Value Ratio
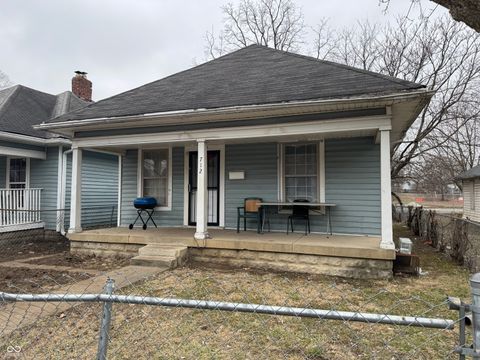
Active
$86,000
1
bds
|
1
ba
|
708
sqft
|
built
1925
712 Lynn St, Indianapolis, IN 46222
$249
Cash flow
15.1%
Cash-on-Cash Return
9.6%
Cap rate
1.2%
Rent to Value Ratio
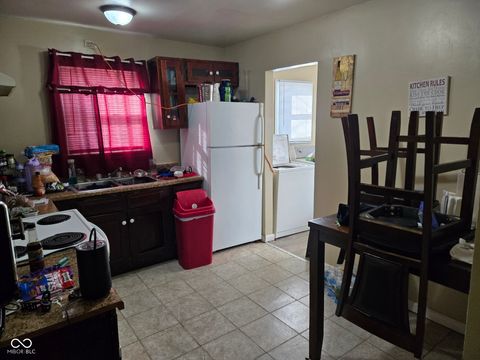
Active
$139,900
3
bds
|
1
ba
|
884
sqft
|
built
1958
3951 N Pasadena Ave, Indianapolis, IN 46226
$111
Cash flow
4.1%
Cash-on-Cash Return
7.1%
Cap rate
0.9%
Rent to Value Ratio
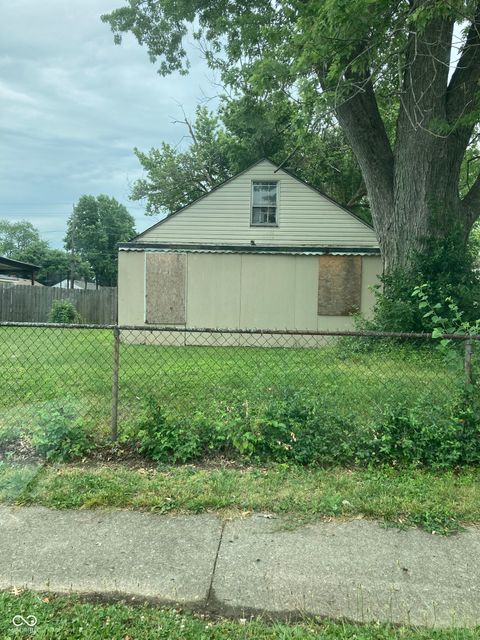
Active
$115,000
4
bds
|
1
ba
|
1,304
sqft
|
built
1930
2515 S Lockburn St, Indianapolis, IN 46241
$170
Cash flow
7.7%
Cash-on-Cash Return
7.9%
Cap rate
1.0%
Rent to Value Ratio
Active
$95,000
2
bds
|
1
ba
|
720
sqft
|
built
1950
2901 S Taft Ave, Indianapolis, IN 46241
$272
Cash flow
14.9%
Cash-on-Cash Return
9.6%
Cap rate
1.2%
Rent to Value Ratio
Active
$98,000
2
bds
|
1
ba
|
836
sqft
|
built
1950
3924 E 30th St, Indianapolis, IN 46218
$257
Cash flow
13.7%
Cash-on-Cash Return
9.3%
Cap rate
1.1%
Rent to Value Ratio
Active
$149,900
3
bds
|
1
ba
|
999
sqft
|
built
1961
3742 N Wittfield St, Indianapolis, IN 46235
$198
Cash flow
6.9%
Cash-on-Cash Return
7.7%
Cap rate
0.9%
Rent to Value Ratio
Active
$195,000
3
bds
|
2
ba
|
1,260
sqft
|
built
1921
3419 Carrollton Ave, Indianapolis, IN 46205
$105
Cash flow
2.8%
Cash-on-Cash Return
6.8%
Cap rate
0.8%
Rent to Value Ratio
Active
$149,900
1
bds
|
0
ba
|
0
sqft
|
built
1910
2507 Rader St, Indianapolis, IN 46208
$60
Cash flow
2.1%
Cash-on-Cash Return
6.6%
Cap rate
0.8%
Rent to Value Ratio
Active
$850,000
7
bds
|
8
ba
|
5,392
sqft
|
built
1890
1319 N New Jersey St, Indianapolis, IN 46202
$-2,077
Cash flow
-12.7%
Cash-on-Cash Return
3.2%
Cap rate
0.4%
Rent to Value Ratio
Active
$309,900
3
bds
|
2
ba
|
1,848
sqft
|
built
1951
2526 Dell Zell Dr, Indianapolis, IN 46220
$-69
Cash flow
-1.2%
Cash-on-Cash Return
5.9%
Cap rate
0.7%
Rent to Value Ratio
Active
$350,000
1
bds
|
1
ba
|
910
sqft
|
built
1985
802 N Meridian St, Indianapolis, IN 46204
$-929
Cash flow
-13.8%
Cash-on-Cash Return
3.0%
Cap rate
0.5%
Rent to Value Ratio
Active
$725,000
3
bds
|
4
ba
|
2,892
sqft
|
built
1895
2110 N Talbott St, Indianapolis, IN 46202
$-1,023
Cash flow
-7.4%
Cash-on-Cash Return
4.5%
Cap rate
0.5%
Rent to Value Ratio
Active
$249,900
2
bds
|
0
ba
|
0
sqft
|
built
1920
408 E Beecher St, Indianapolis, IN 46225
$-383
Cash flow
-8.0%
Cash-on-Cash Return
4.3%
Cap rate
0.5%
Rent to Value Ratio
Active
$675,000
4
bds
|
3
ba
|
2,750
sqft
|
built
1920
2301 Nowland Ave, Indianapolis, IN 46201
$-422
Cash flow
-3.3%
Cash-on-Cash Return
5.4%
Cap rate
0.7%
Rent to Value Ratio