Indianapolis, IN Investment Properties for Sale
Browse homes for sale and investment properties in Indianapolis, IN. Refine your search by price, property type, or more.
Best cash flowing properties in Indianapolis, IN
Active
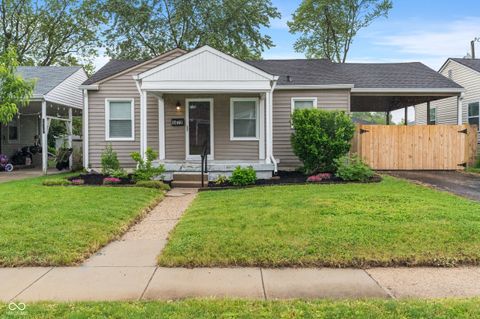
$88,500
2
bds
|
1
ba
|
864
sqft
|
built
1919
3526 E Vermont St, Indianapolis, IN 46201
$504
Cash flow
29.7%
Cash-on-Cash Return
13.1%
Cap rate
1.6%
Rent to Value Ratio
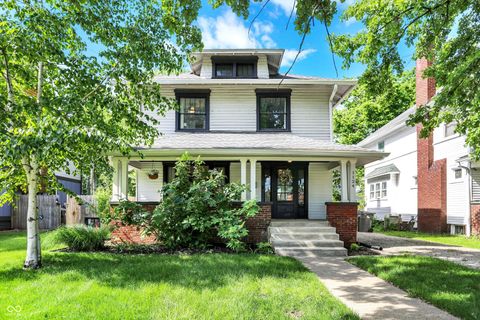
Active
$105,000
2
bds
|
1
ba
|
1,574
sqft
|
built
1950
2310 E Raymond St, Indianapolis, IN 46203
$418
Cash flow
20.8%
Cash-on-Cash Return
11.0%
Cap rate
1.3%
Rent to Value Ratio
1,953 out of 2,093 properties for sale in Indianapolis, IN
Limited Results Shown
Create a free account, or log in to reveal all property listings and enjoy the complete experience.
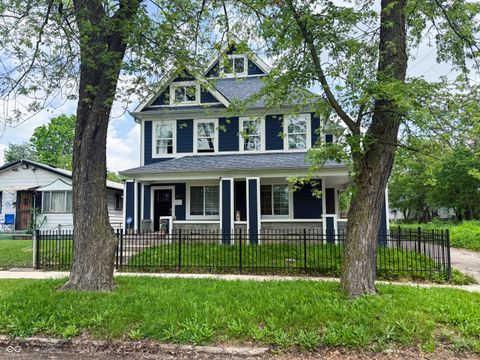
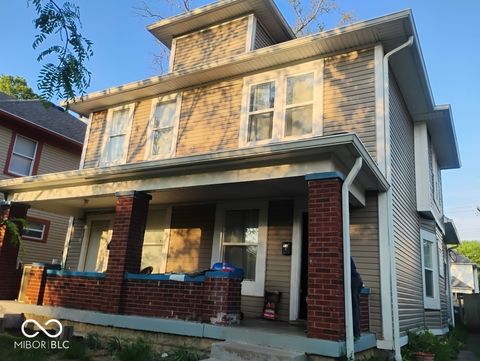
Pending
$154,900
2
bds
|
1
ba
|
780
sqft
|
built
1929
3720 W 16th St, Indianapolis, IN 46222
$-50
Cash flow
-1.7%
Cash-on-Cash Return
5.9%
Cap rate
0.7%
Rent to Value Ratio

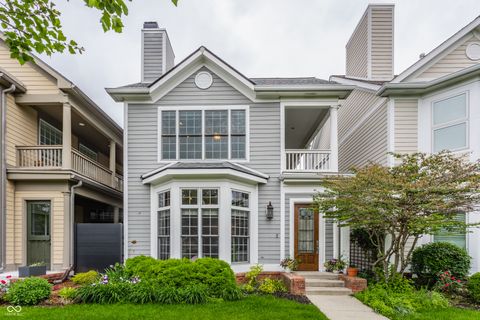
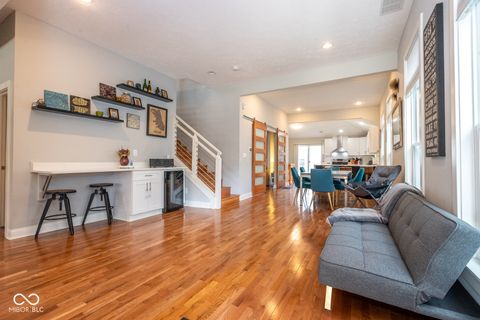
Pending
$424,900
2
bds
|
2
ba
|
1,244
sqft
|
built
2016
504 N Park Ave, Indianapolis, IN 46202
$-379
Cash flow
-4.7%
Cash-on-Cash Return
5.2%
Cap rate
0.7%
Rent to Value Ratio

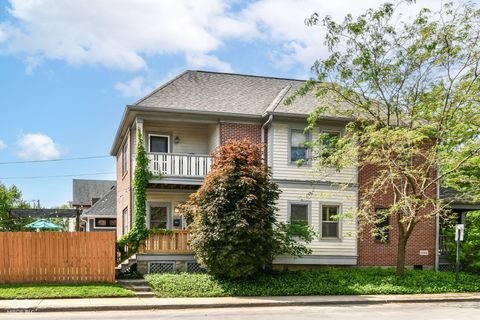
Active
$299,900
3
bds
|
2
ba
|
3,190
sqft
|
built
1905
3136 E Edgewood Ave, Indianapolis, IN 46227
$-117
Cash flow
-2.0%
Cash-on-Cash Return
5.8%
Cap rate
0.7%
Rent to Value Ratio
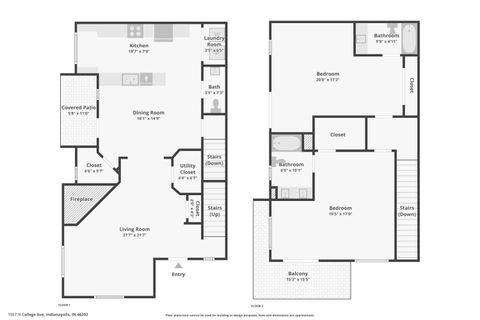
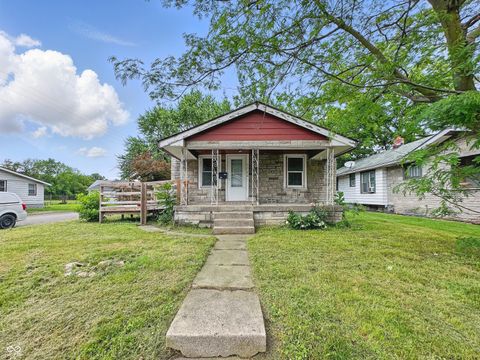
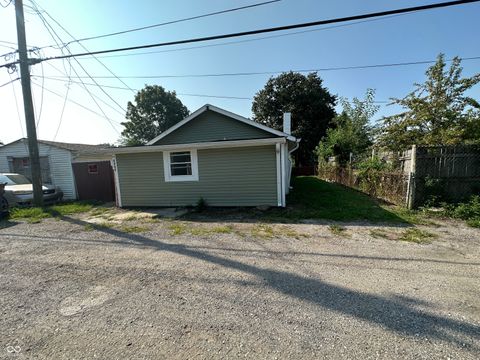
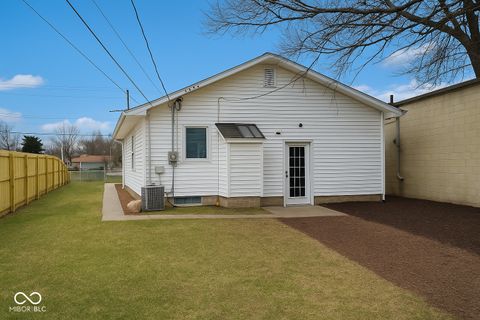
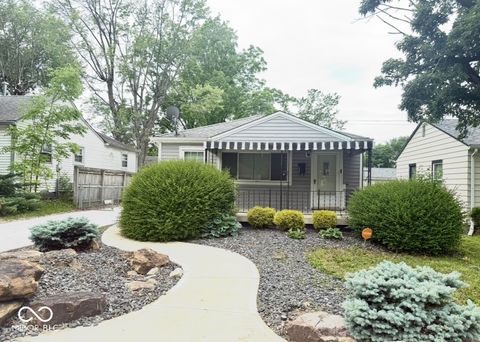
Active
$345,000
2
bds
|
3
ba
|
1,895
sqft
|
built
2004
1557 N College Ave, Indianapolis, IN 46202
$-351
Cash flow
-5.3%
Cash-on-Cash Return
5.0%
Cap rate
0.7%
Rent to Value Ratio
Active
$269,900
4
bds
|
2
ba
|
1,732
sqft
|
built
1974
8231 Trevellian Way, Indianapolis, IN 46217
$-33
Cash flow
-0.6%
Cash-on-Cash Return
6.1%
Cap rate
0.7%
Rent to Value Ratio
Active
$258,000
3
bds
|
2
ba
|
2,358
sqft
|
built
1954
3638 Redfern Dr, Indianapolis, IN 46237
$-174
Cash flow
-3.5%
Cash-on-Cash Return
5.5%
Cap rate
0.7%
Rent to Value Ratio
Active
$318,900
4
bds
|
3
ba
|
1,980
sqft
|
built
2003
4620 Whitham Ln, Indianapolis, IN 46237
$-307
Cash flow
-5.0%
Cash-on-Cash Return
5.1%
Cap rate
0.6%
Rent to Value Ratio

Active
$375,000
3
bds
|
3
ba
|
1,678
sqft
|
built
1961
7804 Wawasee Dr, Indianapolis, IN 46250
$-440
Cash flow
-6.1%
Cash-on-Cash Return
4.9%
Cap rate
0.6%
Rent to Value Ratio
Active
$369,000
2
bds
|
2
ba
|
1,936
sqft
|
built
2005
1074 Reserve Way, Indianapolis, IN 46220
$-506
Cash flow
-7.2%
Cash-on-Cash Return
4.6%
Cap rate
0.7%
Rent to Value Ratio
Active
$449,900
4
bds
|
3
ba
|
2,736
sqft
|
built
1991
7513 Pine Royal Dr, Indianapolis, IN 46256
$-649
Cash flow
-7.5%
Cash-on-Cash Return
4.5%
Cap rate
0.6%
Rent to Value Ratio
Active
$219,000
3
bds
|
0
ba
|
0
sqft
|
built
1925
3619 Salem St, Indianapolis, IN 46208
$-315
Cash flow
-7.5%
Cash-on-Cash Return
4.5%
Cap rate
0.5%
Rent to Value Ratio
Active
$675,000
4
bds
|
4
ba
|
2,405
sqft
|
built
2022
811 E Minnesota St, Indianapolis, IN 46203
$-419
Cash flow
-3.2%
Cash-on-Cash Return
5.5%
Cap rate
0.7%
Rent to Value Ratio
Active
$317,000
3
bds
|
3
ba
|
3,086
sqft
|
built
1999
11753 Pawleys Ct, Indianapolis, IN 46235
$109
Cash flow
1.8%
Cash-on-Cash Return
6.7%
Cap rate
0.8%
Rent to Value Ratio
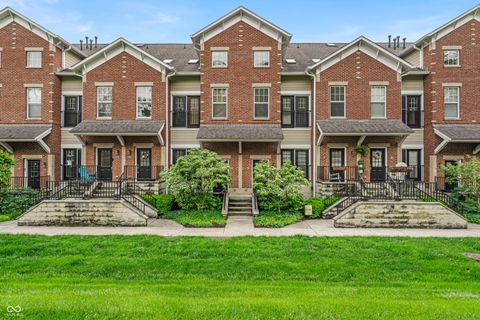
Pending
$315,000
4
bds
|
3
ba
|
3,064
sqft
|
built
1900
201 N Tacoma Ave, Indianapolis, IN 46201
$-403
Cash flow
-6.7%
Cash-on-Cash Return
4.7%
Cap rate
0.6%
Rent to Value Ratio
Active
$670,000
3
bds
|
4
ba
|
3,149
sqft
|
built
1999
626 N Senate Ave, Indianapolis, IN 46202
$-1,621
Cash flow
-12.6%
Cash-on-Cash Return
3.4%
Cap rate
0.5%
Rent to Value Ratio
Active
$309,000
1
bds
|
2
ba
|
1,094
sqft
|
built
1996
635 E 10th St, Indianapolis, IN 46202
$-95
Cash flow
-1.6%
Cash-on-Cash Return
5.9%
Cap rate
0.7%
Rent to Value Ratio
Active
$169,999
3
bds
|
1
ba
|
912
sqft
|
built
1954
1844 N Riley Ave, Indianapolis, IN 46218
$78
Cash flow
2.4%
Cash-on-Cash Return
6.8%
Cap rate
0.8%
Rent to Value Ratio
Active
$600,000
6
bds
|
0
ba
|
0
sqft
|
built
1956
6430 E Southport Rd, Indianapolis, IN 46237
$-648
Cash flow
-5.6%
Cash-on-Cash Return
5.0%
Cap rate
0.6%
Rent to Value Ratio
Active
$299,000
3
bds
|
3
ba
|
1,464
sqft
|
built
1924
815 E 24th St, Indianapolis, IN 46205
$-595
Cash flow
-10.4%
Cash-on-Cash Return
3.9%
Cap rate
0.5%
Rent to Value Ratio
Pending
$369,000
5
bds
|
3
ba
|
2,875
sqft
|
built
2003
8241 Holmard Pl, Indianapolis, IN 46259
$-165
Cash flow
-2.3%
Cash-on-Cash Return
5.7%
Cap rate
0.7%
Rent to Value Ratio
Pending
$319,500
4
bds
|
3
ba
|
2,464
sqft
|
built
1997
10847 Woodlook Ln, Indianapolis, IN 46239
$-110
Cash flow
-1.8%
Cash-on-Cash Return
5.9%
Cap rate
0.7%
Rent to Value Ratio
Active
$105,000
2
bds
|
1
ba
|
1,574
sqft
|
built
1950
2310 E Raymond St, Indianapolis, IN 46203
$418
Cash flow
20.8%
Cash-on-Cash Return
11.0%
Cap rate
1.3%
Rent to Value Ratio
Pending
$170,000
2
bds
|
1
ba
|
720
sqft
|
built
1952
5473 E 18th St, Indianapolis, IN 46218
$216
Cash flow
6.6%
Cash-on-Cash Return
7.8%
Cap rate
0.9%
Rent to Value Ratio
Active
$287,500
2
bds
|
2
ba
|
1,254
sqft
|
built
1910
925 Fayette St, Indianapolis, IN 46202
$86
Cash flow
1.6%
Cash-on-Cash Return
6.6%
Cap rate
0.8%
Rent to Value Ratio
Active
$274,000
3
bds
|
2
ba
|
1,570
sqft
|
built
1919
1124 E 35th St, Indianapolis, IN 46205
$157
Cash flow
3.0%
Cash-on-Cash Return
7.0%
Cap rate
0.8%
Rent to Value Ratio
Active
$295,000
0
bds
|
0
ba
|
0
sqft
|
built
1915
639 N Hamilton Ave, Indianapolis, IN 46201
$-712
Cash flow
-12.6%
Cash-on-Cash Return
3.4%
Cap rate
0.4%
Rent to Value Ratio
Active
$469,900
3
bds
|
3
ba
|
2,089
sqft
|
built
2000
1334 E Market St, Indianapolis, IN 46202
$-728
Cash flow
-8.1%
Cash-on-Cash Return
4.4%
Cap rate
0.5%
Rent to Value Ratio
Active
$349,900
2
bds
|
2
ba
|
1,946
sqft
|
built
2005
1064 Reserve Way, Indianapolis, IN 46220
$-392
Cash flow
-5.8%
Cash-on-Cash Return
4.9%
Cap rate
0.7%
Rent to Value Ratio
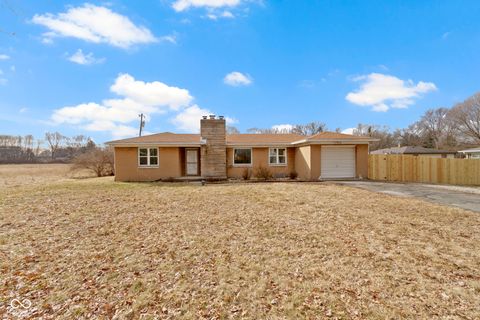
Active
$225,000
3
bds
|
1
ba
|
1,092
sqft
|
built
1953
305 Bixler Rd, Indianapolis, IN 46227
$-278
Cash flow
-6.4%
Cash-on-Cash Return
4.8%
Cap rate
0.6%
Rent to Value Ratio
Active
$175,000
3
bds
|
1
ba
|
925
sqft
|
built
1958
4113 W 30th St, Indianapolis, IN 46222
$-17
Cash flow
-0.5%
Cash-on-Cash Return
6.2%
Cap rate
0.7%
Rent to Value Ratio
Active
$380,000
5
bds
|
3
ba
|
3,898
sqft
|
built
1999
9001 Harrison Run Ct, Indianapolis, IN 46256
$-85
Cash flow
-1.2%
Cash-on-Cash Return
6.0%
Cap rate
0.7%
Rent to Value Ratio

Active
$250,000
4
bds
|
2
ba
|
1,957
sqft
|
built
1922
3134 N College Ave, Indianapolis, IN 46205
$-63
Cash flow
-1.3%
Cash-on-Cash Return
6.0%
Cap rate
0.7%
Rent to Value Ratio
Active
$88,500
2
bds
|
1
ba
|
864
sqft
|
built
1919
3526 E Vermont St, Indianapolis, IN 46201
$504
Cash flow
29.7%
Cash-on-Cash Return
13.1%
Cap rate
1.6%
Rent to Value Ratio
Active
$650,000
4
bds
|
4
ba
|
3,739
sqft
|
built
1930
1530 E 75th St, Indianapolis, IN 46240
$57
Cash flow
0.5%
Cash-on-Cash Return
6.4%
Cap rate
0.8%
Rent to Value Ratio

Active
$379,000
3
bds
|
2
ba
|
1,688
sqft
|
built
1900
909 N Temple Ave, Indianapolis, IN 46201
$-1,289
Cash flow
-17.7%
Cash-on-Cash Return
2.2%
Cap rate
0.3%
Rent to Value Ratio

Pending
$168,000
2
bds
|
1
ba
|
1,064
sqft
|
built
1948
1617 S Whittier Pl, Indianapolis, IN 46203
$227
Cash flow
7.0%
Cash-on-Cash Return
7.9%
Cap rate
1.0%
Rent to Value Ratio

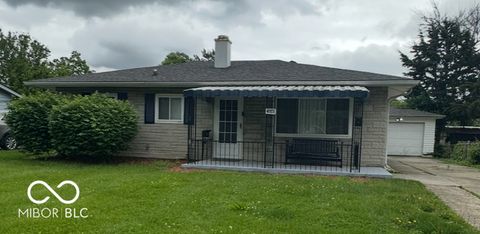
Active
$112,000
2
bds
|
1
ba
|
888
sqft
|
built
1955
4106 N Pasadena Ave, Indianapolis, IN 46226
$381
Cash flow
17.7%
Cash-on-Cash Return
10.4%
Cap rate
1.3%
Rent to Value Ratio

Active
$360,000
4
bds
|
2
ba
|
2,166
sqft
|
built
1965
741 Fairway Dr, Indianapolis, IN 46260
$-85
Cash flow
-1.2%
Cash-on-Cash Return
6.0%
Cap rate
0.7%
Rent to Value Ratio

Active
$324,900
4
bds
|
0
ba
|
0
sqft
|
built
1951
307 N Arlington Ave, Indianapolis, IN 46219
$-730
Cash flow
-11.7%
Cash-on-Cash Return
3.6%
Cap rate
0.4%
Rent to Value Ratio

Active
$239,900
3
bds
|
3
ba
|
1,568
sqft
|
built
1924
1425 N Grant Ave, Indianapolis, IN 46201
$-493
Cash flow
-10.7%
Cash-on-Cash Return
3.8%
Cap rate
0.5%
Rent to Value Ratio