Orleans Parish County Investment Properties for Sale
Browse homes for sale and investment properties in Orleans Parish County. Refine your search by price, property type, or more.
Best cash flowing properties in Orleans Parish County
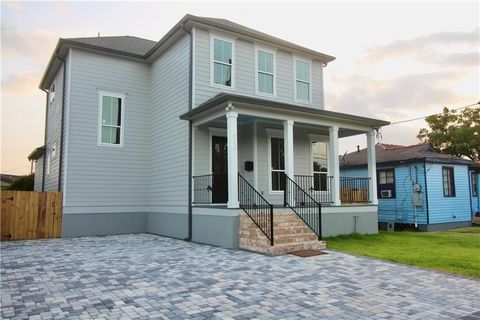
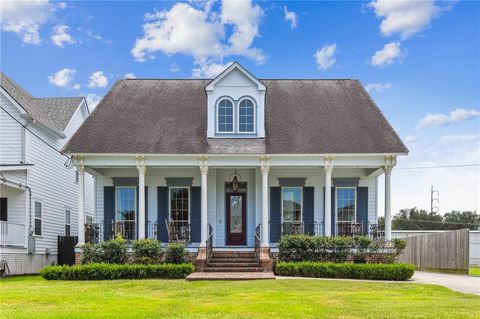
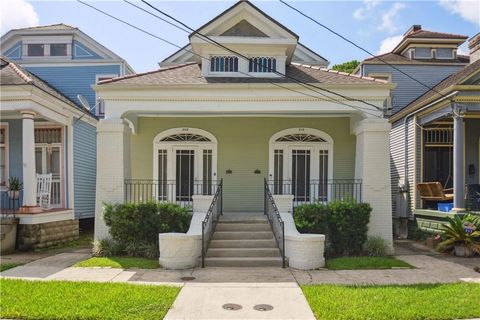
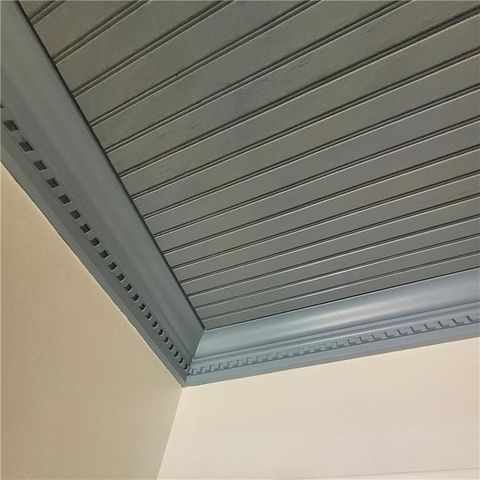
Active
$489,000
4
bds
|
3
ba
|
2,488
sqft
|
built
2022
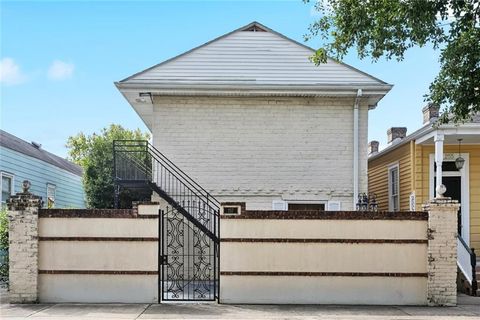
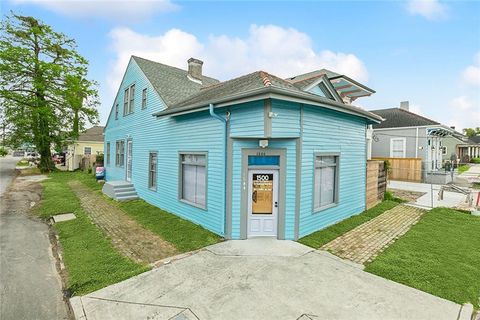
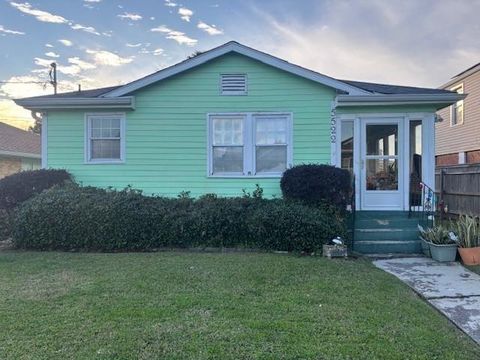
3126 Saint Bernard Ave, New Orleans, LA 70119
$791
Cash flow
8.4%
Cash-on-Cash Return
7.6%
Cap rate
0.9%
Rent to Value Ratio
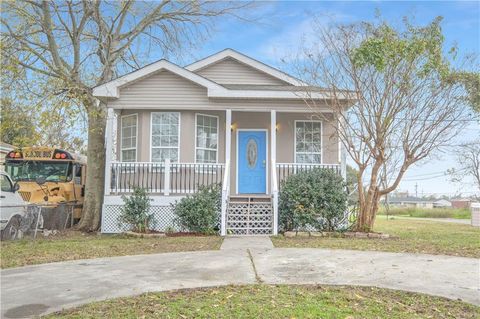
Active
$165,000
3
bds
|
2
ba
|
1,500
sqft
|
built
2013
6501 Selma St, New Orleans, LA 70126
$599
Cash flow
18.9%
Cash-on-Cash Return
10.0%
Cap rate
1.2%
Rent to Value Ratio
1,203 out of 1,209 properties for sale in Orleans Parish County
Limited Results Shown
Create a free account, or log in to reveal all property listings and enjoy the complete experience.
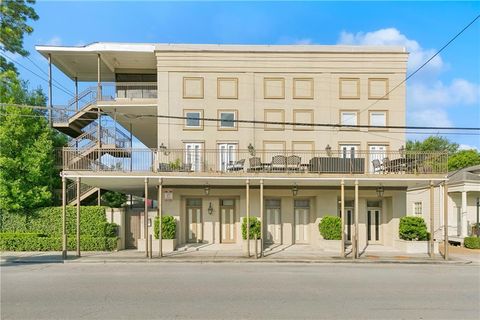
Active
$725,000
3
bds
|
2
ba
|
2,153
sqft
|
built
1875
826 Mandeville St, New Orleans, LA 70117
$-395
Cash flow
-2.8%
Cash-on-Cash Return
5.0%
Cap rate
0.6%
Rent to Value Ratio
Active
$255,000
4
bds
|
0
ba
|
1,850
sqft
|
built
1921
2421 Saint Roch Ave, New Orleans, LA 70117
$-241
Cash flow
-4.9%
Cash-on-Cash Return
4.5%
Cap rate
0.5%
Rent to Value Ratio
Active
$139,000
2
bds
|
1
ba
|
540
sqft
|
built
1962
257 Cherokee St, New Orleans, LA 70118
$170
Cash flow
6.4%
Cash-on-Cash Return
7.1%
Cap rate
0.9%
Rent to Value Ratio
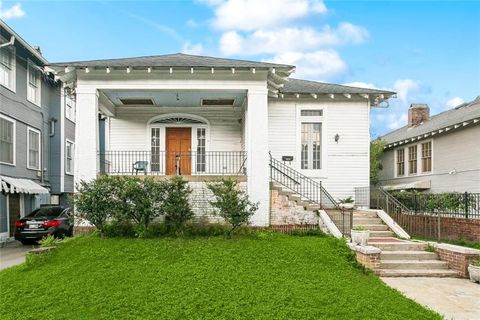
Active
$520,000
1
bds
|
1
ba
|
919
sqft
|
built
2015
700 Magazine St, New Orleans, LA 70130
$-322
Cash flow
-3.2%
Cash-on-Cash Return
4.9%
Cap rate
0.6%
Rent to Value Ratio
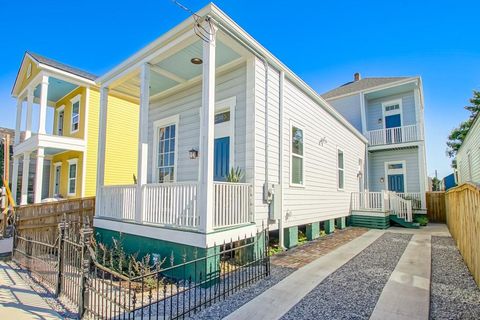
Active
$575,000
2
bds
|
3
ba
|
1,791
sqft
|
built
2017
2415 Dauphine St, New Orleans, LA 70117
$-30
Cash flow
-0.3%
Cash-on-Cash Return
5.6%
Cap rate
0.7%
Rent to Value Ratio
Active
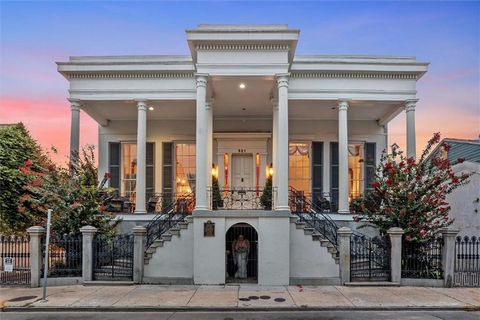
$1,475,000
4
bds
|
4
ba
|
3,742
sqft
|
built
1809
1019 Saint Peter St, New Orleans, LA 70116
$-4,634
Cash flow
-16.4%
Cash-on-Cash Return
1.9%
Cap rate
0.2%
Rent to Value Ratio
Active
$849,000
4
bds
|
4
ba
|
4,569
sqft
|
built
1989
5201 Bancroft Dr, New Orleans, LA 70122
$260
Cash flow
1.6%
Cash-on-Cash Return
6.0%
Cap rate
0.7%
Rent to Value Ratio
Active
$225,000
2
bds
|
2
ba
|
1,030
sqft
|
built
1930
2272 N Robertson St, New Orleans, LA 70117
$246
Cash flow
5.7%
Cash-on-Cash Return
7.0%
Cap rate
0.8%
Rent to Value Ratio
Active
$815,500
2
bds
|
3
ba
|
1,713
sqft
|
built
1840
1838 Burgundy St, New Orleans, LA 70116
$-1,720
Cash flow
-11.0%
Cash-on-Cash Return
3.1%
Cap rate
0.4%
Rent to Value Ratio
Active
$475,000
4
bds
|
3
ba
|
2,851
sqft
|
built
1946
9 Chatham Dr, New Orleans, LA 70122
$-109
Cash flow
-1.2%
Cash-on-Cash Return
5.4%
Cap rate
0.7%
Rent to Value Ratio
Active
$649,000
3
bds
|
4
ba
|
2,400
sqft
|
built
2014
230 26th St, New Orleans, LA 70124
$-380
Cash flow
-3.1%
Cash-on-Cash Return
5.0%
Cap rate
0.6%
Rent to Value Ratio
Active
$168,000
3
bds
|
2
ba
|
2,439
sqft
|
built
1945
1201 Kentucky St, New Orleans, LA 70117
$585
Cash flow
18.2%
Cash-on-Cash Return
9.9%
Cap rate
1.2%
Rent to Value Ratio
Active
$159,500
2
bds
|
1
ba
|
1,013
sqft
|
built
1950
2230 N Roman St, New Orleans, LA 70117
$142
Cash flow
4.6%
Cash-on-Cash Return
6.7%
Cap rate
0.8%
Rent to Value Ratio
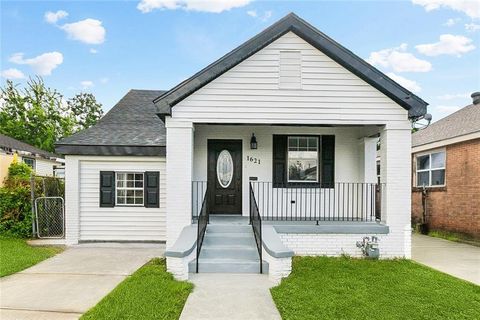
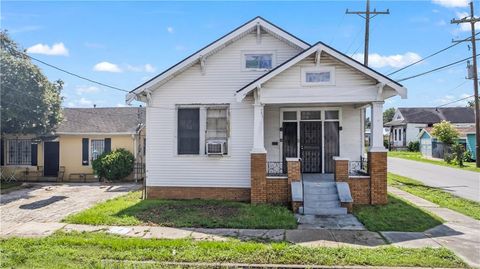
Active
$205,000
3
bds
|
2
ba
|
1,237
sqft
|
built
1976
1621 Congress St, New Orleans, LA 70117
$-4
Cash flow
-0.1%
Cash-on-Cash Return
5.7%
Cap rate
0.7%
Rent to Value Ratio
Active
$349,000
1
bds
|
2.5
ba
|
2,147
sqft
|
built
1900
1500 N Villere St, New Orleans, LA 70116
$-410
Cash flow
-6.1%
Cash-on-Cash Return
4.3%
Cap rate
0.5%
Rent to Value Ratio
Active
$189,000
2
bds
|
3
ba
|
1,130
sqft
|
built
1981
248 Cherokee St, New Orleans, LA 70118
$210
Cash flow
5.8%
Cash-on-Cash Return
7.0%
Cap rate
0.8%
Rent to Value Ratio
Active
$650,000
3
bds
|
3
ba
|
1,787
sqft
|
built
1880
1830 Burgundy St, New Orleans, LA 70116
$-1,489
Cash flow
-12.0%
Cash-on-Cash Return
2.9%
Cap rate
0.4%
Rent to Value Ratio
Active
$275,000
3
bds
|
2
ba
|
1,610
sqft
|
built
1988
206 Fairfax Pl, New Orleans, LA 70131
$-197
Cash flow
-3.7%
Cash-on-Cash Return
4.8%
Cap rate
0.6%
Rent to Value Ratio
Active
$679,000
4
bds
|
4
ba
|
2,692
sqft
|
built
1910
208 S Scott St, New Orleans, LA 70119
$-1,833
Cash flow
-14.1%
Cash-on-Cash Return
2.4%
Cap rate
0.3%
Rent to Value Ratio
Active
$135,000
3
bds
|
2
ba
|
1,267
sqft
|
built
1994
7633 Stonewood St, New Orleans, LA 70128
$465
Cash flow
18.0%
Cash-on-Cash Return
9.8%
Cap rate
1.2%
Rent to Value Ratio
Active
$100,000
3
bds
|
2
ba
|
1,268
sqft
|
built
1962
2365 N Tonti St, New Orleans, LA 70117
$493
Cash flow
25.7%
Cash-on-Cash Return
11.6%
Cap rate
1.4%
Rent to Value Ratio
Active
$175,000
4
bds
|
0
ba
|
1,400
sqft
|
built
1979
2446 N Rocheblave St, New Orleans, LA 70117
$69
Cash flow
2.1%
Cash-on-Cash Return
6.2%
Cap rate
0.7%
Rent to Value Ratio
Active
$355,000
4
bds
|
3
ba
|
2,955
sqft
|
built
1965
5821 Pembrook Dr, New Orleans, LA 70131
$114
Cash flow
1.7%
Cash-on-Cash Return
6.1%
Cap rate
0.7%
Rent to Value Ratio
Active
$550,000
2
bds
|
2
ba
|
1,662
sqft
|
built
2005
8416 Oak St, New Orleans, LA 70118
$-119
Cash flow
-1.1%
Cash-on-Cash Return
5.4%
Cap rate
0.7%
Rent to Value Ratio
Active
$550,000
3
bds
|
2
ba
|
1,624
sqft
|
built
1900
5326 Prytania St, New Orleans, LA 70115
$-119
Cash flow
-1.1%
Cash-on-Cash Return
5.4%
Cap rate
0.7%
Rent to Value Ratio
Active
$320,000
3
bds
|
3
ba
|
1,900
sqft
|
built
1922
2315 4th St, New Orleans, LA 70113
$73
Cash flow
1.2%
Cash-on-Cash Return
6.0%
Cap rate
0.7%
Rent to Value Ratio
Active
$3,900,000
10
bds
|
11
ba
|
8,325
sqft
|
built
1852
521 Dauphine St, New Orleans, LA 70112
$-16,455
Cash flow
-22.0%
Cash-on-Cash Return
0.6%
Cap rate
0.1%
Rent to Value Ratio
Active
$495,000
3
bds
|
3
ba
|
1,674
sqft
|
built
2018
110 Atlantic Ave, New Orleans, LA 70114
$-134
Cash flow
-1.4%
Cash-on-Cash Return
5.4%
Cap rate
0.6%
Rent to Value Ratio
Active
$90,000
3
bds
|
1
ba
|
1,024
sqft
|
built
2009
3319 N Dorgenois St, New Orleans, LA 70117
$540
Cash flow
31.3%
Cash-on-Cash Return
12.9%
Cap rate
1.6%
Rent to Value Ratio
Active
$600,000
7
bds
|
4
ba
|
2,678
sqft
|
built
1920
2625 Ursulines Ave, New Orleans, LA 70119
$-1,735
Cash flow
-15.1%
Cash-on-Cash Return
2.2%
Cap rate
0.3%
Rent to Value Ratio
Active
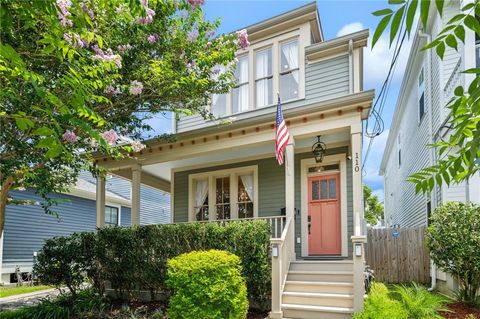
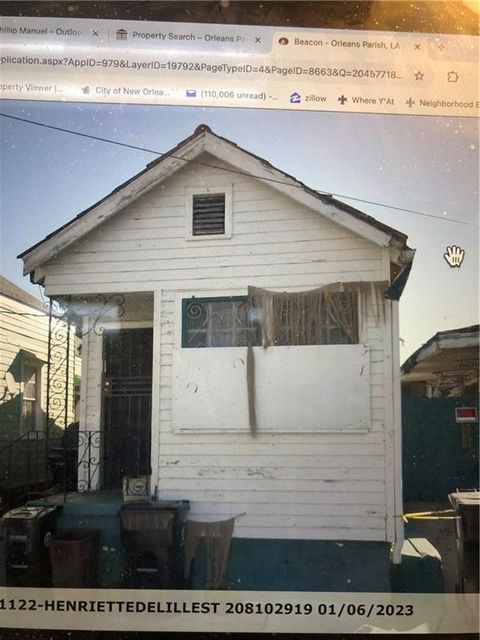
$411,000
bds
|
0
ba
|
1,073
sqft
|
built
1920
1122 Henriette Delille St, New Orleans, LA 70116
$-358
Cash flow
-4.5%
Cash-on-Cash Return
4.6%
Cap rate
0.6%
Rent to Value Ratio
Active
$314,500
4
bds
|
3
ba
|
2,694
sqft
|
built
1971
7141 Westhaven Rd, New Orleans, LA 70126
$419
Cash flow
7.0%
Cash-on-Cash Return
7.3%
Cap rate
0.9%
Rent to Value Ratio
Active
$190,000
4
bds
|
0
ba
|
1,770
sqft
|
built
1957
5328 Eastern St, New Orleans, LA 70122
$67
Cash flow
1.8%
Cash-on-Cash Return
6.1%
Cap rate
0.7%
Rent to Value Ratio
Active
$280,000
6
bds
|
0
ba
|
3,098
sqft
|
built
1927
2911 Robert St, New Orleans, LA 70125
$193
Cash flow
3.6%
Cash-on-Cash Return
6.5%
Cap rate
0.8%
Rent to Value Ratio
Active
$159,000
3
bds
|
3
ba
|
1,533
sqft
|
built
1960
5522 Eads St, New Orleans, LA 70122
$490
Cash flow
16.1%
Cash-on-Cash Return
9.4%
Cap rate
1.1%
Rent to Value Ratio
Active
$425,000
2
bds
|
3
ba
|
1,994
sqft
|
built
1980
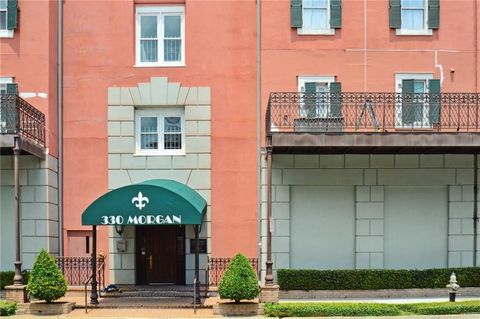
330 Morgan St, New Orleans, LA 70114
$128
Cash flow
1.6%
Cash-on-Cash Return
6.0%
Cap rate
0.7%
Rent to Value Ratio
Active
$235,900
3
bds
|
2
ba
|
1,225
sqft
|
built
2013
5817 Providence Pl, New Orleans, LA 70126
$126
Cash flow
2.8%
Cash-on-Cash Return
6.3%
Cap rate
0.8%
Rent to Value Ratio
Active
$250,000
2
bds
|
2
ba
|
1,083
sqft
|
built
1940
6215 York St, New Orleans, LA 70125
$-79
Cash flow
-1.6%
Cash-on-Cash Return
5.3%
Cap rate
0.6%
Rent to Value Ratio