Terrebonne Parish County Investment Properties for Sale
Browse homes for sale and investment properties in Terrebonne Parish County. Refine your search by price, property type, or more.
Best cash flowing properties in Terrebonne Parish County
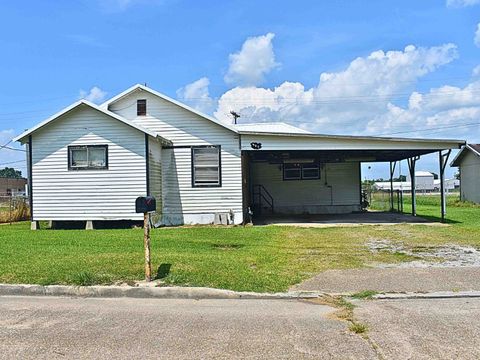
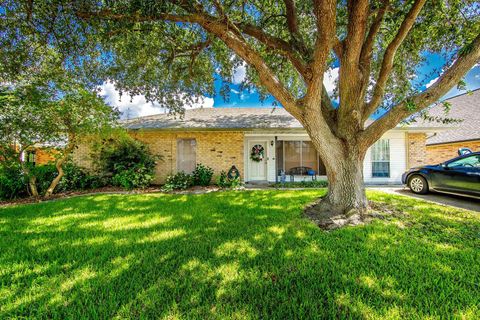
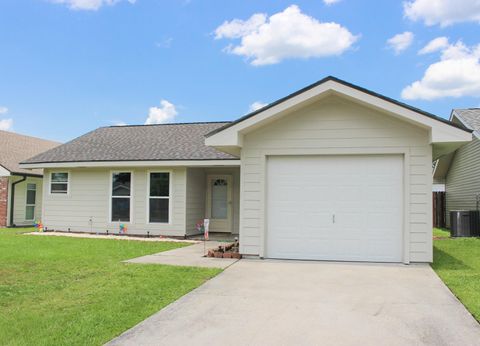
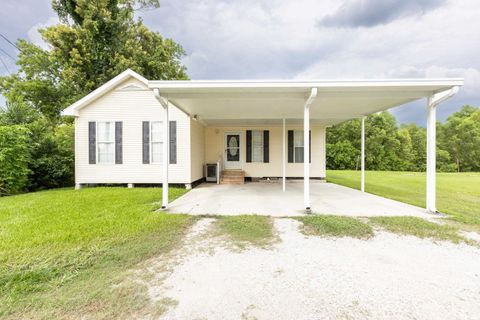
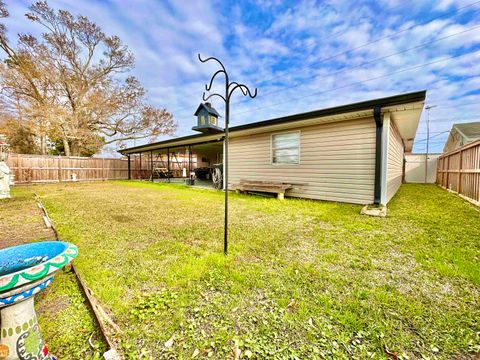
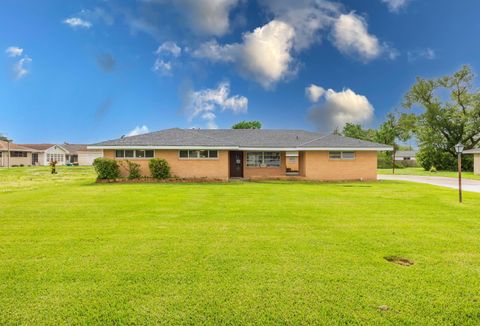
Active
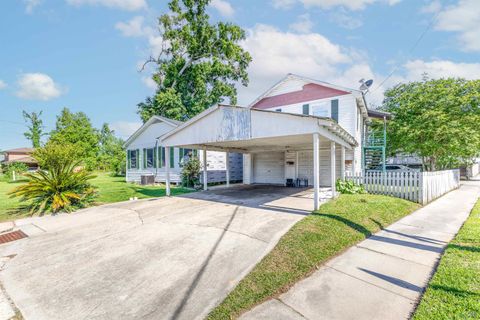
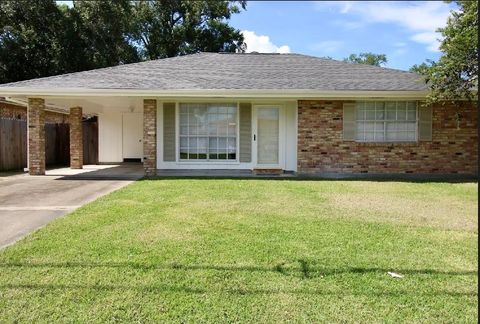
$75,000
3
bds
|
2
ba
|
1,898
sqft
|
built
1947
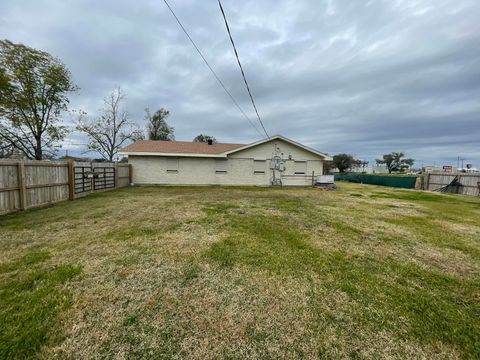
905 Peach St, Houma, LA 70363
$542
Cash flow
37.7%
Cash-on-Cash Return
14.4%
Cap rate
1.7%
Rent to Value Ratio
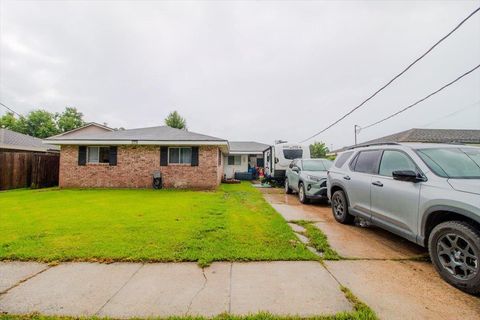
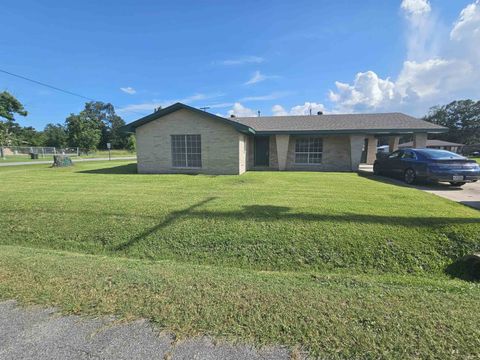
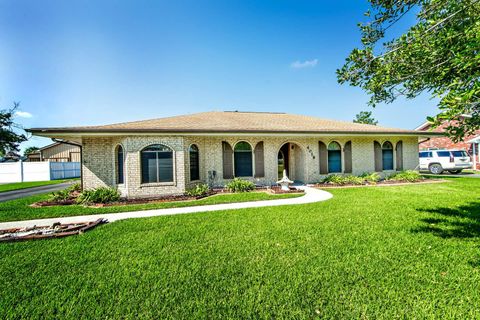
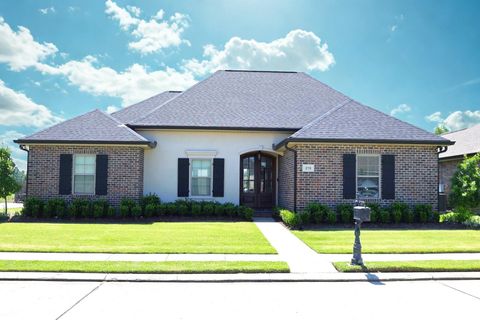
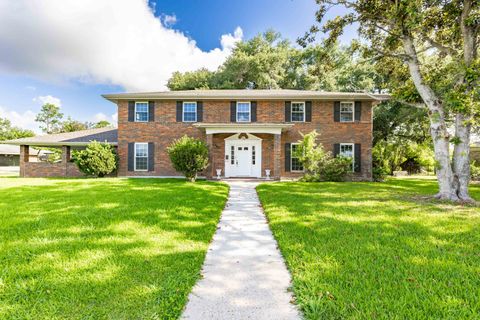
Active
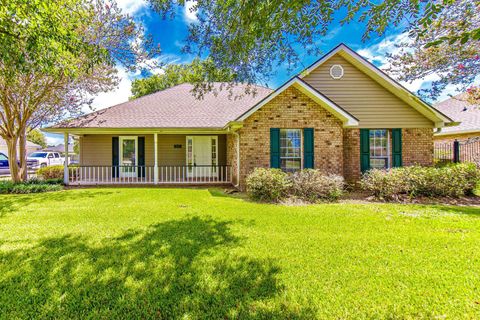
$115,000
3
bds
|
2
ba
|
1,767
sqft
|
built
1983
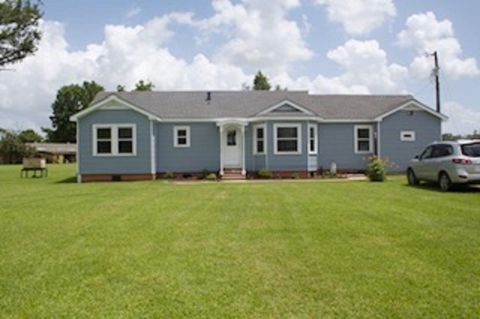
12 Fernwood Dr, Houma, LA 70364
$422
Cash flow
19.1%
Cash-on-Cash Return
10.1%
Cap rate
1.2%
Rent to Value Ratio
348 out of 354 properties for sale in Terrebonne Parish County
Limited Results Shown
Create a free account, or log in to reveal all property listings and enjoy the complete experience.

Active
$579,000
6
bds
|
6
ba
|
2,728
sqft
|
built
2022
2501 Brady Rd, Theriot, LA 70397
$-1,705
Cash flow
-15.4%
Cash-on-Cash Return
2.1%
Cap rate
0.3%
Rent to Value Ratio
Active
$882,000
5
bds
|
4
ba
|
3,076
sqft
|
built
2014
338 Tulip Dr, Houma, LA 70360
$-2,449
Cash flow
-14.5%
Cash-on-Cash Return
2.3%
Cap rate
0.3%
Rent to Value Ratio

Active
$194,000
3
bds
|
2
ba
|
1,331
sqft
|
built
1997
1991 Saint Louis Canal Rd, Houma, LA 70364
$48
Cash flow
1.3%
Cash-on-Cash Return
6.0%
Cap rate
0.7%
Rent to Value Ratio
Active
$479,000
4
bds
|
3
ba
|
3,045
sqft
|
built
1965
105 General Lee St, Houma, LA 70360
$-542
Cash flow
-5.9%
Cash-on-Cash Return
4.3%
Cap rate
0.5%
Rent to Value Ratio
Active
$229,900
3
bds
|
2
ba
|
2,064
sqft
|
built
1979
302 N Moss Dr, Houma, LA 70360
$154
Cash flow
3.5%
Cash-on-Cash Return
6.5%
Cap rate
0.8%
Rent to Value Ratio
Active
$143,000
3
bds
|
2
ba
|
1,256
sqft
|
built
1965
314 Oakshire Dr, Houma, LA 70364
$289
Cash flow
10.5%
Cash-on-Cash Return
8.1%
Cap rate
1.0%
Rent to Value Ratio
Active
$479,900
3
bds
|
3
ba
|
3,189
sqft
|
built
1976
381 Highridge Dr, Houma, LA 70363
$-1,167
Cash flow
-12.7%
Cash-on-Cash Return
2.8%
Cap rate
0.3%
Rent to Value Ratio
Active
$1,200,000
4
bds
|
4
ba
|
4,801
sqft
|
built
1950
1231 Bayou Black Dr, Houma, LA 70360
$-4,092
Cash flow
-17.8%
Cash-on-Cash Return
1.6%
Cap rate
0.2%
Rent to Value Ratio
Active
$185,000
3
bds
|
2
ba
|
1,223
sqft
|
built
2009
417 Tanglewood Dr, Houma, LA 70364
$91
Cash flow
2.6%
Cash-on-Cash Return
6.3%
Cap rate
0.8%
Rent to Value Ratio
Active
$141,000
3
bds
|
2
ba
|
1,932
sqft
|
built
1973
128 Riley Dr, Houma, LA 70363
$299
Cash flow
11.1%
Cash-on-Cash Return
8.2%
Cap rate
1.0%
Rent to Value Ratio
Active
$349,900
4
bds
|
3
ba
|
1,979
sqft
|
built
2015
22 Carrington Cir, Houma, LA 70364
$-276
Cash flow
-4.1%
Cash-on-Cash Return
4.7%
Cap rate
0.6%
Rent to Value Ratio
Active
$239,900
3
bds
|
2
ba
|
1,754
sqft
|
built
1986
507 Wellington Dr, Houma, LA 70360
$-31
Cash flow
-0.7%
Cash-on-Cash Return
5.5%
Cap rate
0.7%
Rent to Value Ratio
Active
$150,000
3
bds
|
2
ba
|
1,030
sqft
|
built
1973
2545 W Main St, Gray, LA 70359
$187
Cash flow
6.5%
Cash-on-Cash Return
7.2%
Cap rate
0.9%
Rent to Value Ratio
Active
$215,000
2
bds
|
2
ba
|
2,003
sqft
|
built
1988
4018 Country Dr, Bourg, LA 70343
$225
Cash flow
5.5%
Cash-on-Cash Return
6.9%
Cap rate
0.8%
Rent to Value Ratio
Active
$315,000
3
bds
|
2
ba
|
1,932
sqft
|
built
1989
4124 Country Dr, Bourg, LA 70343
$-387
Cash flow
-6.4%
Cash-on-Cash Return
4.2%
Cap rate
0.5%
Rent to Value Ratio
Active
$162,000
3
bds
|
2
ba
|
1,425
sqft
|
built
2005
117 Tina St, Houma, LA 70363
$199
Cash flow
6.4%
Cash-on-Cash Return
7.2%
Cap rate
0.9%
Rent to Value Ratio

Active
$750,000
6
bds
|
7
ba
|
7,212
sqft
|
built
1987
317 Bayou Blue Rd, Houma, LA 70364
$-2,031
Cash flow
-14.1%
Cash-on-Cash Return
2.4%
Cap rate
0.3%
Rent to Value Ratio
Active
$125,000
2
bds
|
1
ba
|
1,235
sqft
|
built
1981
1403 Honduras St, Houma, LA 70360
$374
Cash flow
15.6%
Cash-on-Cash Return
9.3%
Cap rate
1.1%
Rent to Value Ratio
Active
$295,000
3
bds
|
3
ba
|
1,982
sqft
|
built
1973
4015 Country Dr, Bourg, LA 70343
$-223
Cash flow
-3.9%
Cash-on-Cash Return
4.8%
Cap rate
0.6%
Rent to Value Ratio
Active
$330,000
3
bds
|
2
ba
|
1,870
sqft
|
built
2005
220 Viola St, Houma, LA 70360
$-182
Cash flow
-2.9%
Cash-on-Cash Return
5.0%
Cap rate
0.6%
Rent to Value Ratio
Active
$148,900
3
bds
|
1
ba
|
1,070
sqft
|
built
1972
69 Kirkglen Loop, Houma, LA 70363
$261
Cash flow
9.1%
Cash-on-Cash Return
7.8%
Cap rate
0.9%
Rent to Value Ratio

Active
$205,000
3
bds
|
2
ba
|
2,076
sqft
|
built
1947
202 Maple Ave, Houma, LA 70364
$272
Cash flow
6.9%
Cash-on-Cash Return
7.3%
Cap rate
0.9%
Rent to Value Ratio
Active
$208,000
3
bds
|
2
ba
|
1,830
sqft
|
built
1973
118 Glynn Ave, Houma, LA 70363
$-18
Cash flow
-0.5%
Cash-on-Cash Return
5.6%
Cap rate
0.7%
Rent to Value Ratio
Active
$349,900
3
bds
|
3
ba
|
1,953
sqft
|
built
2013
219 Mandalay East Dr, Houma, LA 70360
$-345
Cash flow
-5.1%
Cash-on-Cash Return
4.5%
Cap rate
0.5%
Rent to Value Ratio
Active
$987,000
4
bds
|
4
ba
|
3,222
sqft
|
built
2014
187 Regal Row, Houma, LA 70360
$-1,290
Cash flow
-6.8%
Cash-on-Cash Return
4.1%
Cap rate
0.5%
Rent to Value Ratio
Active
$799,000
4
bds
|
3
ba
|
3,883
sqft
|
built
1977
305 Oak Alley Dr, Houma, LA 70360
$-1,849
Cash flow
-12.1%
Cash-on-Cash Return
2.9%
Cap rate
0.4%
Rent to Value Ratio
Active
$268,900
3
bds
|
3
ba
|
1,902
sqft
|
built
1976
1761 Acadian Dr, Houma, LA 70363
$-238
Cash flow
-4.6%
Cash-on-Cash Return
4.6%
Cap rate
0.6%
Rent to Value Ratio
Active
$233,900
4
bds
|
2
ba
|
1,888
sqft
|
built
1975
107 Piping Rock Dr, Houma, LA 70363
$-141
Cash flow
-3.1%
Cash-on-Cash Return
5.0%
Cap rate
0.6%
Rent to Value Ratio
Active
$149,000
2
bds
|
1
ba
|
1,823
sqft
|
built
1992
3004 Sycamore Dr, Houma, LA 70363
$261
Cash flow
9.1%
Cash-on-Cash Return
7.8%
Cap rate
0.9%
Rent to Value Ratio
Active
$299,900
4
bds
|
2
ba
|
1,605
sqft
|
built
1975
1611 Bayou Black Dr, Houma, LA 70360
$-315
Cash flow
-5.5%
Cash-on-Cash Return
4.4%
Cap rate
0.5%
Rent to Value Ratio
Active
$175,000
3
bds
|
2
ba
|
1,031
sqft
|
built
1982
217 Cascade Dr, Houma, LA 70364
$207
Cash flow
6.2%
Cash-on-Cash Return
7.1%
Cap rate
0.9%
Rent to Value Ratio
Active
$339,900
4
bds
|
2
ba
|
2,094
sqft
|
built
1990
411 Valhi Blvd, Houma, LA 70360
$-367
Cash flow
-5.6%
Cash-on-Cash Return
4.4%
Cap rate
0.5%
Rent to Value Ratio
Active
$128,500
2
bds
|
1
ba
|
701
sqft
|
built
1960
140 Texas Gulf Rd, Bourg, LA 70343
$358
Cash flow
14.5%
Cash-on-Cash Return
9.0%
Cap rate
1.1%
Rent to Value Ratio
Active
$190,000
3
bds
|
2
ba
|
1,596
sqft
|
built
1970
524 Oakwood Dr, Houma, LA 70363
$67
Cash flow
1.8%
Cash-on-Cash Return
6.1%
Cap rate
0.7%
Rent to Value Ratio
Active
$220,000
3
bds
|
3
ba
|
1,454
sqft
|
built
1960
303 Hialeah Ave, Houma, LA 70363
$-144
Cash flow
-3.4%
Cash-on-Cash Return
4.9%
Cap rate
0.6%
Rent to Value Ratio
Active
$275,000
3
bds
|
3
ba
|
3,192
sqft
|
built
1965
510 Eighth St, Houma, LA 70364
$-197
Cash flow
-3.7%
Cash-on-Cash Return
4.8%
Cap rate
0.6%
Rent to Value Ratio
Active
$200,000
3
bds
|
2
ba
|
2,374
sqft
|
built
1985
13 Rocky Rd, Houma, LA 70363
$89
Cash flow
2.3%
Cash-on-Cash Return
6.2%
Cap rate
0.8%
Rent to Value Ratio
Active
$220,000
3
bds
|
3
ba
|
2,429
sqft
|
built
1959
1103 Morrison Ave, Houma, LA 70364
$201
Cash flow
4.8%
Cash-on-Cash Return
6.8%
Cap rate
0.8%
Rent to Value Ratio