Lansing, IL Investment Properties for Sale
Browse homes for sale and investment properties in Lansing, IL. Refine your search by price, property type, or more.
Best cash flowing properties in Lansing, IL
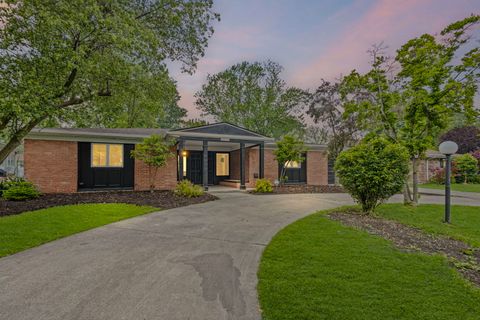
Active
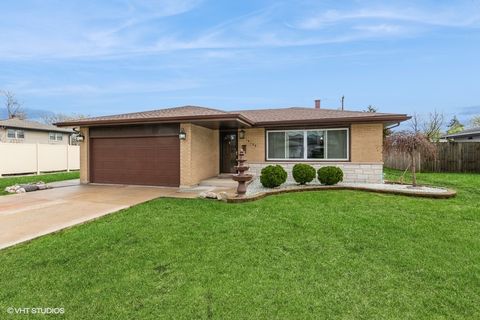
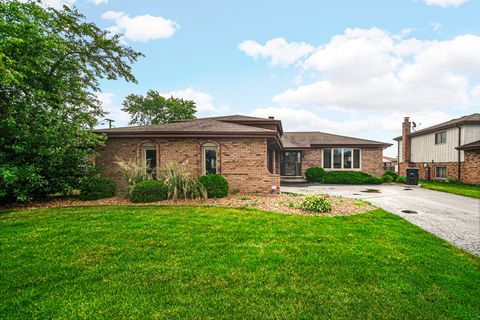
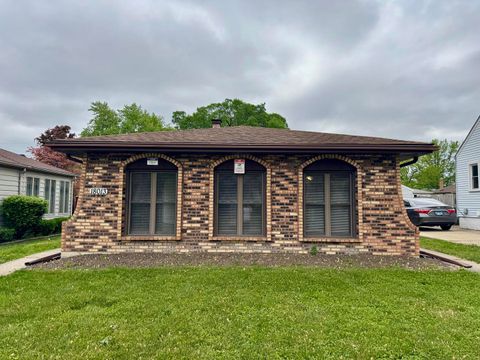
$220,000
3
bds
|
2
ba
|
1,663
sqft
|
built
1949
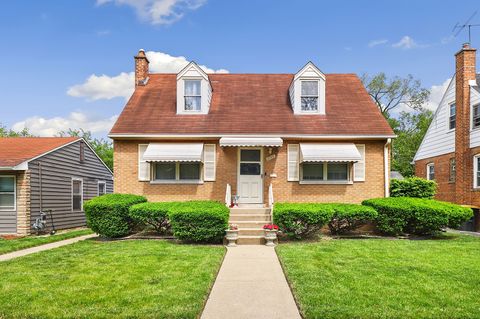
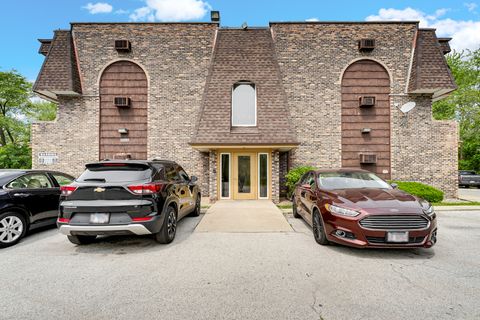
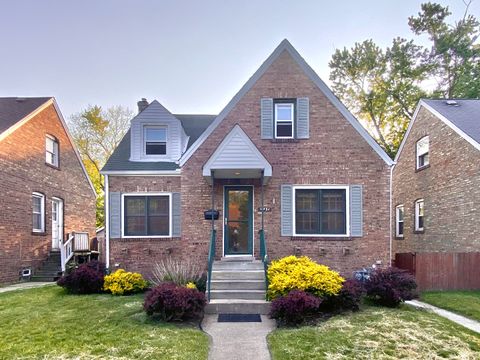
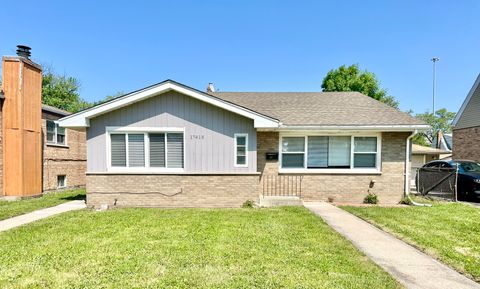
17715 Roy St, Lansing, IL 60438
$477
Cash flow
11.3%
Cash-on-Cash Return
8.3%
Cap rate
1.0%
Rent to Value Ratio
Active
$175,000
3
bds
|
2
ba
|
1,200
sqft
|
built
1893
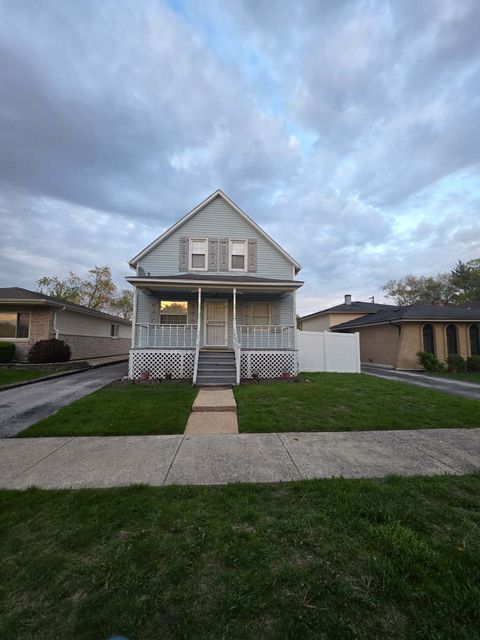
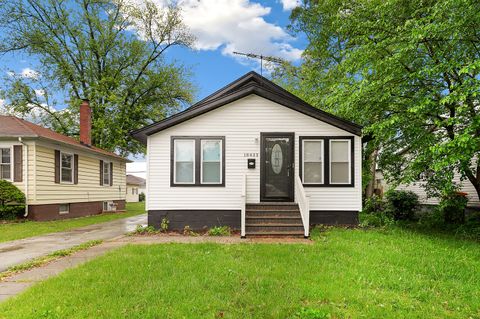
17029 Ridgewood Ave, Lansing, IL 60438
$323
Cash flow
9.6%
Cash-on-Cash Return
7.9%
Cap rate
1.1%
Rent to Value Ratio
86 out of 89 properties for sale in Lansing, IL
Limited Results Shown
Create a free account, or log in to reveal all property listings and enjoy the complete experience.
Active
$468,000
5
bds
|
4
ba
|
2,572
sqft
|
built
2001
18034 Donatus Dr, Lansing, IL 60438
$-1,537
Cash flow
-17.1%
Cash-on-Cash Return
1.7%
Cap rate
0.6%
Rent to Value Ratio
Active
$244,900
3
bds
|
2
ba
|
1,016
sqft
|
built
1962
3034 190th St, Lansing, IL 60438
$-270
Cash flow
-5.8%
Cash-on-Cash Return
4.4%
Cap rate
0.9%
Rent to Value Ratio
Active
$275,800
3
bds
|
2
ba
|
1,613
sqft
|
built
1971
19109 Grant St, Lansing, IL 60438
$-476
Cash flow
-9.0%
Cash-on-Cash Return
4.2%
Cap rate
0.8%
Rent to Value Ratio
Active
$225,999
4
bds
|
2
ba
|
1,903
sqft
|
built
1943
18006 Oakwood Ave, Lansing, IL 60438
$-139
Cash flow
-3.2%
Cash-on-Cash Return
4.9%
Cap rate
1.1%
Rent to Value Ratio
Active
$449,900
4
bds
|
3
ba
|
2,500
sqft
|
built
1996
18036 Crystal Ln, Lansing, IL 60438
$-408
Cash flow
-4.7%
Cash-on-Cash Return
5.2%
Cap rate
0.8%
Rent to Value Ratio
Active
$227,000
3
bds
|
1
ba
|
1,168
sqft
|
built
1949
18052 Commercial Ave, Lansing, IL 60438
$-300
Cash flow
-6.9%
Cash-on-Cash Return
4.7%
Cap rate
0.9%
Rent to Value Ratio
Active
$132,000
2
bds
|
1
ba
|
900
sqft
|
built
1981
2237 175th St, Lansing, IL 60438
$-198
Cash flow
-7.8%
Cash-on-Cash Return
4.4%
Cap rate
1.1%
Rent to Value Ratio
Active
$159,900
3
bds
|
2
ba
|
1,550
sqft
|
built
1948
3645 177th Pl, Lansing, IL 60438
$64
Cash flow
2.1%
Cash-on-Cash Return
6.2%
Cap rate
1.1%
Rent to Value Ratio
Active
$235,000
3
bds
|
2
ba
|
1,323
sqft
|
built
1959
2621 Ridge Rd, Lansing, IL 60438
$-203
Cash flow
-4.5%
Cash-on-Cash Return
4.6%
Cap rate
0.9%
Rent to Value Ratio
Active
$254,000
3
bds
|
2
ba
|
1,450
sqft
|
built
1943
18101 Wildwood Ave, Lansing, IL 60438
$-366
Cash flow
-7.5%
Cash-on-Cash Return
4.5%
Cap rate
0.9%
Rent to Value Ratio
Active
$265,000
3
bds
|
2
ba
|
1,396
sqft
|
built
1984
19221 Grant St, Lansing, IL 60438
$-371
Cash flow
-7.3%
Cash-on-Cash Return
4.0%
Cap rate
0.9%
Rent to Value Ratio
Active
$130,000
2
bds
|
1
ba
|
900
sqft
|
built
1981
2237 175th St, Lansing, IL 60438
$90
Cash flow
3.6%
Cash-on-Cash Return
7.1%
Cap rate
1.4%
Rent to Value Ratio
Active
$345,000
5
bds
|
4
ba
|
0
sqft
|
built
1962
18377 Torrence Ave, Lansing, IL 60438
$-1,341
Cash flow
-20.3%
Cash-on-Cash Return
1.6%
Cap rate
0.6%
Rent to Value Ratio
Active
$129,900
3
bds
|
2
ba
|
1,100
sqft
|
built
1992
2345 185th Ct, Lansing, IL 60438
$-49
Cash flow
-2.0%
Cash-on-Cash Return
5.2%
Cap rate
1.2%
Rent to Value Ratio
Active
$85,000
2
bds
|
2
ba
|
0
sqft
|
built
1923
18340 Glen Oak Ave, Lansing, IL 60438
$117
Cash flow
7.2%
Cash-on-Cash Return
7.9%
Cap rate
1.6%
Rent to Value Ratio
Active
$360,000
4
bds
|
3
ba
|
2,100
sqft
|
built
1989
18068 Jason Ln, Lansing, IL 60438
$-1,021
Cash flow
-14.8%
Cash-on-Cash Return
2.8%
Cap rate
0.7%
Rent to Value Ratio
Active
$399,900
3
bds
|
3
ba
|
1,866
sqft
|
built
1985
18038 Whitman Ln, Lansing, IL 60438
$-1,203
Cash flow
-15.7%
Cash-on-Cash Return
2.1%
Cap rate
0.6%
Rent to Value Ratio
Active
$269,900
3
bds
|
2
ba
|
1,952
sqft
|
built
1941
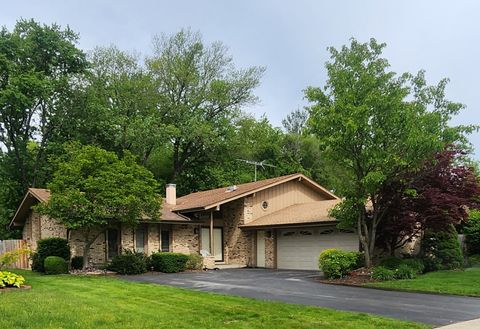
3666 176th Pl, Lansing, IL 60438
$-198
Cash flow
-3.8%
Cash-on-Cash Return
4.8%
Cap rate
0.8%
Rent to Value Ratio

Active
$325,000
4
bds
|
2
ba
|
2,434
sqft
|
built
1988
19205 Ada St, Lansing, IL 60438
$-753
Cash flow
-12.1%
Cash-on-Cash Return
3.5%
Cap rate
0.9%
Rent to Value Ratio
Active
$174,999
2
bds
|
2
ba
|
1,200
sqft
|
built
1996
3640 186th St, Lansing, IL 60438
$-79
Cash flow
-2.4%
Cash-on-Cash Return
5.1%
Cap rate
1.1%
Rent to Value Ratio
Active
$249,990
3
bds
|
1
ba
|
2,575
sqft
|
built
1956
2270 177th St, Lansing, IL 60438
$-115
Cash flow
-2.4%
Cash-on-Cash Return
5.1%
Cap rate
0.8%
Rent to Value Ratio
Active
$199,990
3
bds
|
2
ba
|
1,176
sqft
|
built
1961
17552 State Line Ave, Lansing, IL 60438
$11
Cash flow
0.3%
Cash-on-Cash Return
5.7%
Cap rate
1.0%
Rent to Value Ratio
Active
$219,900
3
bds
|
1
ba
|
1,144
sqft
|
built
1959
2258 177th St, Lansing, IL 60438
$-125
Cash flow
-3.0%
Cash-on-Cash Return
5.0%
Cap rate
0.9%
Rent to Value Ratio
Active
$397,000
5
bds
|
3
ba
|
2,431
sqft
|
built
1961
18908 E Louise Dr, Lansing, IL 60438
$-1,178
Cash flow
-15.5%
Cash-on-Cash Return
2.1%
Cap rate
0.6%
Rent to Value Ratio
Active
$289,000
4
bds
|
3
ba
|
1,200
sqft
|
built
1967
17128 Grant St, Lansing, IL 60438
$-553
Cash flow
-10.0%
Cash-on-Cash Return
3.4%
Cap rate
0.7%
Rent to Value Ratio
Active
$259,700
3
bds
|
2
ba
|
1,301
sqft
|
built
1954
17303 Chicago Ave, Lansing, IL 60438
$-271
Cash flow
-5.4%
Cash-on-Cash Return
4.4%
Cap rate
0.7%
Rent to Value Ratio
Active
$284,900
3
bds
|
2
ba
|
1,610
sqft
|
built
1968
2849 191st Pl, Lansing, IL 60438
$-402
Cash flow
-7.4%
Cash-on-Cash Return
4.0%
Cap rate
0.8%
Rent to Value Ratio
Active
$240,000
4
bds
|
2
ba
|
1,900
sqft
|
built
1942
18034 Ridgewood Ave, Lansing, IL 60438
$-101
Cash flow
-2.2%
Cash-on-Cash Return
5.2%
Cap rate
1.0%
Rent to Value Ratio
Active
$75,000
1
bds
|
1
ba
|
800
sqft
|
built
1967
2303 Holiday Ter, Lansing, IL 60438
$163
Cash flow
11.3%
Cash-on-Cash Return
8.3%
Cap rate
1.5%
Rent to Value Ratio
Active
$219,000
2
bds
|
2
ba
|
1,412
sqft
|
built
1951
17745 Burnham Ave, Lansing, IL 60438
$-295
Cash flow
-7.0%
Cash-on-Cash Return
4.1%
Cap rate
0.7%
Rent to Value Ratio
Active
$127,900
2
bds
|
2
ba
|
1,200
sqft
|
built
1972
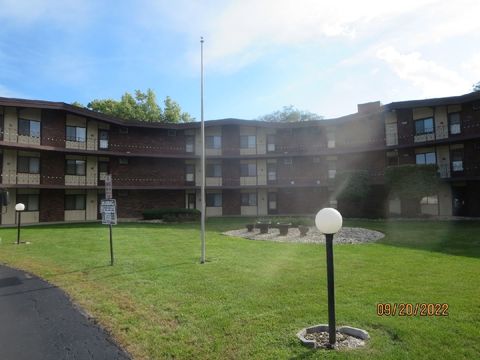
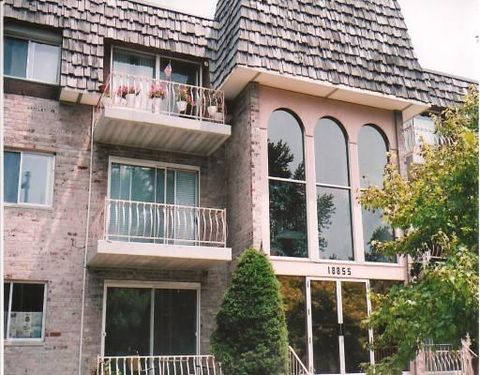
18855 Burnham Ave, Lansing, IL 60438
$-56
Cash flow
-2.3%
Cash-on-Cash Return
5.2%
Cap rate
1.4%
Rent to Value Ratio
Active
$224,000
3
bds
|
2
ba
|
1,350
sqft
|
built
1957
17415 Burnham Ave, Lansing, IL 60438
$98
Cash flow
2.3%
Cash-on-Cash Return
6.2%
Cap rate
0.9%
Rent to Value Ratio
Active
$135,000
2
bds
|
1
ba
|
900
sqft
|
built
1981
2237 175th St, Lansing, IL 60438
$187
Cash flow
7.2%
Cash-on-Cash Return
7.3%
Cap rate
1.2%
Rent to Value Ratio
Active
$249,900
2
bds
|
2
ba
|
0
sqft
|
built
1932
18433 Ridgewood Ave, Lansing, IL 60438
$-206
Cash flow
-4.3%
Cash-on-Cash Return
4.7%
Cap rate
0.8%
Rent to Value Ratio
Active
$224,900
3
bds
|
1
ba
|
1,311
sqft
|
built
1954
18418 Chicago Ave, Lansing, IL 60438
$121
Cash flow
2.8%
Cash-on-Cash Return
6.3%
Cap rate
0.9%
Rent to Value Ratio
Active
$230,000
3
bds
|
2
ba
|
1,200
sqft
|
built
1980
18013 Park Ave, Lansing, IL 60438
$-337
Cash flow
-7.6%
Cash-on-Cash Return
3.9%
Cap rate
0.9%
Rent to Value Ratio
Active
$129,900
2
bds
|
1
ba
|
900
sqft
|
built
1974
3010 Bernice Rd, Lansing, IL 60438
$142
Cash flow
5.7%
Cash-on-Cash Return
7.0%
Cap rate
1.2%
Rent to Value Ratio
Active
$279,000
3
bds
|
3
ba
|
2,028
sqft
|
built
1960
18433 Arcadia Ave, Lansing, IL 60438
$-475
Cash flow
-8.9%
Cash-on-Cash Return
3.6%
Cap rate
0.8%
Rent to Value Ratio