Lansing, IL Investment Properties for Sale
Browse homes for sale and investment properties in Lansing, IL. Refine your search by price, property type, or more.
Best cash flowing properties in Lansing, IL
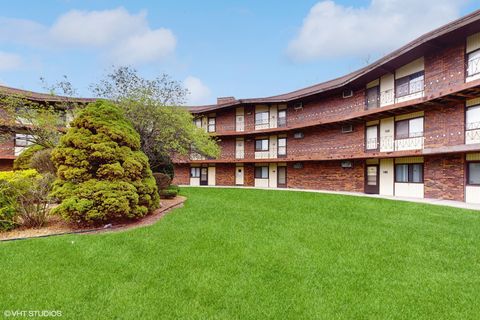
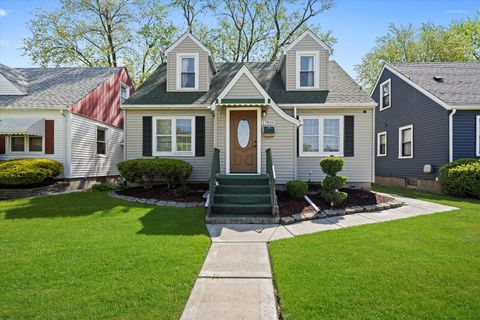
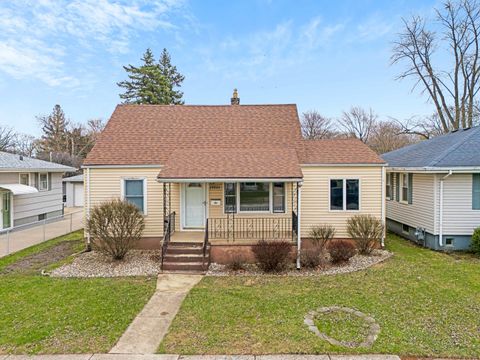
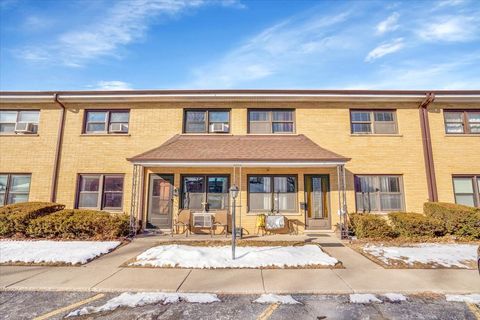
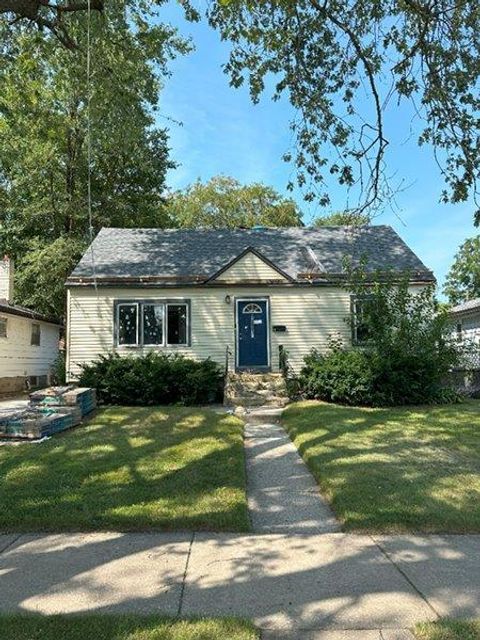
Active
$69,000
1
bds
|
1
ba
|
900
sqft
|
built
1967
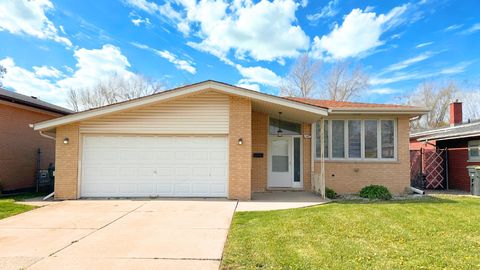
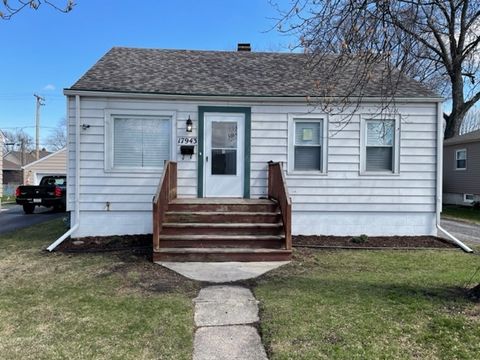
2306 Holiday Ter, Lansing, IL 60438
$674
Cash flow
11.4%
Cash-on-Cash Return
11.7%
Cap rate
2.0%
Rent to Value Ratio
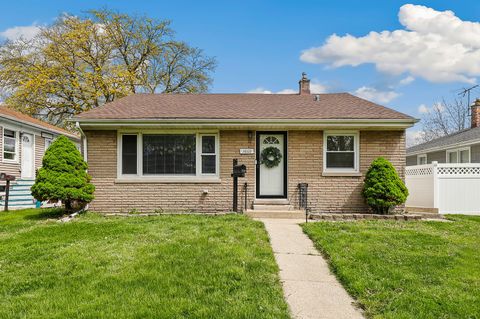
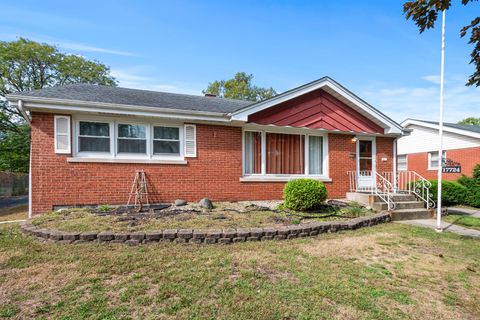
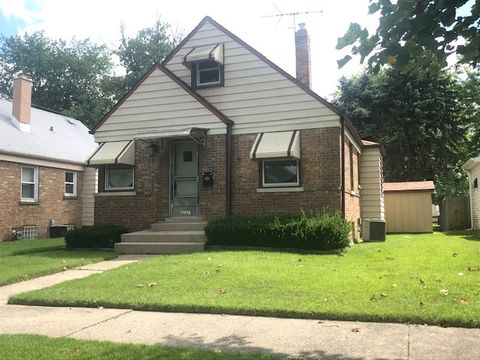
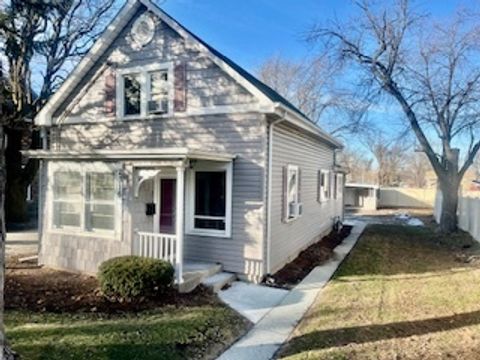
Active
$137,000
2
bds
|
1
ba
|
925
sqft
|
built
1949
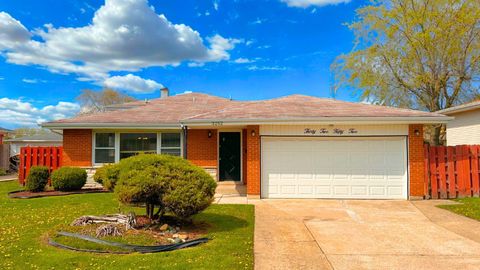
18269 Burnham Ave, Lansing, IL 60438
$564
Cash flow
21.5%
Cash-on-Cash Return
10.6%
Cap rate
1.3%
Rent to Value Ratio
75 out of 77 properties for sale in Lansing, IL
Limited Results Shown
Create a free account, or log in to reveal all property listings and enjoy the complete experience.
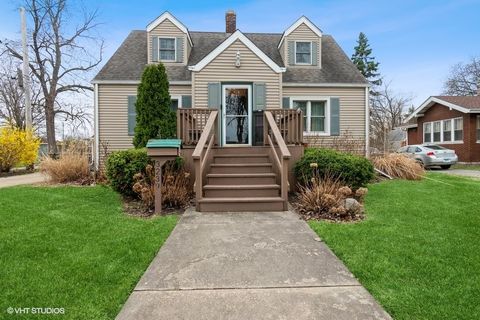
Active
$255,000
3
bds
|
2
ba
|
1,376
sqft
|
built
1960
18828 Greenbay Ave, Lansing, IL 60438
$21
Cash flow
0.4%
Cash-on-Cash Return
5.8%
Cap rate
1.0%
Rent to Value Ratio
Active
$199,999
3
bds
|
2
ba
|
1,300
sqft
|
built
1950
3313 178th St, Lansing, IL 60438
$-130
Cash flow
-3.4%
Cash-on-Cash Return
4.9%
Cap rate
1.0%
Rent to Value Ratio
Active
$220,000
3
bds
|
3
ba
|
1,221
sqft
|
built
1948
17819 Walter St, Lansing, IL 60438
$-92
Cash flow
-2.2%
Cash-on-Cash Return
5.2%
Cap rate
0.9%
Rent to Value Ratio
Active
$210,000
3
bds
|
2
ba
|
1,414
sqft
|
built
1952
3668 Adams St, Lansing, IL 60438
$-203
Cash flow
-5.0%
Cash-on-Cash Return
4.5%
Cap rate
1.0%
Rent to Value Ratio
Active
$239,900
4
bds
|
2
ba
|
1,264
sqft
|
built
1973
18727 Sherman St, Lansing, IL 60438
$129
Cash flow
2.8%
Cash-on-Cash Return
6.9%
Cap rate
0.9%
Rent to Value Ratio
Active
$146,900
2
bds
|
1
ba
|
800
sqft
|
built
1970
3240 N Manor Dr, Lansing, IL 60438
$-110
Cash flow
-3.9%
Cash-on-Cash Return
4.8%
Cap rate
1.0%
Rent to Value Ratio
Active
$247,000
3
bds
|
2
ba
|
0
sqft
|
built
1969
3460 170th Pl, Lansing, IL 60438
$-474
Cash flow
-10.0%
Cash-on-Cash Return
3.4%
Cap rate
0.8%
Rent to Value Ratio
Active
$234,000
3
bds
|
2
ba
|
1,104
sqft
|
built
1972
3252 191st St, Lansing, IL 60438
$-339
Cash flow
-7.6%
Cash-on-Cash Return
3.9%
Cap rate
0.9%
Rent to Value Ratio
Active
$189,900
5
bds
|
3
ba
|
0
sqft
|
built
1892
3627 Ridge Rd, Lansing, IL 60438
$-662
Cash flow
-18.2%
Cash-on-Cash Return
1.5%
Cap rate
0.8%
Rent to Value Ratio
Active
$299,000
3
bds
|
2
ba
|
1,689
sqft
|
built
1973
3542 191st Pl, Lansing, IL 60438
$-354
Cash flow
-6.2%
Cash-on-Cash Return
4.3%
Cap rate
0.8%
Rent to Value Ratio
Active
$215,000
4
bds
|
1
ba
|
1,400
sqft
|
built
1949
17851 Park Ave, Lansing, IL 60438
$151
Cash flow
3.7%
Cash-on-Cash Return
6.5%
Cap rate
0.9%
Rent to Value Ratio
Active
$420,000
4
bds
|
3
ba
|
2,479
sqft
|
built
2001
18020 Charlotte Dr, Lansing, IL 60438
$-789
Cash flow
-9.8%
Cash-on-Cash Return
3.4%
Cap rate
0.7%
Rent to Value Ratio
Active
$209,900
3
bds
|
2
ba
|
1,200
sqft
|
built
1957
17724 Henry St, Lansing, IL 60438
$-269
Cash flow
-6.7%
Cash-on-Cash Return
4.1%
Cap rate
1.0%
Rent to Value Ratio
Active
$154,900
2
bds
|
1
ba
|
945
sqft
|
built
1954
17006 Park Ave, Lansing, IL 60438
$329
Cash flow
11.1%
Cash-on-Cash Return
8.2%
Cap rate
1.2%
Rent to Value Ratio
Active
$255,000
3
bds
|
3
ba
|
1,668
sqft
|
built
1940
3239 181st St, Lansing, IL 60438
$-415
Cash flow
-8.5%
Cash-on-Cash Return
3.7%
Cap rate
0.9%
Rent to Value Ratio
Active
$287,450
3
bds
|
3
ba
|
1,649
sqft
|
built
2001
17747 Paxton Ave, Lansing, IL 60438
$-426
Cash flow
-7.7%
Cash-on-Cash Return
3.9%
Cap rate
0.8%
Rent to Value Ratio

Active
$209,000
3
bds
|
2
ba
|
1,200
sqft
|
built
1969
18550 Torrence Ave, Lansing, IL 60438
$-504
Cash flow
-12.6%
Cash-on-Cash Return
2.8%
Cap rate
0.8%
Rent to Value Ratio
Active
$163,000
3
bds
|
1
ba
|
1,450
sqft
|
built
1898
2830 Bernice Rd, Lansing, IL 60438
$226
Cash flow
7.2%
Cash-on-Cash Return
7.3%
Cap rate
1.2%
Rent to Value Ratio

Active
$95,000
2
bds
|
1
ba
|
630
sqft
|
built
1969
18318 Exchange Ave, Lansing, IL 60438
$49
Cash flow
2.7%
Cash-on-Cash Return
6.3%
Cap rate
1.5%
Rent to Value Ratio
Active
$224,000
3
bds
|
1
ba
|
1,080
sqft
|
built
1942
18017 Oakwood Ave, Lansing, IL 60438
$-145
Cash flow
-3.4%
Cash-on-Cash Return
4.9%
Cap rate
0.9%
Rent to Value Ratio
Active
$145,000
2
bds
|
2
ba
|
1,400
sqft
|
built
1969
18333 Wentworth Ave, Lansing, IL 60438
$39
Cash flow
1.4%
Cash-on-Cash Return
6.0%
Cap rate
1.1%
Rent to Value Ratio
Active
$205,000
3
bds
|
1
ba
|
900
sqft
|
built
1948
17819 Commercial Ave, Lansing, IL 60438
$39
Cash flow
1.0%
Cash-on-Cash Return
5.9%
Cap rate
1.0%
Rent to Value Ratio
Active
$118,000
2
bds
|
1
ba
|
0
sqft
|
built
1950
17048 Lorenz Ave, Lansing, IL 60438
$183
Cash flow
8.1%
Cash-on-Cash Return
7.5%
Cap rate
1.4%
Rent to Value Ratio
Active
$220,000
3
bds
|
2
ba
|
0
sqft
|
built
1949
17603 Community St, Lansing, IL 60438
$-169
Cash flow
-4.0%
Cash-on-Cash Return
4.8%
Cap rate
0.9%
Rent to Value Ratio
Active
$184,000
2
bds
|
1
ba
|
780
sqft
|
built
1949
17943 Ridgewood Ave, Lansing, IL 60438
$-25
Cash flow
-0.7%
Cash-on-Cash Return
5.5%
Cap rate
1.0%
Rent to Value Ratio
Active
$190,000
3
bds
|
1
ba
|
1,147
sqft
|
built
1960
17331 Community St, Lansing, IL 60438
$-101
Cash flow
-2.8%
Cash-on-Cash Return
5.0%
Cap rate
0.9%
Rent to Value Ratio
Active
$277,800
3
bds
|
2
ba
|
1,496
sqft
|
built
1964
18901 Ridgewood Ave, Lansing, IL 60438
$345
Cash flow
6.5%
Cash-on-Cash Return
7.2%
Cap rate
0.9%
Rent to Value Ratio
Active
$240,000
3
bds
|
5
ba
|
1,416
sqft
|
built
1965
17517 Shirley Dr, Lansing, IL 60438
$-98
Cash flow
-2.1%
Cash-on-Cash Return
5.2%
Cap rate
0.8%
Rent to Value Ratio
Active
$99,000
4
bds
|
1
ba
|
1,296
sqft
|
built
1947
18018 Park Ave, Lansing, IL 60438
$494
Cash flow
26.0%
Cash-on-Cash Return
11.7%
Cap rate
1.8%
Rent to Value Ratio
Active
$144,900
3
bds
|
1
ba
|
1,104
sqft
|
built
1917
2316 Thornton Lansing Rd, Lansing, IL 60438
$264
Cash flow
9.5%
Cash-on-Cash Return
7.9%
Cap rate
1.2%
Rent to Value Ratio
Active
$289,900
3
bds
|
2
ba
|
1,535
sqft
|
built
1965
18947 Ridgewood Ave, Lansing, IL 60438
$-10
Cash flow
-0.2%
Cash-on-Cash Return
5.6%
Cap rate
1.0%
Rent to Value Ratio
Active
$175,000
3
bds
|
1
ba
|
942
sqft
|
built
1943
17912 School St, Lansing, IL 60438
$169
Cash flow
5.0%
Cash-on-Cash Return
6.8%
Cap rate
1.1%
Rent to Value Ratio
Active
$435,000
4
bds
|
3
ba
|
2,734
sqft
|
built
1993
18140 Crystal Ln, Lansing, IL 60438
$-579
Cash flow
-6.9%
Cash-on-Cash Return
4.1%
Cap rate
0.8%
Rent to Value Ratio