Las Vegas, NV Investment Properties for Sale
Browse homes for sale and investment properties in Las Vegas, NV. Refine your search by price, property type, or more.
Best cash flowing properties in Las Vegas, NV
Active
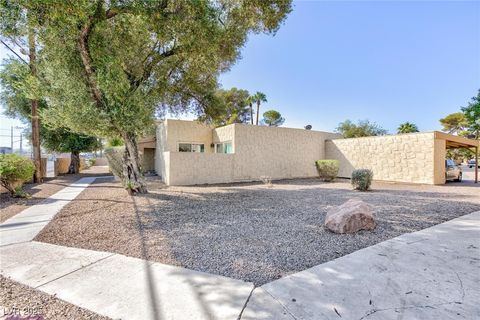
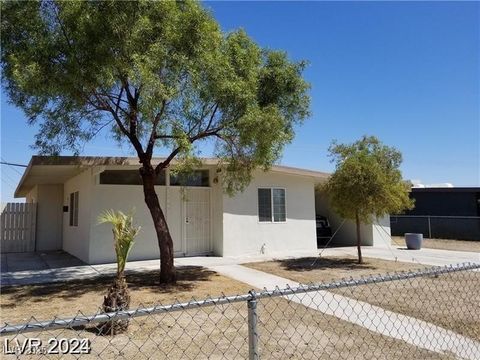
$99,000
2
bds
|
2
ba
|
1,185
sqft
|
built
1973
45 N Lamb Blvd, Las Vegas, NV 89110
$490
Cash flow
25.8%
Cash-on-Cash Return
11.6%
Cap rate
1.7%
Rent to Value Ratio
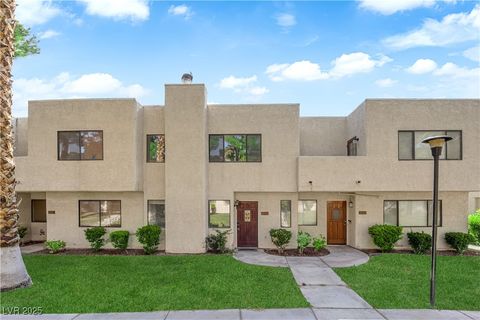
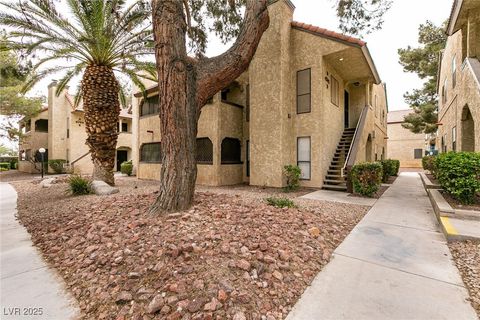
Active
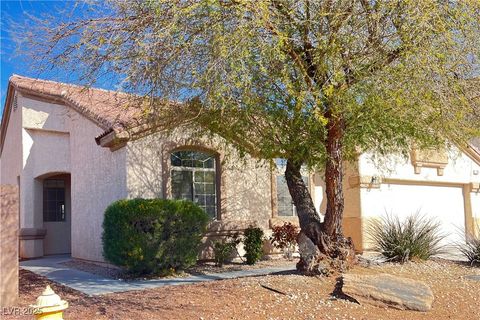
$239,000
2
bds
|
2
ba
|
1,304
sqft
|
built
1989
2661 Ruthe Duarte Ave, Las Vegas, NV 89121
$-281
Cash flow
-6.1%
Cash-on-Cash Return
4.3%
Cap rate
0.7%
Rent to Value Ratio
5,187 out of 5,310 properties for sale in Las Vegas, NV
Limited Results Shown
Create a free account, or log in to reveal all property listings and enjoy the complete experience.
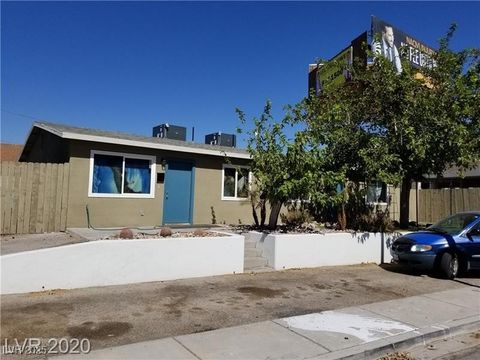
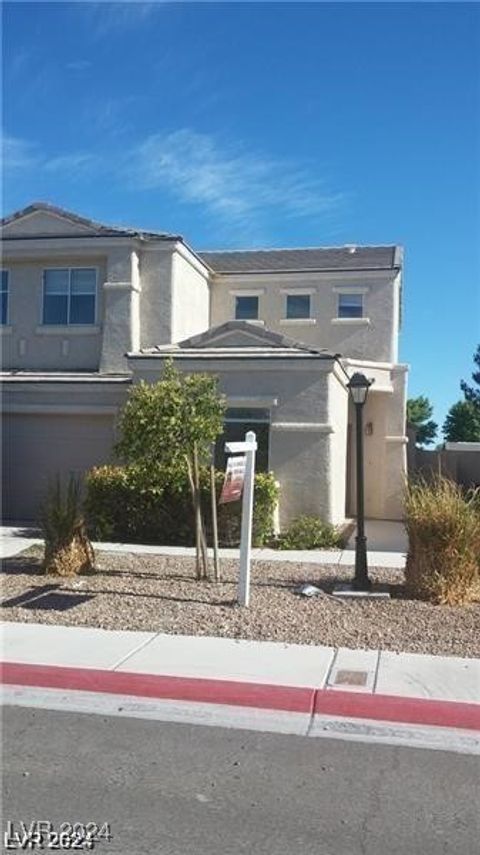
Active
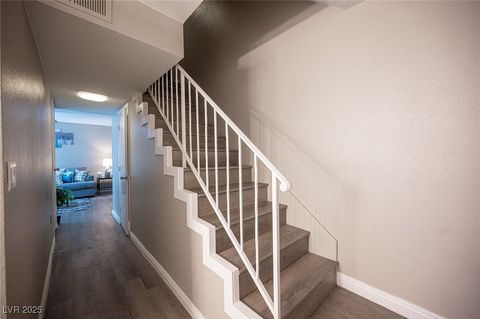
$485,000
4
bds
|
0
ba
|
1,480
sqft
|
built
1942
333 N 13th St, Las Vegas, NV 89101
$-1,499
Cash flow
-16.1%
Cash-on-Cash Return
2.0%
Cap rate
0.3%
Rent to Value Ratio
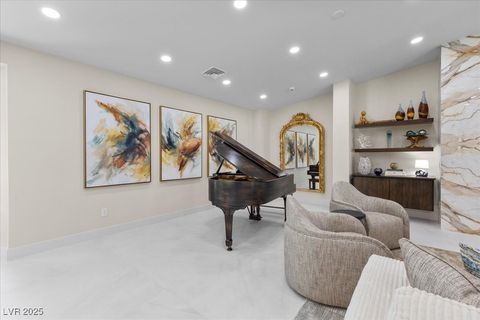
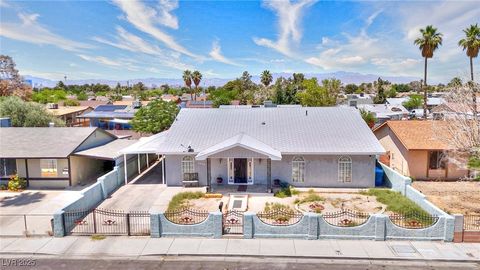
Active
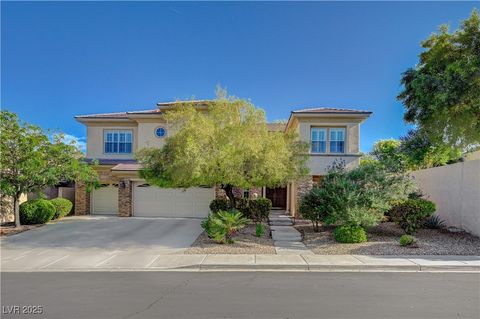
$2,490,000
4
bds
|
5
ba
|
5,397
sqft
|
built
2022
3104 Conners Dr, Las Vegas, NV 89107
$-4,458
Cash flow
-9.3%
Cash-on-Cash Return
3.5%
Cap rate
0.5%
Rent to Value Ratio
Active
$735,000
3
bds
|
2
ba
|
2,514
sqft
|
built
1993
1609 Hidden Spring Dr, Las Vegas, NV 89117
$-1,383
Cash flow
-9.8%
Cash-on-Cash Return
3.4%
Cap rate
0.5%
Rent to Value Ratio
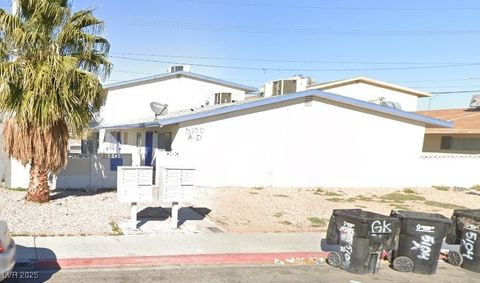
Active
$669,500
8
bds
|
0
ba
|
3,196
sqft
|
built
1962
5100 Pebble Beach Blvd, Las Vegas, NV 89108
$-1,922
Cash flow
-15.0%
Cash-on-Cash Return
2.2%
Cap rate
0.3%
Rent to Value Ratio

Active
$797,000
4
bds
|
4
ba
|
3,796
sqft
|
built
2008
7778 Villa Montara St, Las Vegas, NV 89123
$-1,842
Cash flow
-12.1%
Cash-on-Cash Return
2.9%
Cap rate
0.4%
Rent to Value Ratio
Active
$489,000
5
bds
|
3
ba
|
2,448
sqft
|
built
1972
1112 Sandy Cove St, Las Vegas, NV 89110
$-714
Cash flow
-7.6%
Cash-on-Cash Return
3.9%
Cap rate
0.5%
Rent to Value Ratio
Active
$2,500,000
4
bds
|
6
ba
|
7,713
sqft
|
built
1989
42 Sawgrass Ct, Las Vegas, NV 89113
$-6,841
Cash flow
-14.3%
Cash-on-Cash Return
2.4%
Cap rate
0.4%
Rent to Value Ratio

Active
$189,000
1
bds
|
1
ba
|
704
sqft
|
built
1989
3151 Soaring Gulls Dr, Las Vegas, NV 89128
$-400
Cash flow
-11.0%
Cash-on-Cash Return
3.1%
Cap rate
0.6%
Rent to Value Ratio
Active
$215,000
2
bds
|
1
ba
|
921
sqft
|
built
1996
3125 N Buffalo Dr, Las Vegas, NV 89128
$-463
Cash flow
-11.2%
Cash-on-Cash Return
3.1%
Cap rate
0.7%
Rent to Value Ratio

Active
$520,000
4
bds
|
2
ba
|
2,436
sqft
|
built
1977
6202 La Palma Pkwy, Las Vegas, NV 89118
$-1,069
Cash flow
-10.7%
Cash-on-Cash Return
3.2%
Cap rate
0.4%
Rent to Value Ratio
Active
$235,500
2
bds
|
2
ba
|
968
sqft
|
built
1978
250 Shadybrook Ln, Las Vegas, NV 89107
$-522
Cash flow
-11.6%
Cash-on-Cash Return
3.0%
Cap rate
0.6%
Rent to Value Ratio
Active
$229,950
2
bds
|
2
ba
|
912
sqft
|
built
1986
829 Rock Springs Dr, Las Vegas, NV 89128
$-593
Cash flow
-13.5%
Cash-on-Cash Return
2.6%
Cap rate
0.5%
Rent to Value Ratio
Active
$225,000
2
bds
|
2
ba
|
912
sqft
|
built
1989
7948 Calico Vista Blvd, Las Vegas, NV 89128
$-412
Cash flow
-9.6%
Cash-on-Cash Return
3.5%
Cap rate
0.6%
Rent to Value Ratio
Active
$220,000
2
bds
|
2
ba
|
912
sqft
|
built
1987
1201 N Buffalo Dr, Las Vegas, NV 89128
$-520
Cash flow
-12.3%
Cash-on-Cash Return
2.8%
Cap rate
0.5%
Rent to Value Ratio
Active
$420,000
2
bds
|
2
ba
|
1,427
sqft
|
built
1999
805 Dana Hills Ct, Las Vegas, NV 89134
$-1,083
Cash flow
-13.5%
Cash-on-Cash Return
2.6%
Cap rate
0.5%
Rent to Value Ratio
Active
$205,000
2
bds
|
2
ba
|
876
sqft
|
built
1989
211 Mission Laguna Ln, Las Vegas, NV 89107
$-510
Cash flow
-13.0%
Cash-on-Cash Return
2.7%
Cap rate
0.6%
Rent to Value Ratio
Active
$219,000
2
bds
|
2
ba
|
978
sqft
|
built
1989
227 N Lamb Blvd, Las Vegas, NV 89110
$-337
Cash flow
-8.0%
Cash-on-Cash Return
3.8%
Cap rate
0.6%
Rent to Value Ratio
Active
$479,900
4
bds
|
3
ba
|
1,891
sqft
|
built
1999
5501 Wells Cathedral Ave, Las Vegas, NV 89130
$-1,161
Cash flow
-12.6%
Cash-on-Cash Return
2.8%
Cap rate
0.4%
Rent to Value Ratio
Active
$223,500
1
bds
|
1
ba
|
907
sqft
|
built
1987
5024 S Rainbow Blvd, Las Vegas, NV 89118
$-341
Cash flow
-8.0%
Cash-on-Cash Return
3.8%
Cap rate
0.6%
Rent to Value Ratio
Active
$229,750
1
bds
|
1
ba
|
743
sqft
|
built
2002
7143 S Durango Dr, Las Vegas, NV 89113
$-512
Cash flow
-11.6%
Cash-on-Cash Return
3.0%
Cap rate
0.6%
Rent to Value Ratio
Active
$199,000
2
bds
|
2
ba
|
978
sqft
|
built
1982
4421 Alexis Dr, Las Vegas, NV 89103
$-400
Cash flow
-10.5%
Cash-on-Cash Return
3.3%
Cap rate
0.7%
Rent to Value Ratio
Active
$225,000
2
bds
|
2
ba
|
1,073
sqft
|
built
1982
4742 Obannon Dr, Las Vegas, NV 89102
$-479
Cash flow
-11.1%
Cash-on-Cash Return
3.1%
Cap rate
0.6%
Rent to Value Ratio
Active
$325,000
2
bds
|
2
ba
|
1,248
sqft
|
built
2007
3975 N Hualapai Way, Las Vegas, NV 89129
$-647
Cash flow
-10.4%
Cash-on-Cash Return
3.3%
Cap rate
0.6%
Rent to Value Ratio
Active
$599,999
4
bds
|
3
ba
|
2,106
sqft
|
built
1979
5301 Kalmia Dr, Las Vegas, NV 89103
$-895
Cash flow
-7.8%
Cash-on-Cash Return
3.9%
Cap rate
0.5%
Rent to Value Ratio
Active
$394,900
3
bds
|
2
ba
|
1,260
sqft
|
built
1981
6760 Fallona Ave, Las Vegas, NV 89156
$-781
Cash flow
-10.3%
Cash-on-Cash Return
3.3%
Cap rate
0.4%
Rent to Value Ratio
Active
$719,900
4
bds
|
3
ba
|
2,475
sqft
|
built
1996
9900 Summer Ash Ct, Las Vegas, NV 89134
$-2,365
Cash flow
-17.1%
Cash-on-Cash Return
1.7%
Cap rate
0.3%
Rent to Value Ratio
Active
$284,999
3
bds
|
2
ba
|
1,258
sqft
|
built
1994
8452 Boseck Dr, Las Vegas, NV 89145
$-474
Cash flow
-8.7%
Cash-on-Cash Return
3.7%
Cap rate
0.6%
Rent to Value Ratio

Active
$519,900
3
bds
|
3
ba
|
1,770
sqft
|
built
2003
5220 Melbourne Ridge Ct, Las Vegas, NV 89141
$-951
Cash flow
-9.5%
Cash-on-Cash Return
3.5%
Cap rate
0.5%
Rent to Value Ratio
Active
$435,000
4
bds
|
2
ba
|
1,828
sqft
|
built
2004
7348 Zion Falls St, Las Vegas, NV 89131
$-793
Cash flow
-9.5%
Cash-on-Cash Return
3.5%
Cap rate
0.5%
Rent to Value Ratio
Active
$220,000
2
bds
|
2
ba
|
1,047
sqft
|
built
2000
5710 E Tropicana Ave, Las Vegas, NV 89122
$-397
Cash flow
-9.4%
Cash-on-Cash Return
3.5%
Cap rate
0.6%
Rent to Value Ratio

Active
$169,900
1
bds
|
1
ba
|
695
sqft
|
built
1999
5710 E Tropicana Ave, Las Vegas, NV 89122
$-322
Cash flow
-9.9%
Cash-on-Cash Return
3.4%
Cap rate
0.6%
Rent to Value Ratio
Active
$379,900
4
bds
|
2
ba
|
1,257
sqft
|
built
1957
2705 Howard Dr, Las Vegas, NV 89104
$-809
Cash flow
-11.1%
Cash-on-Cash Return
3.1%
Cap rate
0.4%
Rent to Value Ratio
Active
$433,000
3
bds
|
2
ba
|
1,674
sqft
|
built
2002
7515 Splashing Rock Dr, Las Vegas, NV 89131
$-930
Cash flow
-11.2%
Cash-on-Cash Return
3.1%
Cap rate
0.5%
Rent to Value Ratio
Active
$315,000
3
bds
|
3
ba
|
1,196
sqft
|
built
1973
1511 Living Desert Dr, Las Vegas, NV 89119
$-606
Cash flow
-10.0%
Cash-on-Cash Return
3.4%
Cap rate
0.6%
Rent to Value Ratio

Active
$190,000
2
bds
|
1
ba
|
792
sqft
|
built
1972
1553 Dorothy Ave, Las Vegas, NV 89119
$-391
Cash flow
-10.7%
Cash-on-Cash Return
3.2%
Cap rate
0.6%
Rent to Value Ratio
Active
$1,249,999
5
bds
|
5
ba
|
3,535
sqft
|
built
2003
10729 Grey Havens Ct, Las Vegas, NV 89135
$-3,762
Cash flow
-15.7%
Cash-on-Cash Return
2.1%
Cap rate
0.4%
Rent to Value Ratio

Active
$235,000
1
bds
|
1
ba
|
897
sqft
|
built
1973
2855 Geary Pl, Las Vegas, NV 89109
$-667
Cash flow
-14.8%
Cash-on-Cash Return
2.3%
Cap rate
0.6%
Rent to Value Ratio
Active
$257,000
2
bds
|
2
ba
|
1,034
sqft
|
built
1997
5250 S Rainbow Blvd, Las Vegas, NV 89118
$-663
Cash flow
-13.5%
Cash-on-Cash Return
2.6%
Cap rate
0.6%
Rent to Value Ratio