Lebanon, IN Investment Properties for Sale
Browse homes for sale and investment properties in Lebanon, IN. Refine your search by price, property type, or more.
Best cash flowing properties in Lebanon, IN
Active
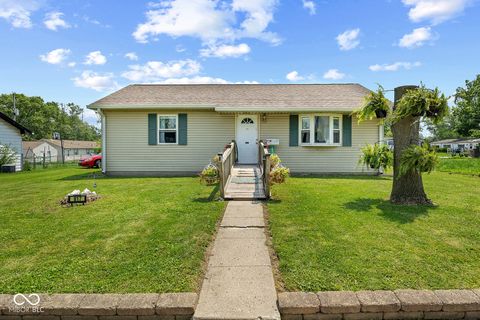
$185,000
2
bds
|
1
ba
|
975
sqft
|
built
1977
817 Hamilton St, Lebanon, IN 46052
$225
Cash flow
6.3%
Cash-on-Cash Return
7.6%
Cap rate
0.9%
Rent to Value Ratio
Active
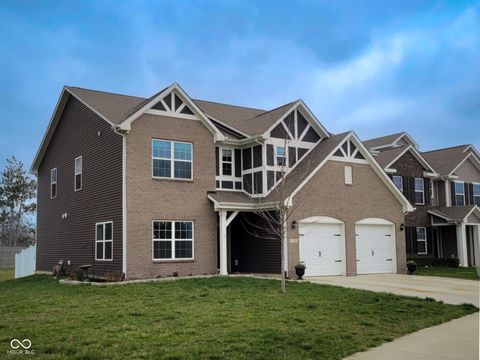
$373,000
5
bds
|
3
ba
|
3,030
sqft
|
built
2019
1336 Danielle Rd, Lebanon, IN 46052
$-8
Cash flow
-0.1%
Cash-on-Cash Return
6.1%
Cap rate
0.8%
Rent to Value Ratio
16 out of 37 properties for sale in Lebanon, IN
Limited Results Shown
Create a free account, or log in to reveal all property listings and enjoy the complete experience.
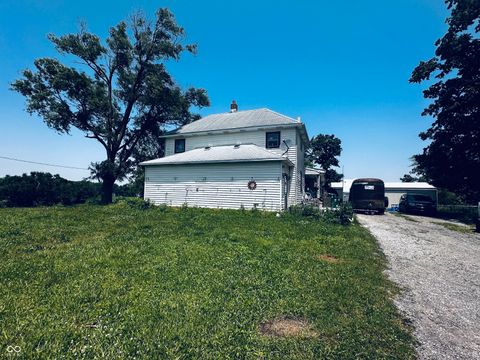
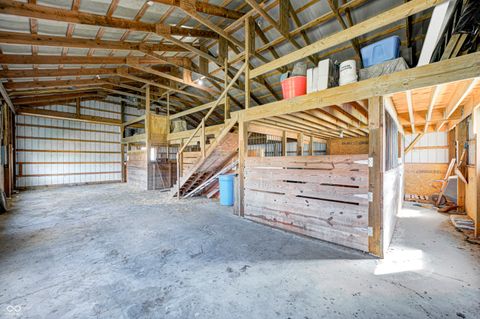
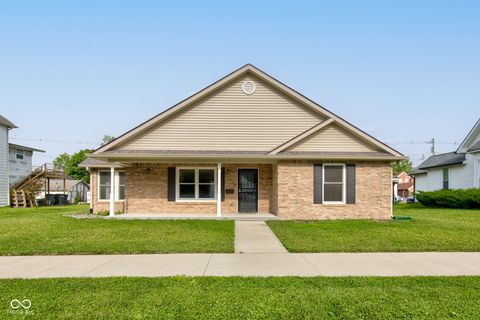
Active
$330,000
4
bds
|
1
ba
|
2,471
sqft
|
built
1907
1170 E 400 S, Lebanon, IN 46052
$-310
Cash flow
-4.9%
Cash-on-Cash Return
5.0%
Cap rate
0.6%
Rent to Value Ratio
Active
$1,100,000
4
bds
|
6
ba
|
5,668
sqft
|
built
1999
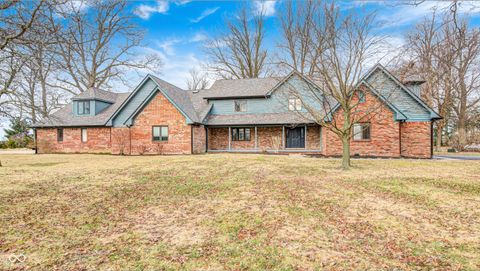
2009 W 250 N, Lebanon, IN 46052
$-2,875
Cash flow
-13.6%
Cash-on-Cash Return
3.0%
Cap rate
0.4%
Rent to Value Ratio
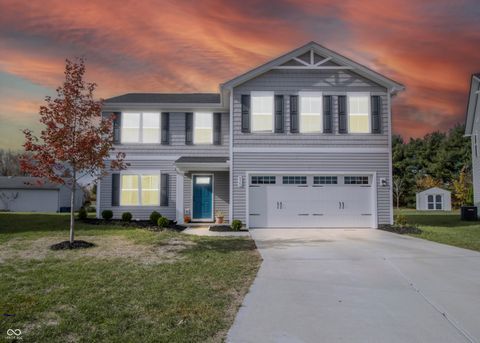
Active
$315,000
3
bds
|
2
ba
|
1,700
sqft
|
built
2016
524 S Meridian St, Lebanon, IN 46052
$-234
Cash flow
-3.9%
Cash-on-Cash Return
5.3%
Cap rate
0.6%
Rent to Value Ratio
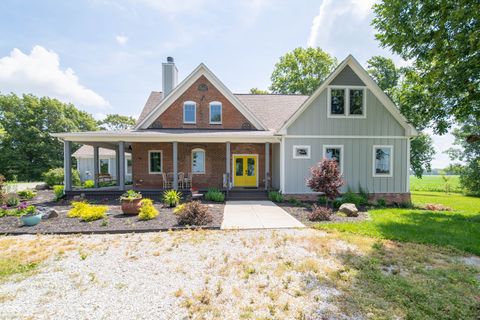
Active
$345,900
4
bds
|
3
ba
|
2,200
sqft
|
built
2022
975 Red Hills Ct, Lebanon, IN 46052
$-283
Cash flow
-4.3%
Cash-on-Cash Return
5.2%
Cap rate
0.6%
Rent to Value Ratio
Active
$1,001,000
5
bds
|
5
ba
|
4,224
sqft
|
built
1860
695 N 650 W, Lebanon, IN 46052
$-3,541
Cash flow
-18.5%
Cash-on-Cash Return
1.9%
Cap rate
0.2%
Rent to Value Ratio
Active
$399,900
3
bds
|
2
ba
|
1,902
sqft
|
built
2022
7210 Covington St, Lebanon, IN 46052
$-564
Cash flow
-7.4%
Cash-on-Cash Return
4.5%
Cap rate
0.6%
Rent to Value Ratio
Active
$1,292,500
7
bds
|
6
ba
|
6,351
sqft
|
built
1991
690 N 600 W, Lebanon, IN 46052
$-3,171
Cash flow
-12.8%
Cash-on-Cash Return
3.2%
Cap rate
0.4%
Rent to Value Ratio
Active
$341,000
3
bds
|
2
ba
|
1,714
sqft
|
built
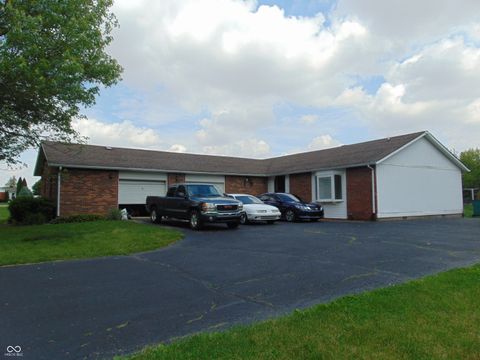
1979
2625 S 200 E, Lebanon, IN 46052
$-229
Cash flow
-3.5%
Cash-on-Cash Return
5.3%
Cap rate
0.6%
Rent to Value Ratio
Active
$649,900
3
bds
|
2
ba
|
4,066
sqft
|
built
2017
1502 W 525 N, Lebanon, IN 46052
$-1,328
Cash flow
-10.7%
Cash-on-Cash Return
3.7%
Cap rate
0.4%
Rent to Value Ratio
Active
$349,900
3
bds
|
3
ba
|
1,864
sqft
|
built
2022
610 Atlas Dr, Lebanon, IN 46052
$-250
Cash flow
-3.7%
Cash-on-Cash Return
5.3%
Cap rate
0.7%
Rent to Value Ratio

Active
$238,500
3
bds
|
1
ba
|
912
sqft
|
built
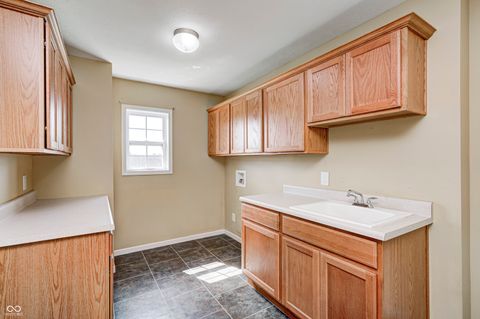
1957
1021 Harney Dr, Lebanon, IN 46052
$-325
Cash flow
-7.1%
Cash-on-Cash Return
4.5%
Cap rate
0.5%
Rent to Value Ratio
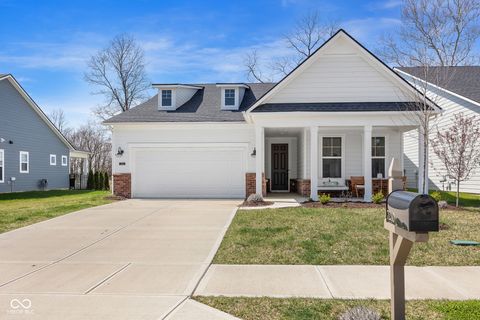
Active
$312,900
3
bds
|
3
ba
|
1,520
sqft
|
built
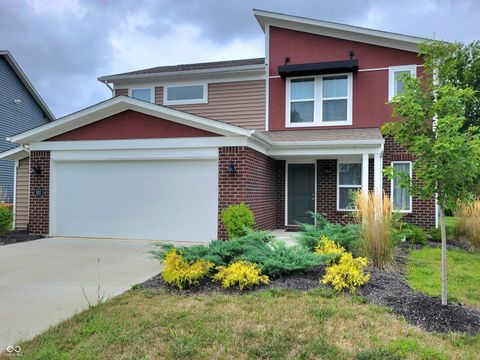
2022
853 Woodbridge Way, Lebanon, IN 46052
$-123
Cash flow
-2.1%
Cash-on-Cash Return
5.7%
Cap rate
0.7%
Rent to Value Ratio
Active
$529,000
3
bds
|
2
ba
|
2,273
sqft
|
built
1979
1624 Riley Rd, Lebanon, IN 46052
$-1,123
Cash flow
-11.1%
Cash-on-Cash Return
3.6%
Cap rate
0.4%
Rent to Value Ratio
Active
$417,000
4
bds
|
3
ba
|
2,609
sqft
|
built
2017
750 Trillium St, Lebanon, IN 46052
$-429
Cash flow
-5.4%
Cash-on-Cash Return
4.9%
Cap rate
0.6%
Rent to Value Ratio