Longmont, CO Investment Properties for Sale
Browse homes for sale and investment properties in Longmont, CO. Refine your search by price, property type, or more.
Best cash flowing properties in Longmont, CO
Active
$365,000
2
bds
|
1
ba
|
1,016
sqft
|
built
2002
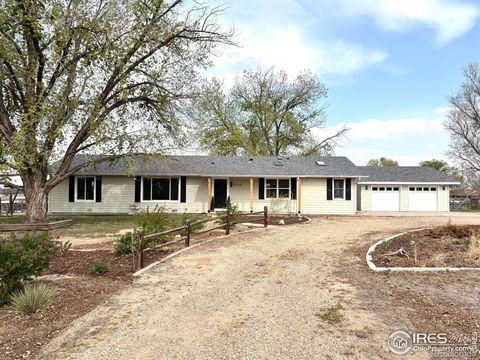
10699 Butte Dr, Longmont, CO 80504
$-884
Cash flow
-12.6%
Cash-on-Cash Return
3.4%
Cap rate
0.5%
Rent to Value Ratio

Active
$439,000
2
bds
|
2
ba
|
1,030
sqft
|
built
1910
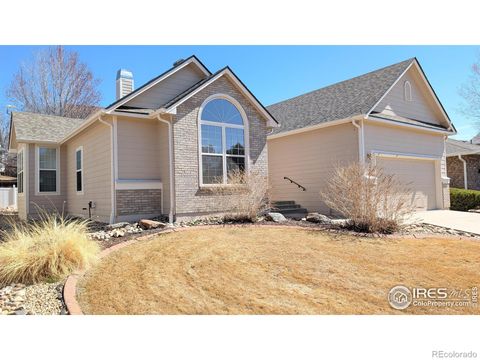
303 E 17th Ave, Longmont, CO 80504
$-951
Cash flow
-11.3%
Cash-on-Cash Return
3.7%
Cap rate
0.5%
Rent to Value Ratio
276 out of 342 properties for sale in Longmont, CO
Limited Results Shown
Create a free account, or log in to reveal all property listings and enjoy the complete experience.

Active
$898,500
6
bds
|
4
ba
|
3,775
sqft
|
built
2004
5603 Pierson Mountain Ave, Longmont, CO 80503
$-2,505
Cash flow
-14.5%
Cash-on-Cash Return
2.9%
Cap rate
0.4%
Rent to Value Ratio

Active
$940,000
8
bds
|
4
ba
|
3,689
sqft
|
built
1978
322 21st Ave, Longmont, CO 80501
$-4,172
Cash flow
-23.2%
Cash-on-Cash Return
0.9%
Cap rate
0.2%
Rent to Value Ratio
Active
$640,000
5
bds
|
3
ba
|
2,210
sqft
|
built
2016
1826 Sunshine Ave, Longmont, CO 80504
$-1,713
Cash flow
-14.0%
Cash-on-Cash Return
3.1%
Cap rate
0.5%
Rent to Value Ratio
Active
$439,000
2
bds
|
2
ba
|
1,030
sqft
|
built
1910
303 E 17th Ave, Longmont, CO 80504
$-951
Cash flow
-11.3%
Cash-on-Cash Return
3.7%
Cap rate
0.5%
Rent to Value Ratio
Active
$1,630,000
5
bds
|
4
ba
|
4,566
sqft
|
built
1987
4046 Niblick Dr, Longmont, CO 80503
$-5,474
Cash flow
-17.5%
Cash-on-Cash Return
2.2%
Cap rate
0.3%
Rent to Value Ratio
Active
$365,000
2
bds
|
1
ba
|
1,016
sqft
|
built
2002
10699 Butte Dr, Longmont, CO 80504
$-884
Cash flow
-12.6%
Cash-on-Cash Return
3.4%
Cap rate
0.5%
Rent to Value Ratio

Active
$625,000
4
bds
|
3
ba
|
2,616
sqft
|
built
1976
1313 Garden Cir, Longmont, CO 80501
$-1,727
Cash flow
-14.4%
Cash-on-Cash Return
2.9%
Cap rate
0.4%
Rent to Value Ratio

Active
$580,000
4
bds
|
4
ba
|
2,975
sqft
|
built
1994
524 Rider Ridge Dr, Longmont, CO 80504
$-1,219
Cash flow
-11.0%
Cash-on-Cash Return
3.7%
Cap rate
0.5%
Rent to Value Ratio

Active
$674,000
5
bds
|
3
ba
|
1,985
sqft
|
built
2003
4005 Frederick Cir, Longmont, CO 80503
$-1,713
Cash flow
-13.3%
Cash-on-Cash Return
3.2%
Cap rate
0.5%
Rent to Value Ratio

Active
$674,900
2
bds
|
2
ba
|
1,924
sqft
|
built
2007
1847 Whitefeather Dr, Longmont, CO 80504
$-1,706
Cash flow
-13.2%
Cash-on-Cash Return
3.2%
Cap rate
0.5%
Rent to Value Ratio

Active
$575,000
3
bds
|
3
ba
|
1,707
sqft
|
built
2003
511 Noel Ave, Longmont, CO 80501
$-1,432
Cash flow
-13.0%
Cash-on-Cash Return
3.3%
Cap rate
0.5%
Rent to Value Ratio
Active
$724,900
3
bds
|
2
ba
|
2,147
sqft
|
built
2003
10007 E County Line Rd, Longmont, CO 80501
$-1,883
Cash flow
-13.6%
Cash-on-Cash Return
3.1%
Cap rate
0.4%
Rent to Value Ratio
Active
$2,849,000
5
bds
|
6
ba
|
6,864
sqft
|
built
2015
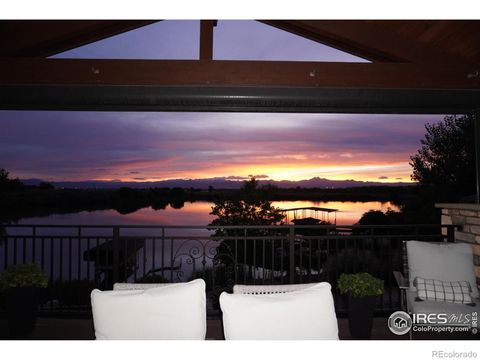
5763 Pelican Shores Dr, Longmont, CO 80504
$-11,437
Cash flow
-20.9%
Cash-on-Cash Return
1.4%
Cap rate
0.3%
Rent to Value Ratio

Active
$765,000
6
bds
|
5
ba
|
4,782
sqft
|
built
2000
1831 Ashford Cir, Longmont, CO 80504
$-2,040
Cash flow
-13.9%
Cash-on-Cash Return
3.1%
Cap rate
0.5%
Rent to Value Ratio
Active
$825,000
3
bds
|
2
ba
|
2,040
sqft
|
built
1972
9752 Sierra Vista Rd, Longmont, CO 80504
$-2,566
Cash flow
-16.2%
Cash-on-Cash Return
2.5%
Cap rate
0.4%
Rent to Value Ratio

Active
$1,030,000
4
bds
|
4
ba
|
3,371
sqft
|
built
1996
2215 Parkview Dr, Longmont, CO 80504
$-3,144
Cash flow
-15.9%
Cash-on-Cash Return
2.6%
Cap rate
0.4%
Rent to Value Ratio

Active
$405,000
2
bds
|
2
ba
|
1,201
sqft
|
built
2005
2239 Calais Dr, Longmont, CO 80504
$-1,052
Cash flow
-13.6%
Cash-on-Cash Return
3.1%
Cap rate
0.6%
Rent to Value Ratio

Active
$1,895,000
4
bds
|
4
ba
|
4,687
sqft
|
built
1998
7947 Ute Hwy, Longmont, CO 80503
$-6,773
Cash flow
-18.6%
Cash-on-Cash Return
2.0%
Cap rate
0.3%
Rent to Value Ratio

Active
$799,000
3
bds
|
4
ba
|
1,956
sqft
|
built
2019
522 Martin St, Longmont, CO 80501
$-3,527
Cash flow
-23.0%
Cash-on-Cash Return
1.0%
Cap rate
0.2%
Rent to Value Ratio
Active
$599,000
3
bds
|
2
ba
|
1,740
sqft
|
built
2000
746 Megan Ct, Longmont, CO 80504
$-1,466
Cash flow
-12.8%
Cash-on-Cash Return
3.3%
Cap rate
0.5%
Rent to Value Ratio

Active
$670,000
3
bds
|
3
ba
|
2,125
sqft
|
built
1987
1191 Twin Peaks Cir, Longmont, CO 80503
$-1,643
Cash flow
-12.8%
Cash-on-Cash Return
3.3%
Cap rate
0.5%
Rent to Value Ratio

Active
$449,900
3
bds
|
3
ba
|
2,057
sqft
|
built
1980
1222 Atwood St, Longmont, CO 80501
$-1,170
Cash flow
-13.6%
Cash-on-Cash Return
3.1%
Cap rate
0.6%
Rent to Value Ratio

Active
$1,070,000
5
bds
|
4
ba
|
3,290
sqft
|
built
1997
2066 Ridgeview Way, Longmont, CO 80504
$-3,566
Cash flow
-17.4%
Cash-on-Cash Return
2.3%
Cap rate
0.3%
Rent to Value Ratio

Active
$789,000
4
bds
|
2
ba
|
1,465
sqft
|
built
1940
1233 Carolina Ave, Longmont, CO 80501
$-2,519
Cash flow
-16.7%
Cash-on-Cash Return
2.4%
Cap rate
0.4%
Rent to Value Ratio

Active
$540,000
3
bds
|
2
ba
|
1,231
sqft
|
built
1900
1830 9th Ave, Longmont, CO 80501
$-1,332
Cash flow
-12.9%
Cash-on-Cash Return
3.3%
Cap rate
0.5%
Rent to Value Ratio

Active
$366,000
2
bds
|
2
ba
|
1,112
sqft
|
built
1995
2213 Emery St, Longmont, CO 80501
$-1,033
Cash flow
-14.7%
Cash-on-Cash Return
2.9%
Cap rate
0.5%
Rent to Value Ratio
Active
$745,000
6
bds
|
4
ba
|
3,814
sqft
|
built
1999
664 Clarendon Dr, Longmont, CO 80504
$-1,908
Cash flow
-13.4%
Cash-on-Cash Return
3.2%
Cap rate
0.5%
Rent to Value Ratio

Active
$559,000
4
bds
|
3
ba
|
2,183
sqft
|
built
1968
112 Dawson Pl, Longmont, CO 80504
$-1,413
Cash flow
-13.2%
Cash-on-Cash Return
3.2%
Cap rate
0.4%
Rent to Value Ratio

Active
$661,000
3
bds
|
3
ba
|
2,057
sqft
|
built
2015
2258 Whistler Dr, Longmont, CO 80504
$-1,845
Cash flow
-14.6%
Cash-on-Cash Return
2.9%
Cap rate
0.4%
Rent to Value Ratio
Active
$3,900,000
3
bds
|
4
ba
|
5,253
sqft
|
built
1979
6231 Prospect Rd, Longmont, CO 80503
$-16,651
Cash flow
-22.3%
Cash-on-Cash Return
1.1%
Cap rate
0.2%
Rent to Value Ratio

Active
$2,350,000
4
bds
|
3
ba
|
2,706
sqft
|
built
1983
10481 Oxford Rd, Longmont, CO 80504
$-8,693
Cash flow
-19.3%
Cash-on-Cash Return
1.8%
Cap rate
0.3%
Rent to Value Ratio

Active
$485,000
4
bds
|
3
ba
|
1,757
sqft
|
built
1985
1817 Juniper St, Longmont, CO 80501
$-1,229
Cash flow
-13.2%
Cash-on-Cash Return
3.2%
Cap rate
0.5%
Rent to Value Ratio

Active
$950,000
3
bds
|
3
ba
|
2,661
sqft
|
built
2005
1513 Cannon Mountain Dr, Longmont, CO 80503
$-3,017
Cash flow
-16.6%
Cash-on-Cash Return
2.5%
Cap rate
0.4%
Rent to Value Ratio

Active
$819,500
4
bds
|
5
ba
|
3,210
sqft
|
built
1999
2193 Sand Dollar Cir, Longmont, CO 80503
$-2,396
Cash flow
-15.3%
Cash-on-Cash Return
2.8%
Cap rate
0.4%
Rent to Value Ratio

Active
$1,125,000
5
bds
|
4
ba
|
3,430
sqft
|
built
1987
4057 Niblick Dr, Longmont, CO 80503
$-3,544
Cash flow
-16.4%
Cash-on-Cash Return
2.5%
Cap rate
0.4%
Rent to Value Ratio

Active
$736,000
4
bds
|
5
ba
|
3,857
sqft
|
built
2004
633 Deerwood Dr, Longmont, CO 80504
$-2,079
Cash flow
-14.7%
Cash-on-Cash Return
2.9%
Cap rate
0.4%
Rent to Value Ratio

Active
$720,000
4
bds
|
3
ba
|
2,670
sqft
|
built
2001
1574 Goshawk Dr, Longmont, CO 80504
$-1,955
Cash flow
-14.2%
Cash-on-Cash Return
3.0%
Cap rate
0.4%
Rent to Value Ratio

Active
$740,000
3
bds
|
3
ba
|
2,610
sqft
|
built
2001
650 Olympia Ave, Longmont, CO 80504
$-2,087
Cash flow
-14.7%
Cash-on-Cash Return
2.9%
Cap rate
0.4%
Rent to Value Ratio

Active
$538,000
2
bds
|
2
ba
|
1,292
sqft
|
built
2005
2018 Ionosphere St, Longmont, CO 80504
$-1,808
Cash flow
-17.5%
Cash-on-Cash Return
2.2%
Cap rate
0.5%
Rent to Value Ratio
Active
$580,000
3
bds
|
3
ba
|
3,066
sqft
|
built
1993
1528 16th Pl, Longmont, CO 80501
$-1,613
Cash flow
-14.5%
Cash-on-Cash Return
2.9%
Cap rate
0.5%
Rent to Value Ratio