Plymouth County Investment Properties for Sale
Browse homes for sale and investment properties in Plymouth County. Refine your search by price, property type, or more.
Best cash flowing properties in Plymouth County
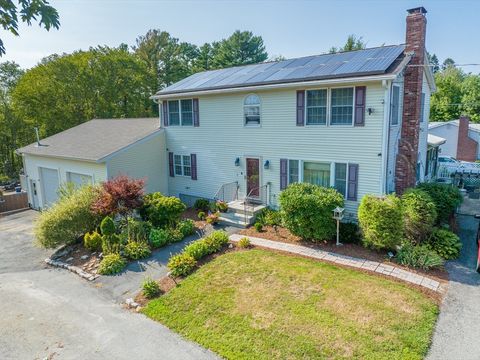
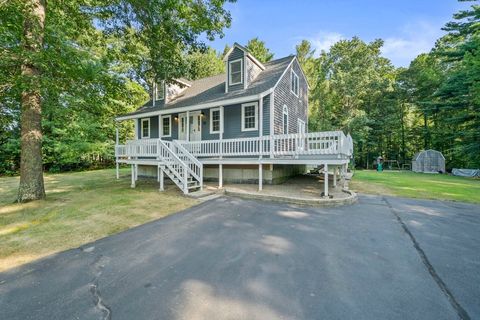
Active
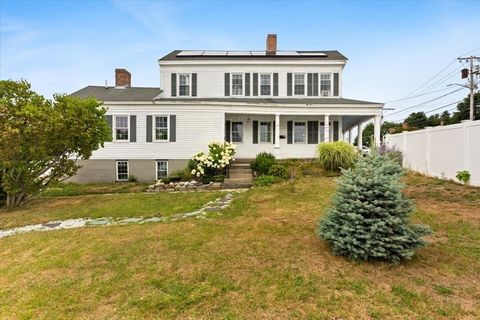
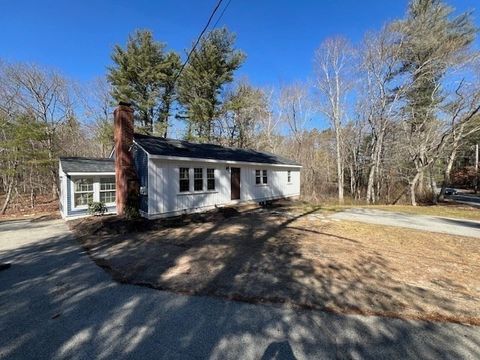
$560,000
4
bds
|
3
ba
|
2,354
sqft
|
built
1835
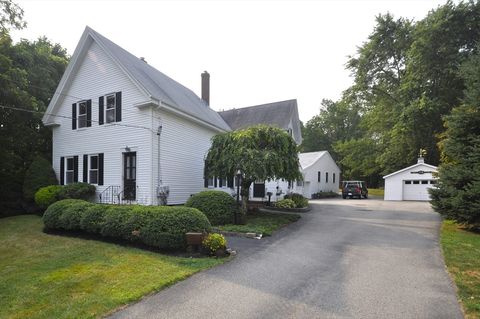
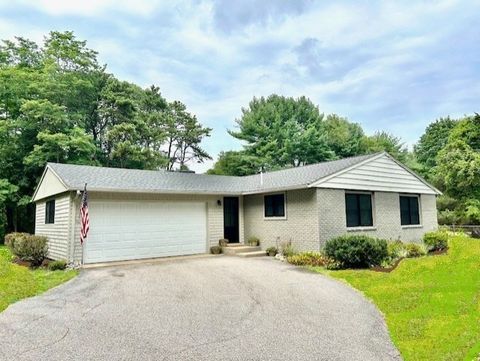
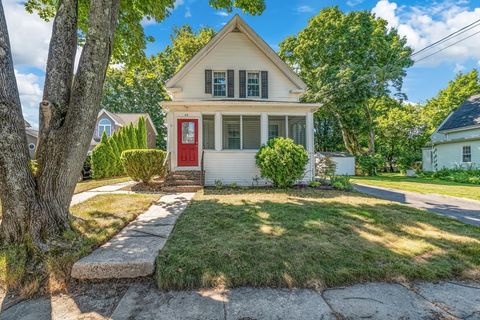
41 Bedford St, East Bridgewater, MA 02333
$-174
Cash flow
-1.6%
Cash-on-Cash Return
5.3%
Cap rate
0.8%
Rent to Value Ratio
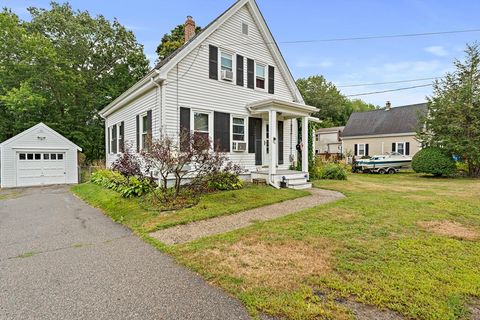
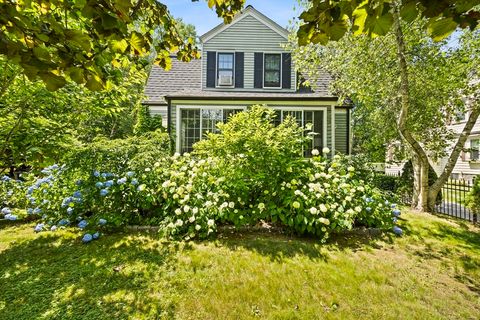
Active
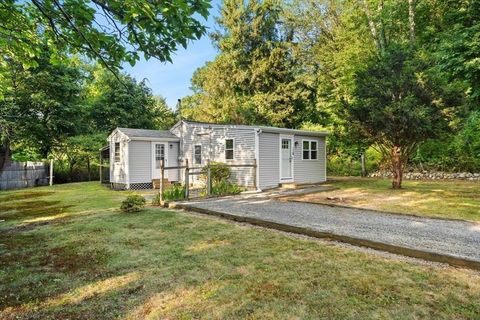
$349,900
2
bds
|
1
ba
|
664
sqft
|
built
1935
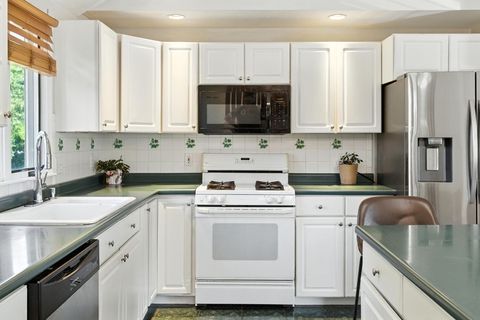
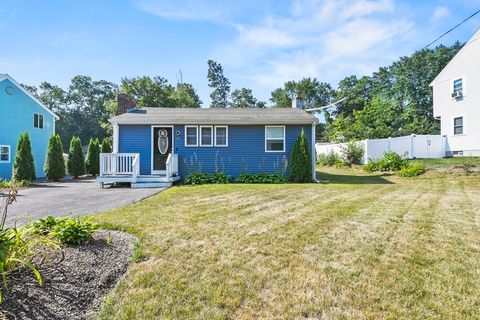
29 Glendale Ave, Brockton, MA 02301
$-257
Cash flow
-3.8%
Cash-on-Cash Return
4.8%
Cap rate
0.7%
Rent to Value Ratio
251 out of 859 properties for sale in Plymouth County
Limited Results Shown
Create a free account, or log in to reveal all property listings and enjoy the complete experience.
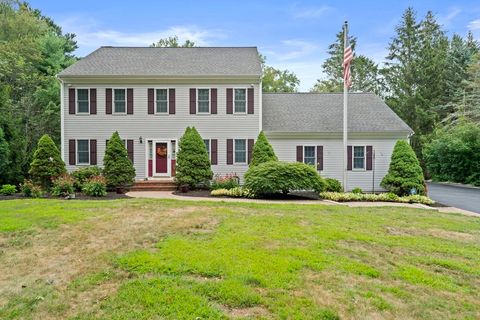
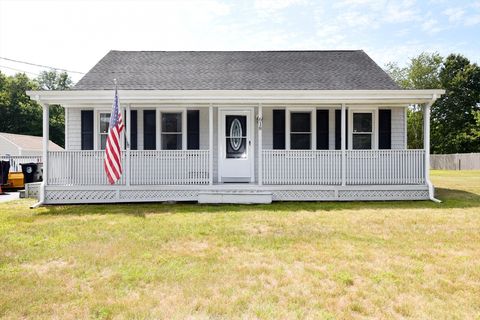
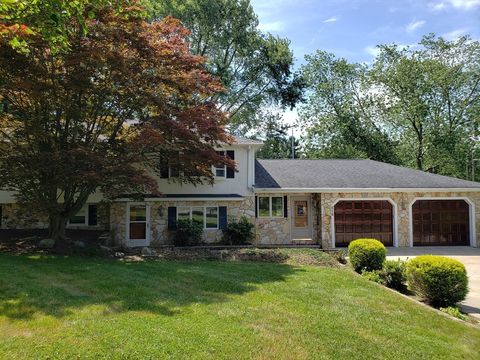
Active
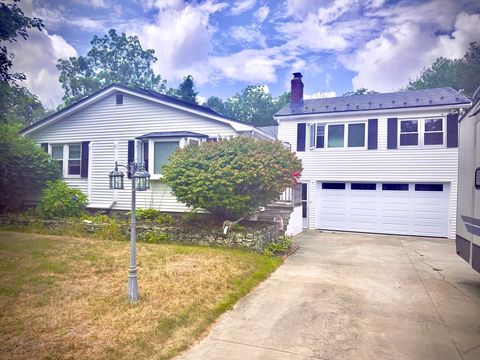
$510,000
4
bds
|
3
ba
|
2,075
sqft
|
built
1956
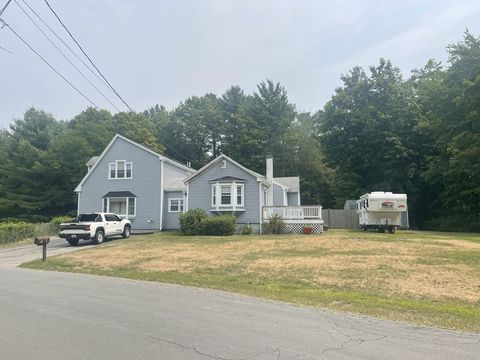
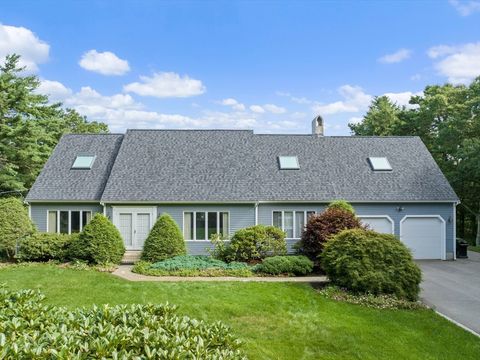
223 Laurel St, East Bridgewater, MA 02333
$-436
Cash flow
-4.5%
Cash-on-Cash Return
4.7%
Cap rate
0.7%
Rent to Value Ratio
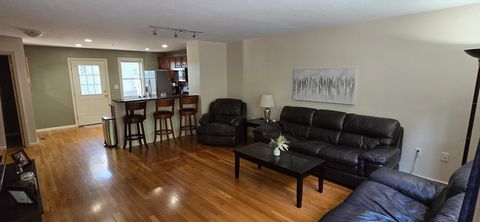
Active
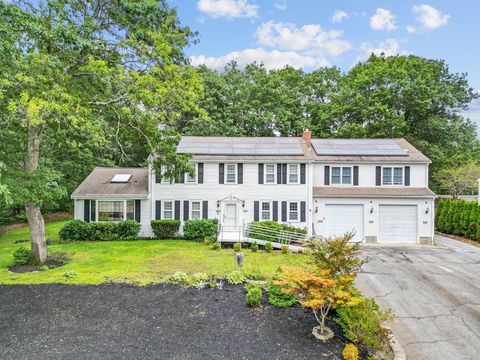
$699,000
4
bds
|
2
ba
|
2,956
sqft
|
built
1978
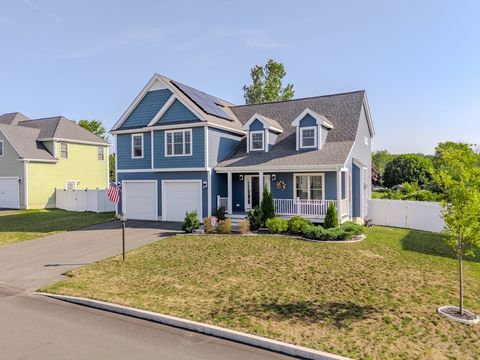
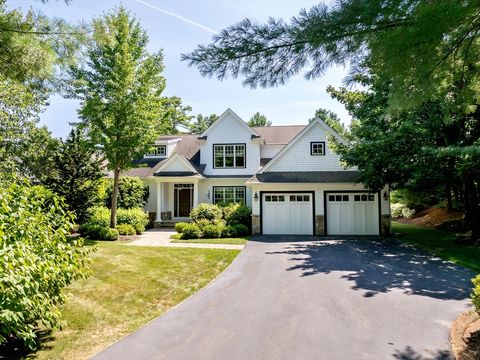
5 Hood Dr, Plymouth, MA 02360
$-1,273
Cash flow
-9.5%
Cash-on-Cash Return
3.5%
Cap rate
0.6%
Rent to Value Ratio
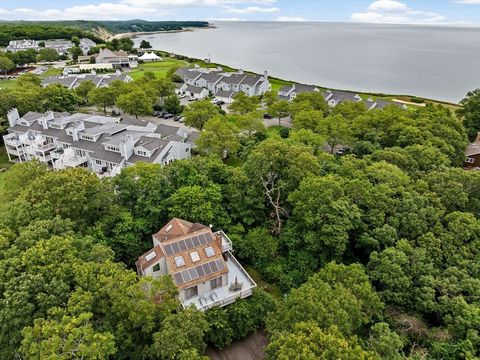
Active
$1,575,000
4
bds
|
4
ba
|
3,296
sqft
|
built
2005
94 Arrowwood Dr, Scituate, MA 02066
$-4,694
Cash flow
-15.5%
Cash-on-Cash Return
2.1%
Cap rate
0.4%
Rent to Value Ratio
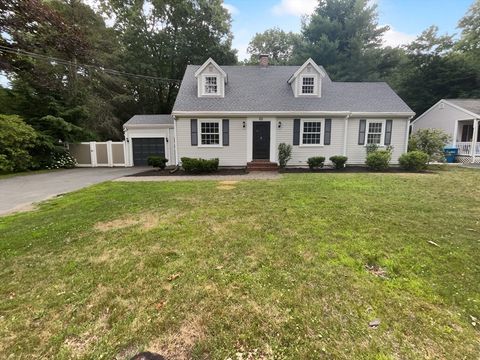
Active
$779,900
3
bds
|
3
ba
|
2,304
sqft
|
built
2003
844 Washington St, East Bridgewater, MA 02333
$-1,664
Cash flow
-11.1%
Cash-on-Cash Return
3.1%
Cap rate
0.5%
Rent to Value Ratio
Active
$479,900
3
bds
|
2
ba
|
1,338
sqft
|
built
1900
325 Commercial St, Whitman, MA 02382
$-335
Cash flow
-3.6%
Cash-on-Cash Return
4.8%
Cap rate
0.7%
Rent to Value Ratio
Active
$750,000
5
bds
|
2
ba
|
2,400
sqft
|
built
1989
84 Washington St, Whitman, MA 02382
$-1,492
Cash flow
-10.4%
Cash-on-Cash Return
3.3%
Cap rate
0.5%
Rent to Value Ratio
Active
$600,000
4
bds
|
3
ba
|
3,491
sqft
|
built
1954
1126 Plymouth St, East Bridgewater, MA 02333
$-719
Cash flow
-6.3%
Cash-on-Cash Return
4.2%
Cap rate
0.7%
Rent to Value Ratio
Active
$999,900
5
bds
|
4
ba
|
3,070
sqft
|
built
1739
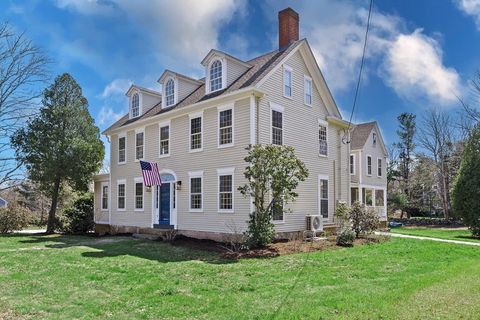
277 School St, Whitman, MA 02382
$-3,250
Cash flow
-17.0%
Cash-on-Cash Return
1.8%
Cap rate
0.4%
Rent to Value Ratio
Active
$1,450,000
3
bds
|
2
ba
|
2,126
sqft
|
built
1850
166 Hull St, Hingham, MA 02043
$-3,751
Cash flow
-13.5%
Cash-on-Cash Return
2.6%
Cap rate
0.4%
Rent to Value Ratio
Active
$749,900
3
bds
|
3
ba
|
1,712
sqft
|
built
1930
26 Washington Dr, Wareham, MA 02571
$-1,218
Cash flow
-8.5%
Cash-on-Cash Return
3.7%
Cap rate
0.5%
Rent to Value Ratio
Active
$899,000
4
bds
|
3
ba
|
3,540
sqft
|
built
2008
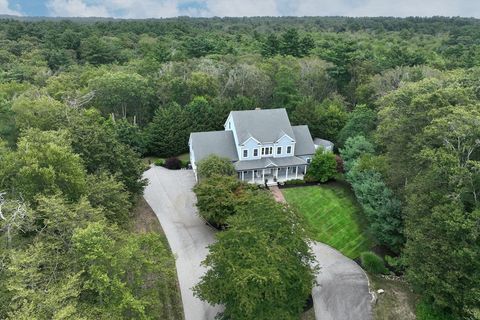
18 Highview Rd, Plymouth, MA 02360
$-1,983
Cash flow
-11.5%
Cash-on-Cash Return
3.0%
Cap rate
0.5%
Rent to Value Ratio
Active
$779,000
3
bds
|
2
ba
|
1,762
sqft
|
built
1979
28 Wareham St, Carver, MA 02330
$-1,825
Cash flow
-12.2%
Cash-on-Cash Return
2.9%
Cap rate
0.4%
Rent to Value Ratio
Active
$589,888
4
bds
|
3
ba
|
2,000
sqft
|
built
1860
32 Legion Pkwy, Whitman, MA 02382
$-602
Cash flow
-5.3%
Cash-on-Cash Return
4.5%
Cap rate
0.7%
Rent to Value Ratio
Active
$719,900
3
bds
|
3
ba
|
2,398
sqft
|
built
1975
86 Plymouth St, Carver, MA 02330
$-1,062
Cash flow
-7.7%
Cash-on-Cash Return
3.9%
Cap rate
0.6%
Rent to Value Ratio
Active
$599,900
3
bds
|
2
ba
|
1,428
sqft
|
built
1991
76 Pine St, East Bridgewater, MA 02333
$-953
Cash flow
-8.3%
Cash-on-Cash Return
3.8%
Cap rate
0.6%
Rent to Value Ratio
Active
$689,900
4
bds
|
3
ba
|
2,615
sqft
|
built
1920
293 School St, Whitman, MA 02382
$-983
Cash flow
-7.4%
Cash-on-Cash Return
4.0%
Cap rate
0.6%
Rent to Value Ratio
Active
$525,000
3
bds
|
1
ba
|
1,251
sqft
|
built
1997
618 Auburn St, Whitman, MA 02382
$-829
Cash flow
-8.2%
Cash-on-Cash Return
3.8%
Cap rate
0.6%
Rent to Value Ratio
Active
$429,000
2
bds
|
2
ba
|
1,116
sqft
|
built
2004
604 Bedford St, Whitman, MA 02382
$-781
Cash flow
-9.5%
Cash-on-Cash Return
3.5%
Cap rate
0.7%
Rent to Value Ratio
Active
$549,900
1
bds
|
1
ba
|
720
sqft
|
built
1930
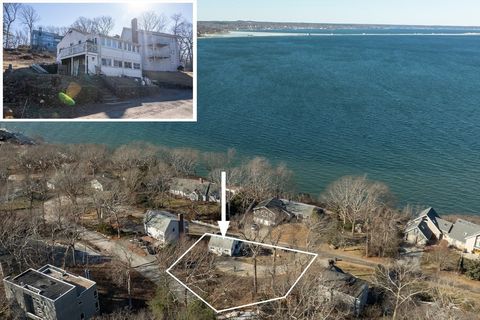
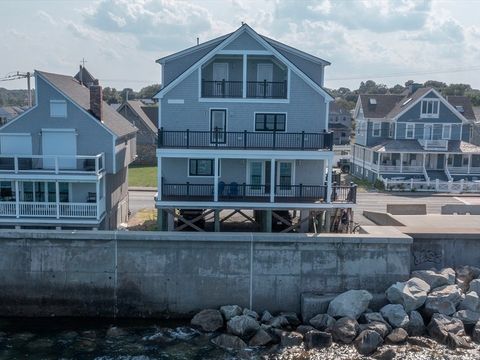
41 Bay Shore Dr, Plymouth, MA 02360
$-1,263
Cash flow
-12.0%
Cash-on-Cash Return
2.9%
Cap rate
0.5%
Rent to Value Ratio
Active
$849,900
4
bds
|
3
ba
|
2,642
sqft
|
built
1880
318 W Union St, East Bridgewater, MA 02333
$-2,487
Cash flow
-15.3%
Cash-on-Cash Return
2.2%
Cap rate
0.3%
Rent to Value Ratio
Active
$649,900
5
bds
|
3
ba
|
2,820
sqft
|
built
1950
71 Church St, East Bridgewater, MA 02333
$-602
Cash flow
-4.8%
Cash-on-Cash Return
4.6%
Cap rate
0.7%
Rent to Value Ratio
Active
$1,200,000
4
bds
|
3
ba
|
0
sqft
|
built
1810
18 Pine Island Rd, Mattapoisett, MA 02739
$-4,732
Cash flow
-20.6%
Cash-on-Cash Return
0.9%
Cap rate
0.2%
Rent to Value Ratio
Active
$799,000
3
bds
|
2
ba
|
2,360
sqft
|
built
1966
26 Winter St, Duxbury, MA 02332
$-1,829
Cash flow
-11.9%
Cash-on-Cash Return
2.9%
Cap rate
0.4%
Rent to Value Ratio
Active
$650,000
5
bds
|
2
ba
|
2,445
sqft
|
built
1996
782 Bedford St, Whitman, MA 02382
$-578
Cash flow
-4.6%
Cash-on-Cash Return
4.6%
Cap rate
0.7%
Rent to Value Ratio
Active
$999,900
3
bds
|
4
ba
|
2,658
sqft
|
built
1986
91 Monks Hill Rd, Kingston, MA 02364
$-2,064
Cash flow
-10.8%
Cash-on-Cash Return
3.2%
Cap rate
0.5%
Rent to Value Ratio
Active
$849,900
3
bds
|
3
ba
|
2,342
sqft
|
built
2022
64 Pratt Ave, Bridgewater, MA 02324
$-2,031
Cash flow
-12.5%
Cash-on-Cash Return
2.8%
Cap rate
0.5%
Rent to Value Ratio
Active
$1,599,900
5
bds
|
3
ba
|
3,812
sqft
|
built
2023
328 Ocean St, Marshfield, MA 02050
$-1,823
Cash flow
-5.9%
Cash-on-Cash Return
4.3%
Cap rate
0.6%
Rent to Value Ratio
Active
$549,900
3
bds
|
1
ba
|
1,916
sqft
|
built
1925
29 Hayes Rd, East Bridgewater, MA 02333
$-474
Cash flow
-4.5%
Cash-on-Cash Return
4.6%
Cap rate
0.7%
Rent to Value Ratio

Active
$1,999,000
4
bds
|
3
ba
|
2,700
sqft
|
built
2025
430 Hatherly Rd, Scituate, MA 02066
$-6,976
Cash flow
-18.2%
Cash-on-Cash Return
1.5%
Cap rate
0.2%
Rent to Value Ratio
Active
$1,595,000
3
bds
|
3
ba
|
3,062
sqft
|
built
2007
116 Ryecroft, Plymouth, MA 02360
$-4,803
Cash flow
-15.7%
Cash-on-Cash Return
2.1%
Cap rate
0.4%
Rent to Value Ratio
Active
$599,000
4
bds
|
2
ba
|
1,759
sqft
|
built
1870
42 Rock St, Whitman, MA 02382
$-911
Cash flow
-7.9%
Cash-on-Cash Return
3.9%
Cap rate
0.6%
Rent to Value Ratio
Active
$684,900
4
bds
|
2
ba
|
1,850
sqft
|
built
1966
512 Lincoln St, Duxbury, MA 02332
$-1,437
Cash flow
-10.9%
Cash-on-Cash Return
3.2%
Cap rate
0.5%
Rent to Value Ratio

Active
$654,500
3
bds
|
2
ba
|
1,587
sqft
|
built
1912
57 Battery St, Abington, MA 02351
$-1,518
Cash flow
-12.1%
Cash-on-Cash Return
2.9%
Cap rate
0.5%
Rent to Value Ratio
Active
$679,900
3
bds
|
2
ba
|
2,624
sqft
|
built
1969
416 Highland St, East Bridgewater, MA 02333
$-719
Cash flow
-5.5%
Cash-on-Cash Return
4.4%
Cap rate
0.7%
Rent to Value Ratio
Active
$769,000
3
bds
|
3
ba
|
2,284
sqft
|
built
1992
15 Nonantum Rd, Plymouth, MA 02360
$-1,436
Cash flow
-9.7%
Cash-on-Cash Return
3.4%
Cap rate
0.5%
Rent to Value Ratio
Active
$589,000
3
bds
|
2
ba
|
1,545
sqft
|
built
1945
611 N Bedford St, East Bridgewater, MA 02333
$-1,098
Cash flow
-9.7%
Cash-on-Cash Return
3.4%
Cap rate
0.5%
Rent to Value Ratio
Active
$399,900
2
bds
|
2
ba
|
1,125
sqft
|
built
1985
1181 Nantasket Ave, Hull, MA 02045
$-922
Cash flow
-12.0%
Cash-on-Cash Return
2.9%
Cap rate
0.7%
Rent to Value Ratio
Active
$520,000
4
bds
|
2
ba
|
1,735
sqft
|
built
1900
150 Harvard St, Whitman, MA 02382
$-487
Cash flow
-4.9%
Cash-on-Cash Return
4.6%
Cap rate
0.7%
Rent to Value Ratio