Massachusetts Investment Properties for Sale
Browse homes for sale and investment properties in Massachusetts. Refine your search by price, property type, or more.
Best cash flowing properties in Massachusetts
Active
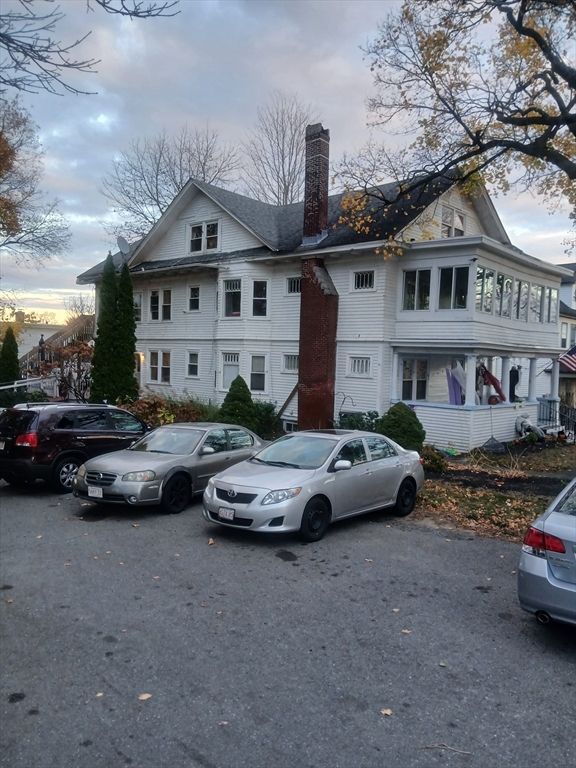
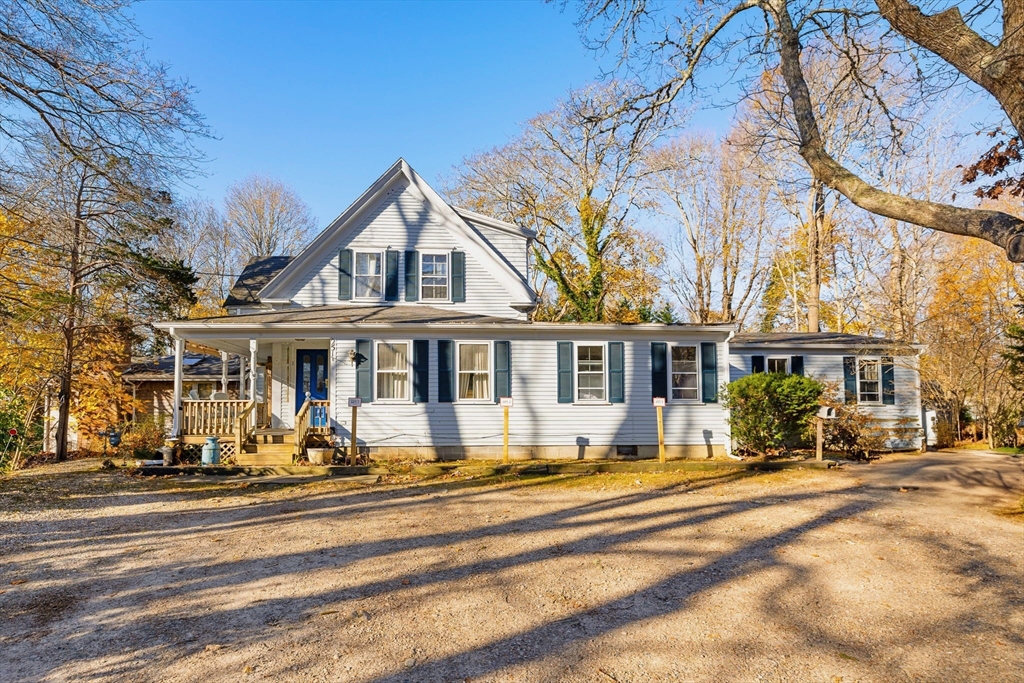
$395,000
3
bds
|
2
ba
|
1,500
sqft
|
built
1910
89 Essex St, Swampscott, MA 01907
$-82
Cash flow
-1.1%
Cash-on-Cash Return
5.4%
Cap rate
0.8%
Rent to Value Ratio
Active
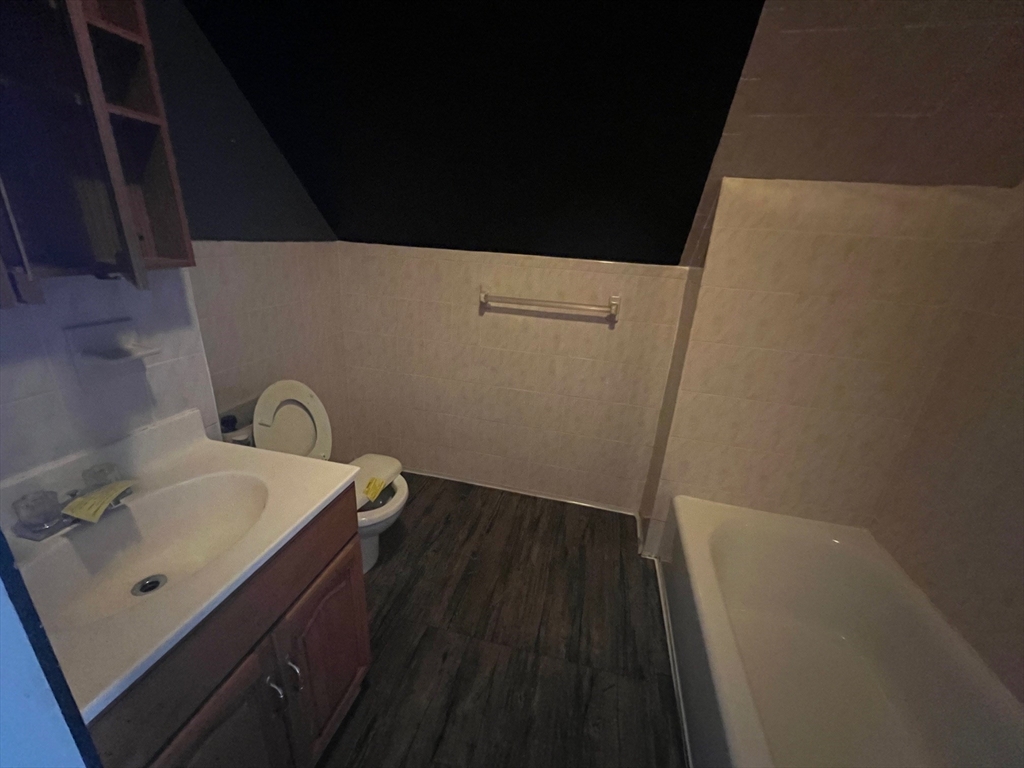
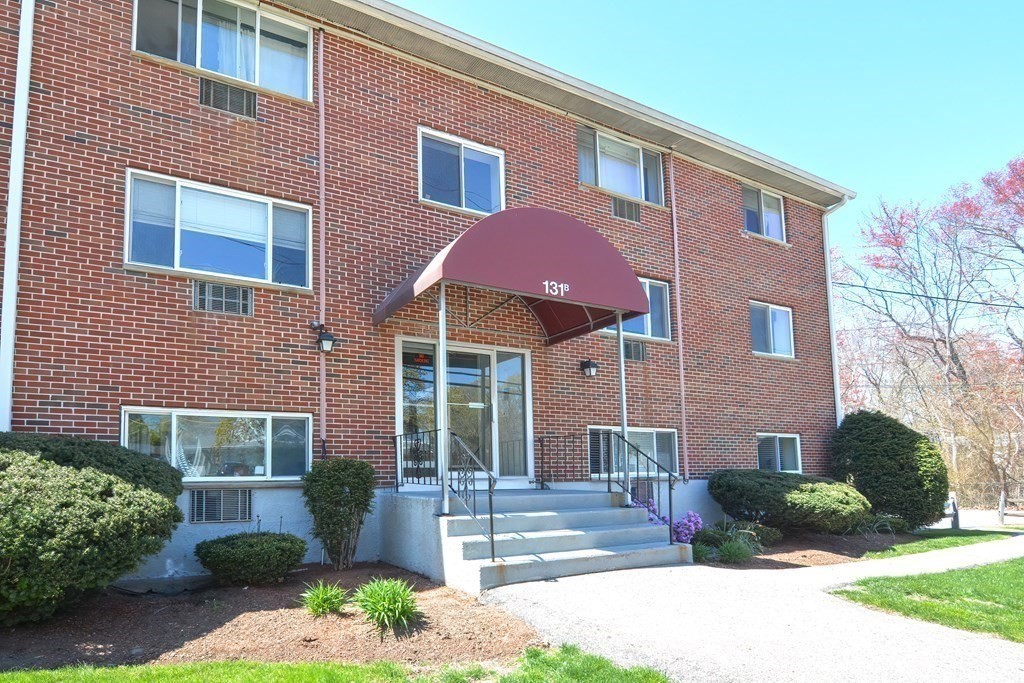
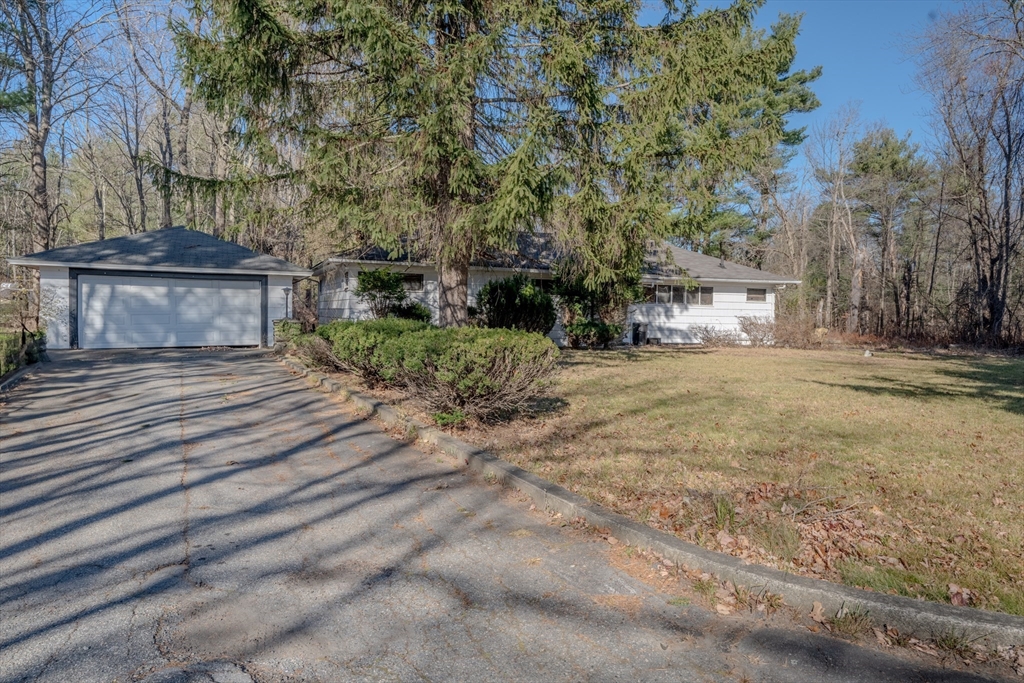
$199,900
1
bds
|
1
ba
|
330
sqft
|
built
1970
131 Mellen St, Framingham, MA 01702
$-287
Cash flow
-7.5%
Cash-on-Cash Return
4.0%
Cap rate
0.7%
Rent to Value Ratio
5,353 out of 10,515 properties for sale in Massachusetts
Limited Results Shown
Create a free account, or log in to reveal all property listings and enjoy the complete experience.
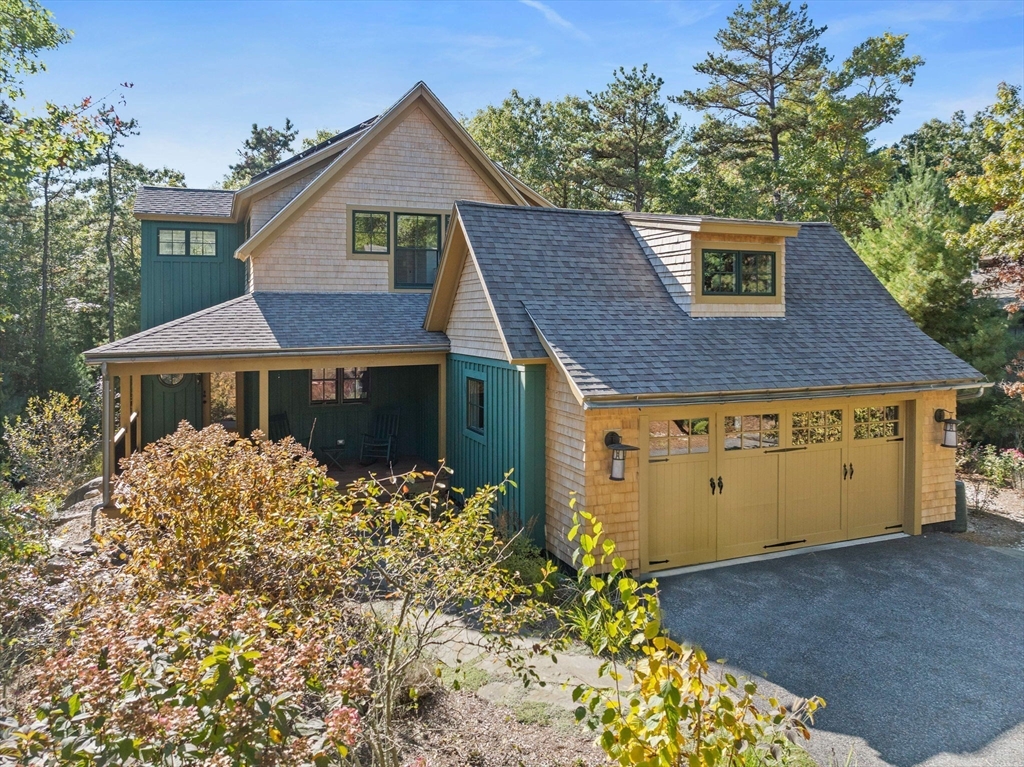
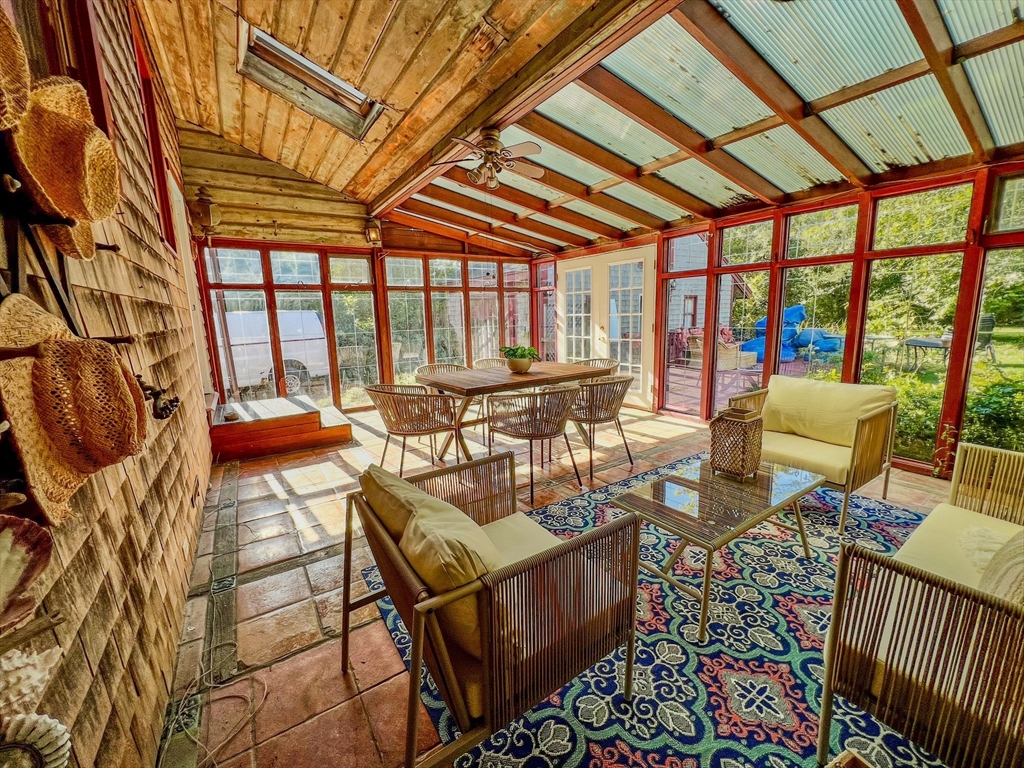
Active
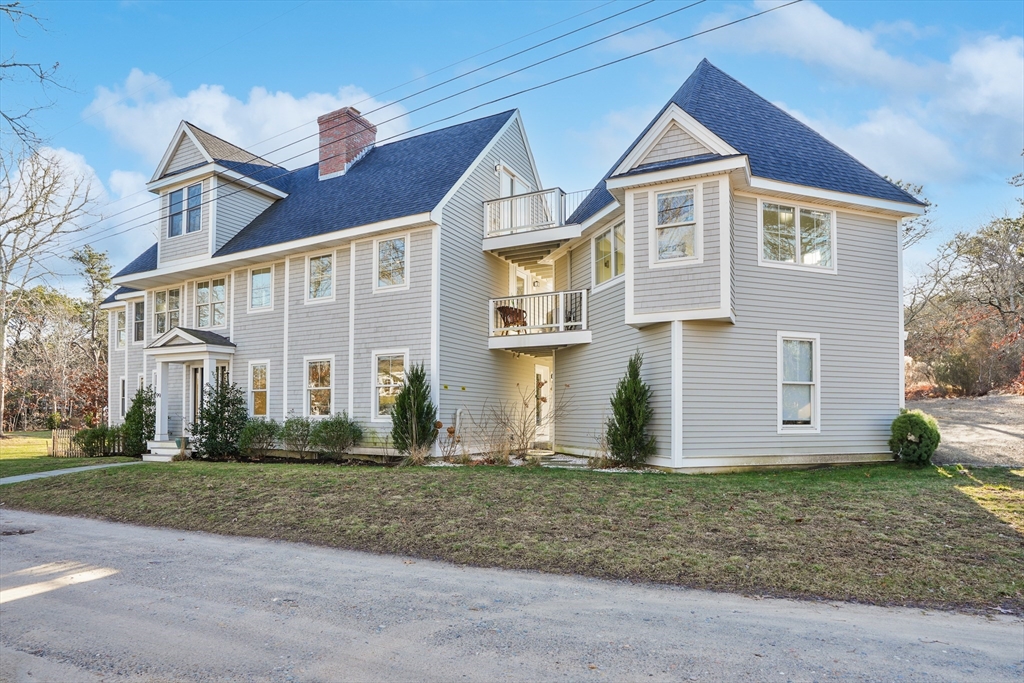
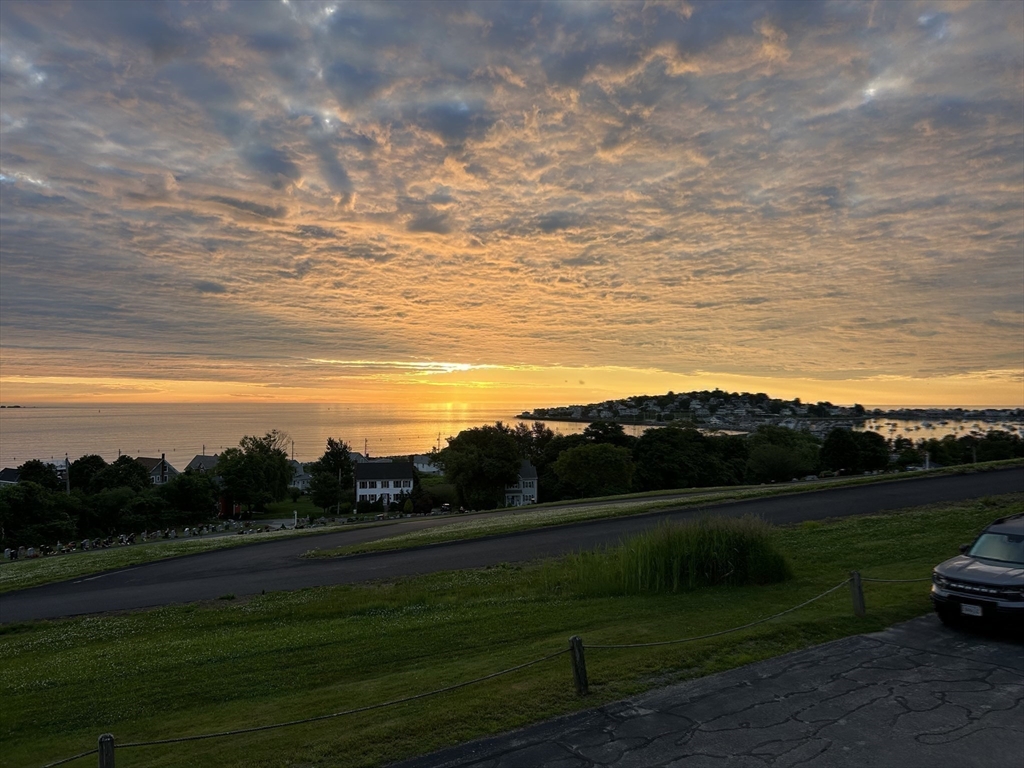
$1,200,000
3
bds
|
3
ba
|
2,764
sqft
|
built
2015
12 Hickorywood, Plymouth, MA 02360
$-2,607
Cash flow
-11.3%
Cash-on-Cash Return
3.1%
Cap rate
0.5%
Rent to Value Ratio
Active
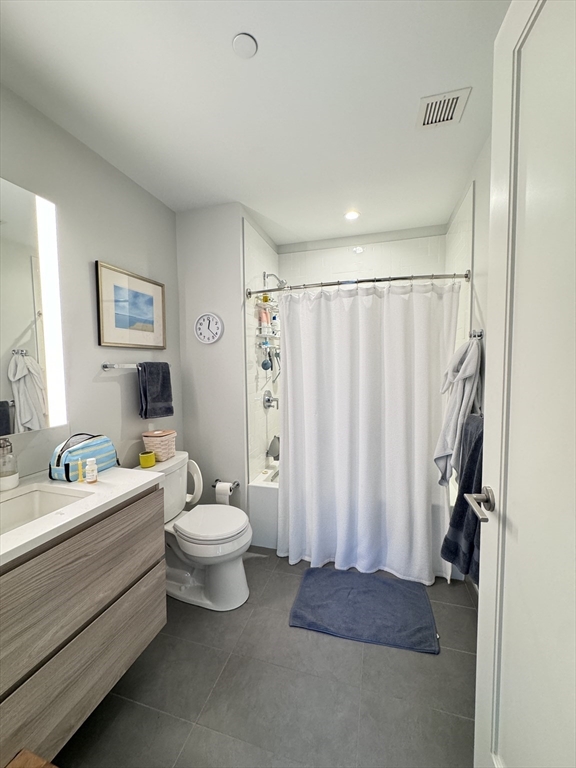
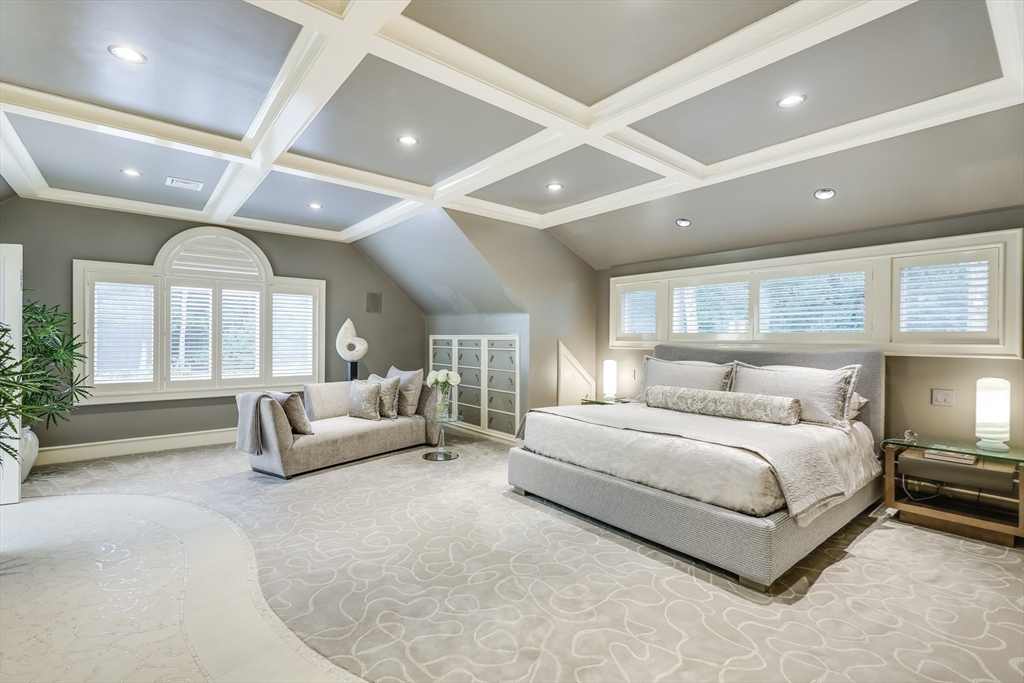
$2,495,000
4
bds
|
6
ba
|
2,518
sqft
|
built
1988
32 Norton Orchard Rd, Edgartown, MA 02539
$-6,013
Cash flow
-12.6%
Cash-on-Cash Return
2.8%
Cap rate
0.4%
Rent to Value Ratio
Active
$395,000
3
bds
|
2
ba
|
1,500
sqft
|
built
1910
89 Essex St, Swampscott, MA 01907
$-82
Cash flow
-1.1%
Cash-on-Cash Return
5.4%
Cap rate
0.8%
Rent to Value Ratio
Active
$728,675
8
bds
|
4
ba
|
4,564
sqft
|
built
1900
156 Summer St, Fitchburg, MA 01420
$-2,250
Cash flow
-16.1%
Cash-on-Cash Return
2.0%
Cap rate
0.3%
Rent to Value Ratio
Active
$2,595,000
3
bds
|
4
ba
|
3,039
sqft
|
built
1985
99 The Blvd, Edgartown, MA 02539
$-5,303
Cash flow
-10.7%
Cash-on-Cash Return
3.2%
Cap rate
0.4%
Rent to Value Ratio
Active
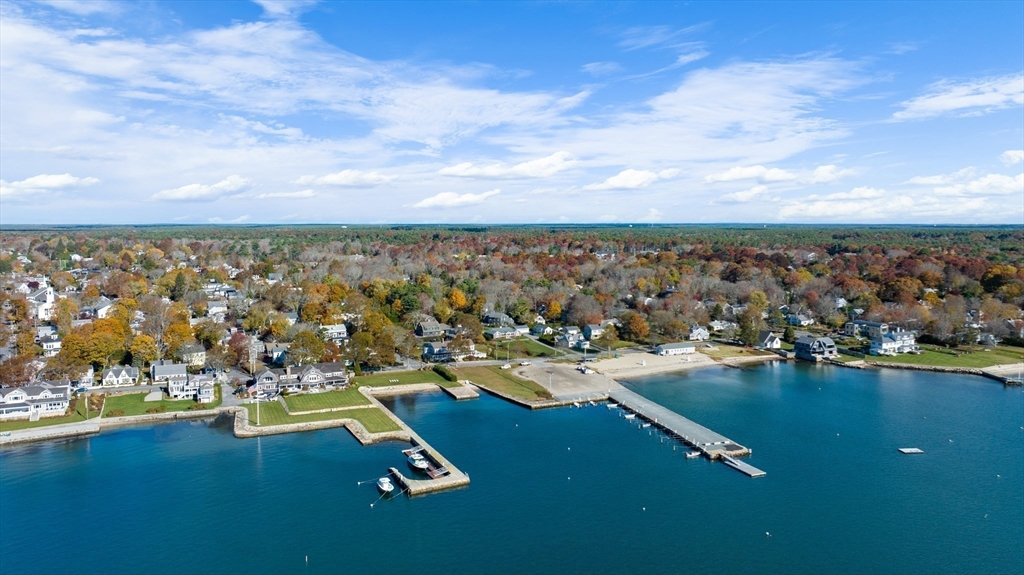
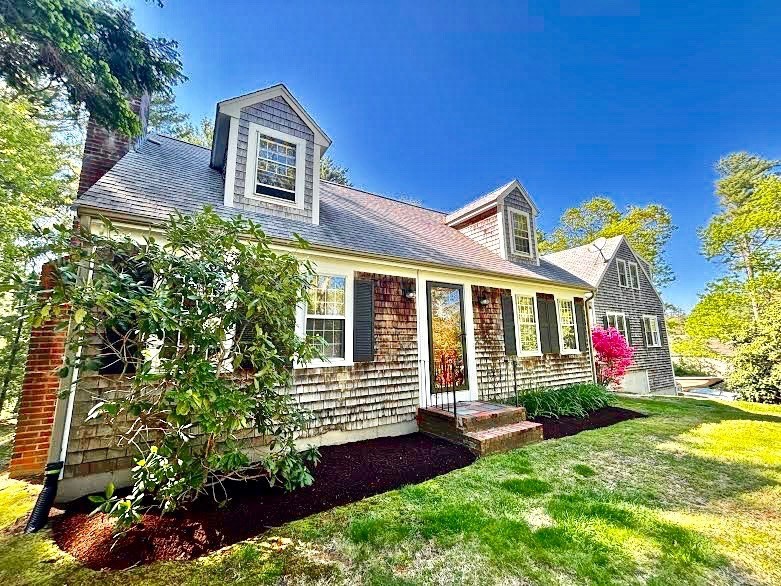
$695,000
2
bds
|
2
ba
|
1,352
sqft
|
built
1960
11 Captains Ln, Mattapoisett, MA 02739
$-1,529
Cash flow
-11.5%
Cash-on-Cash Return
3.0%
Cap rate
0.5%
Rent to Value Ratio
Active
$3,475,000
2
bds
|
3
ba
|
2,350
sqft
|
built
1987
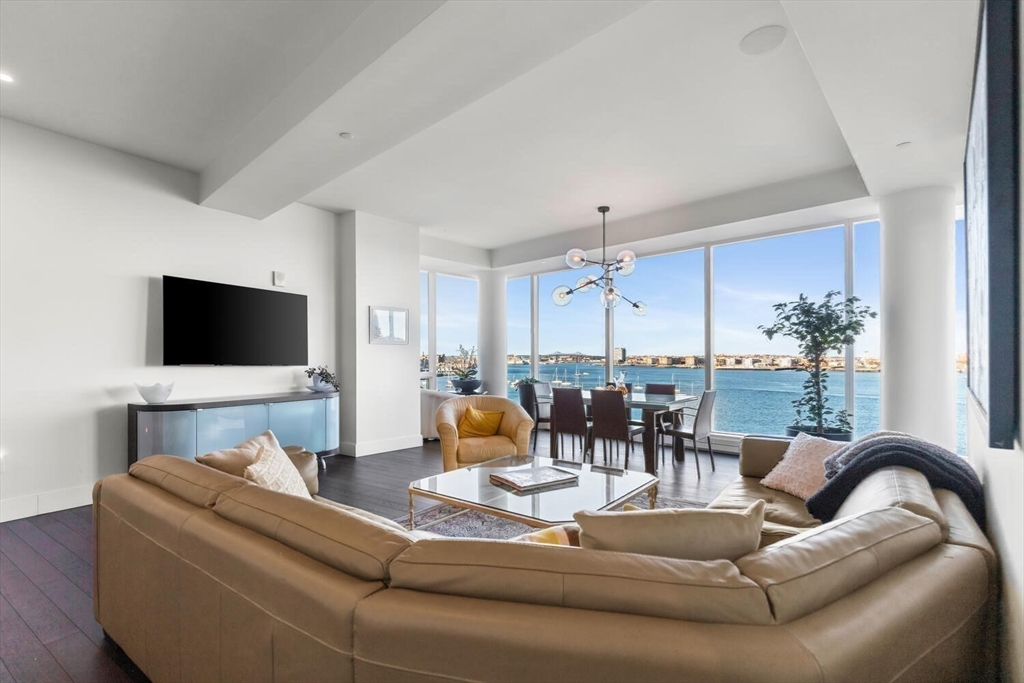
20 Rowes Wharf, Boston, MA 02110
$-17,010
Cash flow
-25.5%
Cash-on-Cash Return
-0.2%
Cap rate
0.3%
Rent to Value Ratio
Active
$1,895,000
2
bds
|
2
ba
|
1,068
sqft
|
built
2019
133 Seaport Blvd, Boston, MA 02210
$-7,541
Cash flow
-20.8%
Cash-on-Cash Return
0.9%
Cap rate
0.3%
Rent to Value Ratio
Active
$199,900
1
bds
|
1
ba
|
330
sqft
|
built
1970
131 Mellen St, Framingham, MA 01702
$-287
Cash flow
-7.5%
Cash-on-Cash Return
4.0%
Cap rate
0.7%
Rent to Value Ratio
Active
$799,900
4
bds
|
3
ba
|
2,672
sqft
|
built
1950
92 Martin St, Rehoboth, MA 02769
$-710
Cash flow
-4.6%
Cash-on-Cash Return
4.6%
Cap rate
0.6%
Rent to Value Ratio
Active
$999,999
2
bds
|
1
ba
|
1,008
sqft
|
built
1950
133 Mariners Ln, Falmouth, MA 02540
$-3,004
Cash flow
-15.7%
Cash-on-Cash Return
2.1%
Cap rate
0.3%
Rent to Value Ratio
Active
$5,895,000
6
bds
|
8
ba
|
9,494
sqft
|
built
2024
33 Royalston Rd, Wellesley, MA 02481
$-22,172
Cash flow
-19.6%
Cash-on-Cash Return
1.2%
Cap rate
0.2%
Rent to Value Ratio
Active
$4,983,000
6
bds
|
8
ba
|
10,925
sqft
|
built
2023
75 Woodfall Rd, Belmont, MA 02478
$-19,591
Cash flow
-20.5%
Cash-on-Cash Return
1.0%
Cap rate
0.2%
Rent to Value Ratio
Active
$575,000
3
bds
|
1
ba
|
1,030
sqft
|
built
1920
56 Riverview St, Dedham, MA 02026
$-819
Cash flow
-7.4%
Cash-on-Cash Return
4.0%
Cap rate
0.6%
Rent to Value Ratio
Active
$949,000
4
bds
|
3
ba
|
1,810
sqft
|
built
1955
13 Algonquin Dr, Burlington, MA 01803
$-1,863
Cash flow
-10.2%
Cash-on-Cash Return
3.3%
Cap rate
0.5%
Rent to Value Ratio
Active
$1,699,900
5
bds
|
3
ba
|
4,100
sqft
|
built
2024
328 Ocean St, Marshfield, MA 02050
$-2,005
Cash flow
-6.2%
Cash-on-Cash Return
4.3%
Cap rate
0.6%
Rent to Value Ratio
Active
$830,000
5
bds
|
3
ba
|
3,461
sqft
|
built
1988
72 Rinnock Rd, Fitchburg, MA 01420
$-1,055
Cash flow
-6.6%
Cash-on-Cash Return
4.2%
Cap rate
0.6%
Rent to Value Ratio

Active
$1,498,000
5
bds
|
4
ba
|
3,276
sqft
|
built
1900
14 Church Ave, Woburn, MA 01801
$-5,953
Cash flow
-20.7%
Cash-on-Cash Return
0.9%
Cap rate
0.2%
Rent to Value Ratio
Active
$1,500,000
5
bds
|
4
ba
|
3,327
sqft
|
built
1890
251 Woods Hole Rd, Falmouth, MA 02540
$-4,868
Cash flow
-16.9%
Cash-on-Cash Return
1.8%
Cap rate
0.3%
Rent to Value Ratio
Active
$609,999
3
bds
|
2
ba
|
1,682
sqft
|
built
1956
347 Lowell St, Andover, MA 01810
$-946
Cash flow
-8.1%
Cash-on-Cash Return
3.8%
Cap rate
0.6%
Rent to Value Ratio
Active
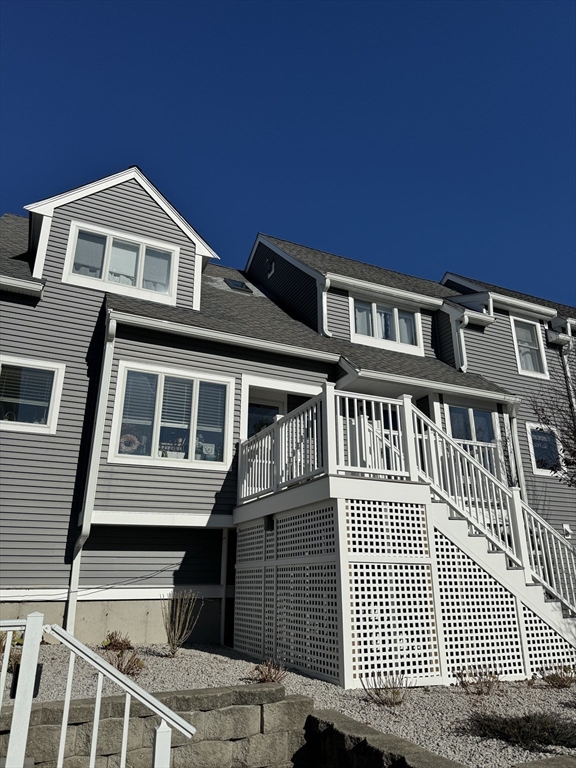
$414,900
2
bds
|
2
ba
|
1,125
sqft
|
built
1985
1181 Nantasket Ave, Hull, MA 02045
$-914
Cash flow
-11.5%
Cash-on-Cash Return
3.0%
Cap rate
0.7%
Rent to Value Ratio
Active
$3,995,000
4
bds
|
4
ba
|
5,898
sqft
|
built
1987
70 Lazell St, Hingham, MA 02043
$-14,289
Cash flow
-18.7%
Cash-on-Cash Return
1.4%
Cap rate
0.3%
Rent to Value Ratio
Active
$1,099,900
1
bds
|
1
ba
|
850
sqft
|
built
1985
871 Pleasant St, Leominster, MA 01453
$-3,455
Cash flow
-16.4%
Cash-on-Cash Return
1.9%
Cap rate
0.3%
Rent to Value Ratio
Active
$2,675,000
2
bds
|
3
ba
|
2,242
sqft
|
built
2000
1 Avery St, Boston, MA 02111
$-12,238
Cash flow
-23.9%
Cash-on-Cash Return
0.2%
Cap rate
0.4%
Rent to Value Ratio
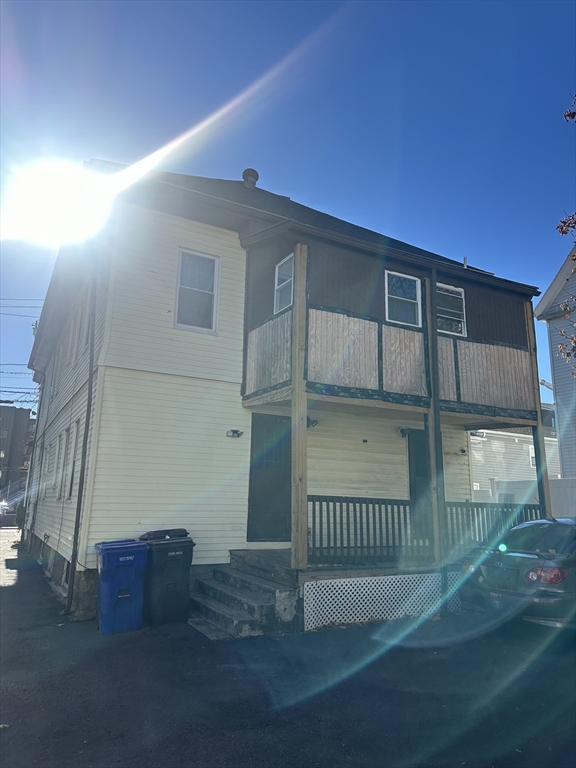
Active
$525,000
1
bds
|
1
ba
|
807
sqft
|
built
2020
11 Walley St, Boston, MA 02128
$-1,536
Cash flow
-15.3%
Cash-on-Cash Return
2.2%
Cap rate
0.5%
Rent to Value Ratio
Active
$895,000
3
bds
|
3
ba
|
1,824
sqft
|
built
1929
8 Chilton Rd, Brockton, MA 02301
$-1,476
Cash flow
-8.6%
Cash-on-Cash Return
3.7%
Cap rate
0.5%
Rent to Value Ratio
Active
$5,049,900
2
bds
|
3
ba
|
1,859
sqft
|
built
2015
22 Liberty Pl, Boston, MA 02127
$-25,319
Cash flow
-26.2%
Cash-on-Cash Return
-0.3%
Cap rate
0.2%
Rent to Value Ratio
Active
$969,900
12
bds
|
3
ba
|
2,997
sqft
|
built
1900
52 Sagamore Ave, Chelsea, MA 02150
$-3,388
Cash flow
-18.2%
Cash-on-Cash Return
1.5%
Cap rate
0.3%
Rent to Value Ratio
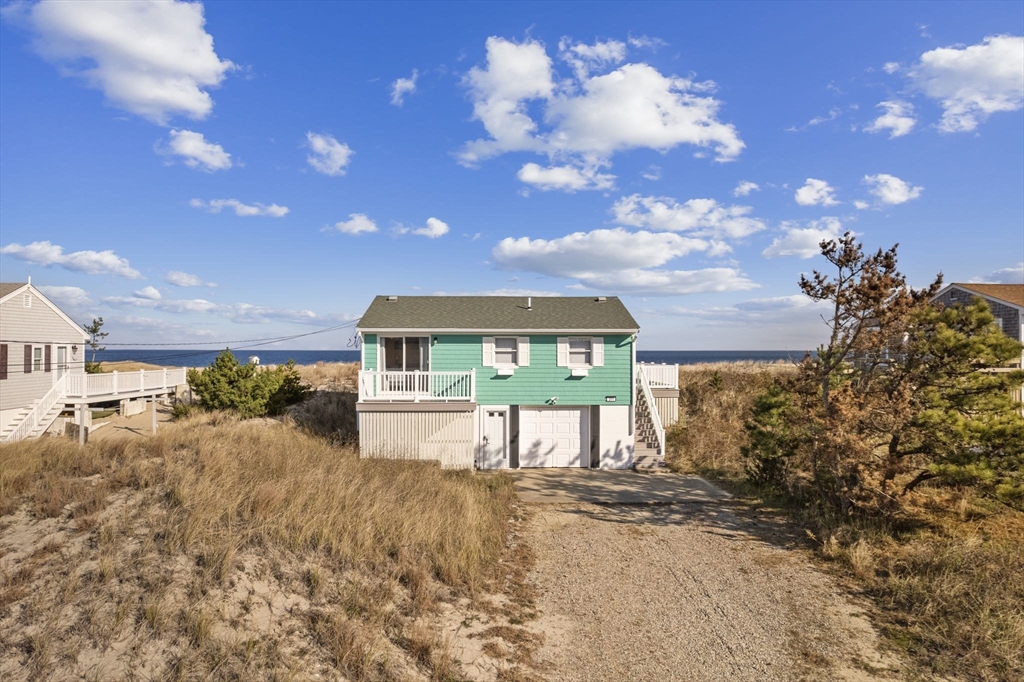
Active
$1,899,000
3
bds
|
2
ba
|
1,030
sqft
|
built
1950
311 Phillips Rd, Sandwich, MA 02563
$-6,886
Cash flow
-18.9%
Cash-on-Cash Return
1.3%
Cap rate
0.3%
Rent to Value Ratio
Active
$1,649,000
2
bds
|
2
ba
|
1,420
sqft
|
built
2013
580 Washington St, Boston, MA 02111
$-5,110
Cash flow
-16.2%
Cash-on-Cash Return
2.0%
Cap rate
0.5%
Rent to Value Ratio
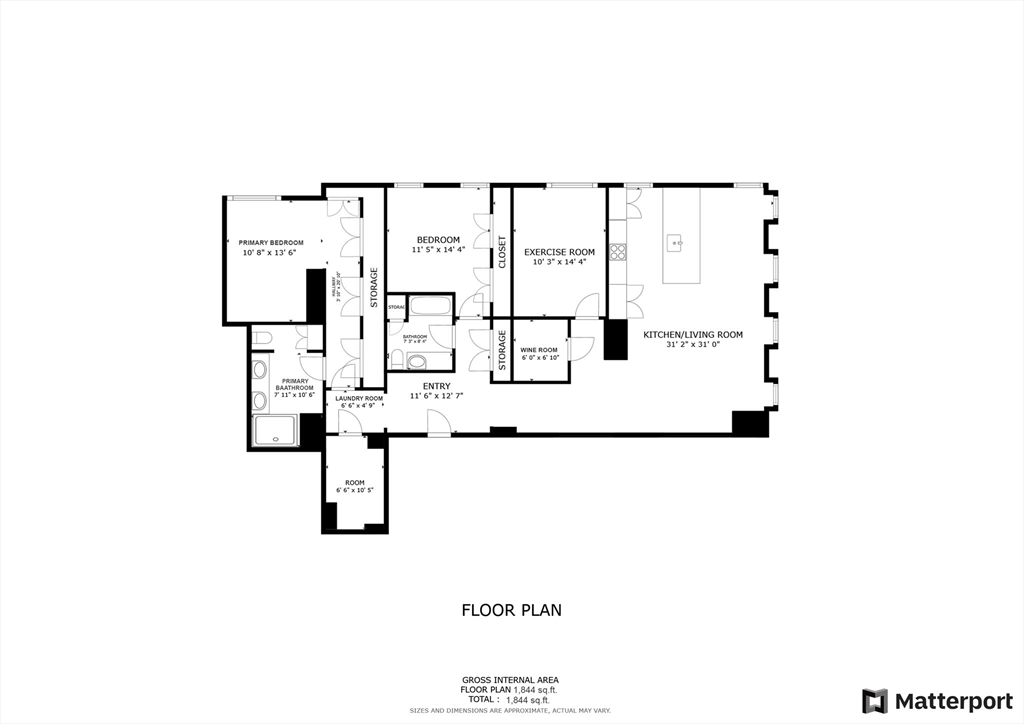
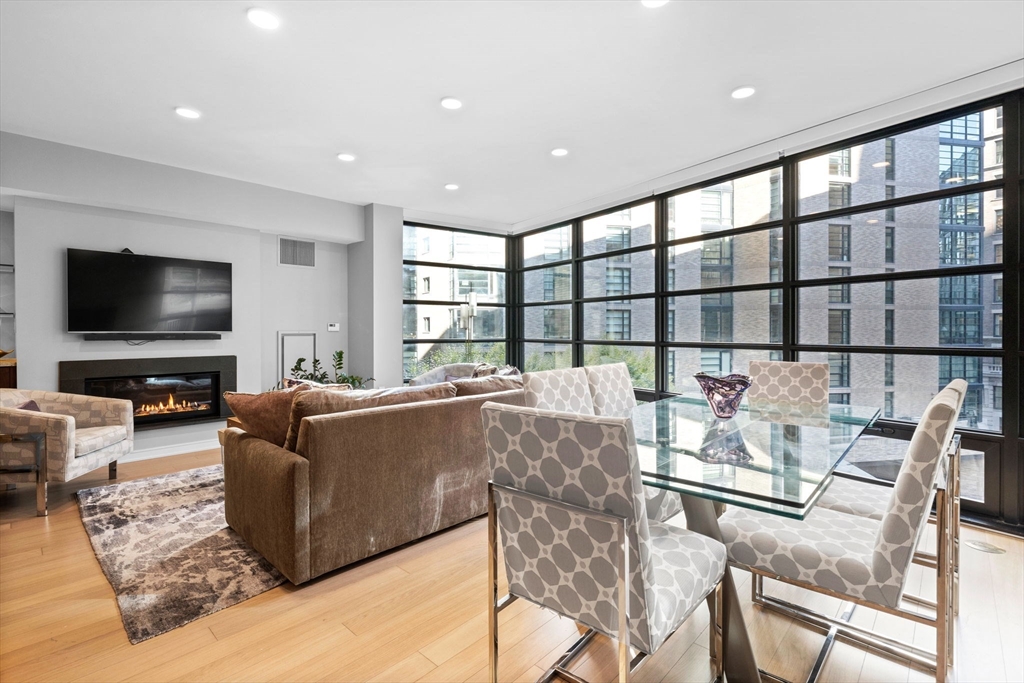
Active
$1,995,000
3
bds
|
2
ba
|
1,844
sqft
|
built
2017
32 Derne St, Boston, MA 02114
$-5,821
Cash flow
-15.2%
Cash-on-Cash Return
2.2%
Cap rate
0.6%
Rent to Value Ratio
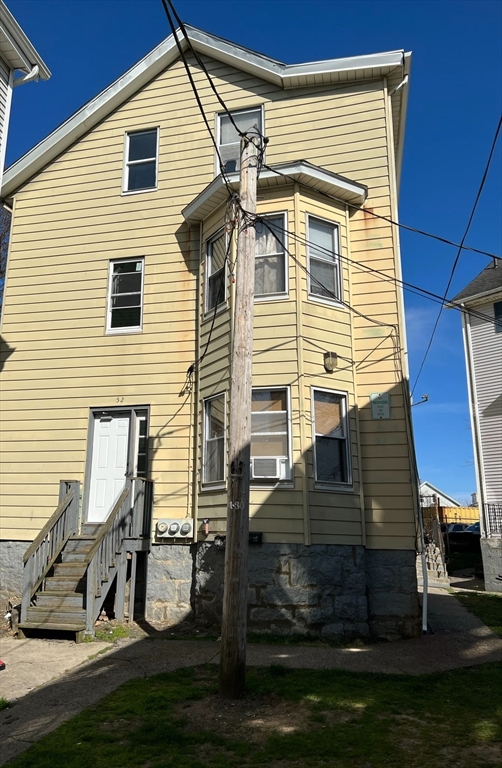
Active
$499,900
6
bds
|
3
ba
|
2,477
sqft
|
built
1900
52 Rocliffe St, Fall River, MA 02723
$-1,336
Cash flow
-13.9%
Cash-on-Cash Return
2.5%
Cap rate
0.4%
Rent to Value Ratio
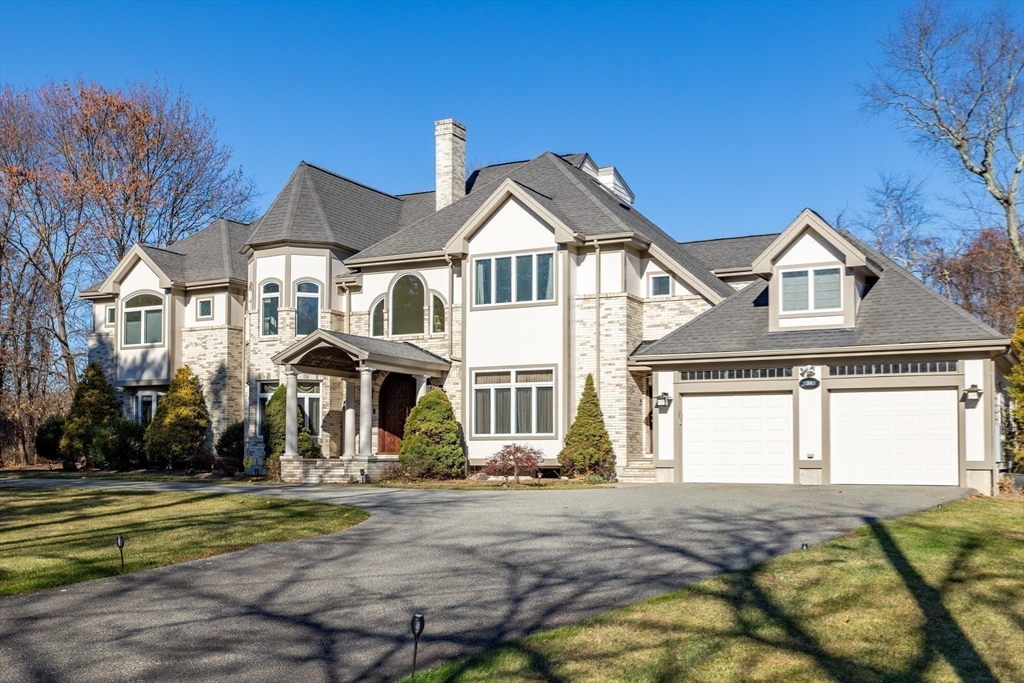
Active
$2,950,000
5
bds
|
7
ba
|
7,230
sqft
|
built
2005
34 Allen St, Lexington, MA 02421
$-11,617
Cash flow
-20.5%
Cash-on-Cash Return
1.0%
Cap rate
0.2%
Rent to Value Ratio
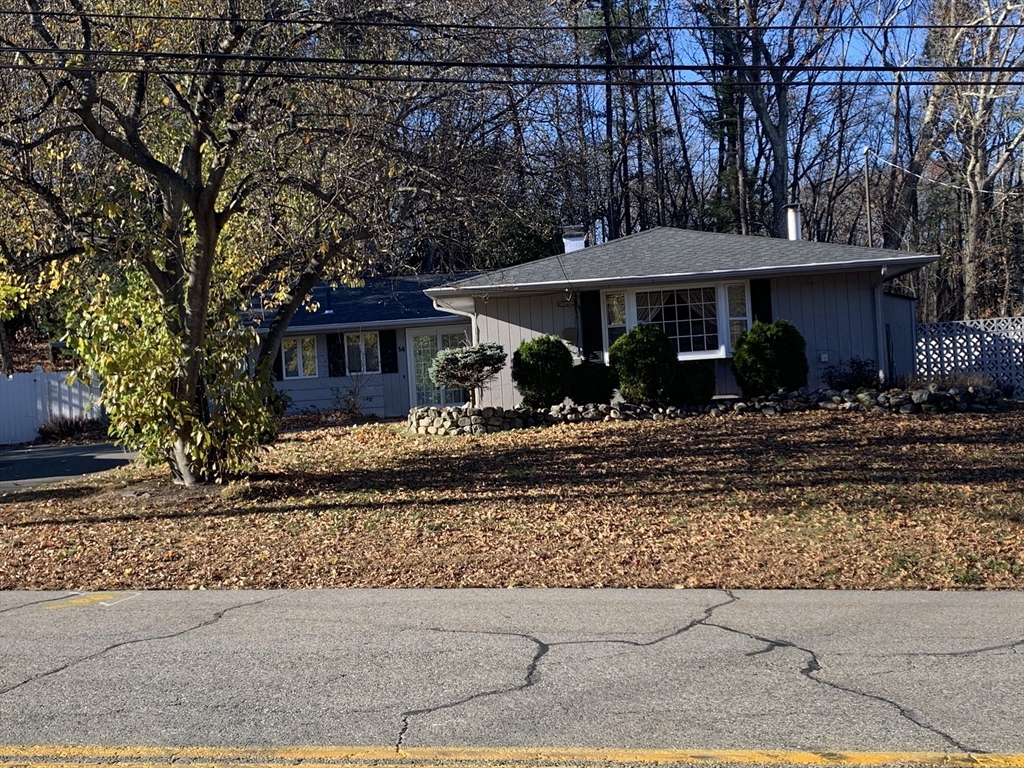
Active
$649,900
3
bds
|
2
ba
|
1,680
sqft
|
built
1960
14 Eisenhower Rd, Framingham, MA 01701
$-1,265
Cash flow
-10.2%
Cash-on-Cash Return
3.3%
Cap rate
0.5%
Rent to Value Ratio
Active
$1,390,000
4
bds
|
3
ba
|
3,034
sqft
|
built
1967
62 Teakettle Ln, Duxbury, MA 02332
$-3,636
Cash flow
-13.6%
Cash-on-Cash Return
2.5%
Cap rate
0.4%
Rent to Value Ratio
Active
$499,900
2
bds
|
4
ba
|
1,939
sqft
|
built
1987
700 Shore Dr, Fall River, MA 02721
$-1,474
Cash flow
-15.4%
Cash-on-Cash Return
2.1%
Cap rate
0.6%
Rent to Value Ratio
Active
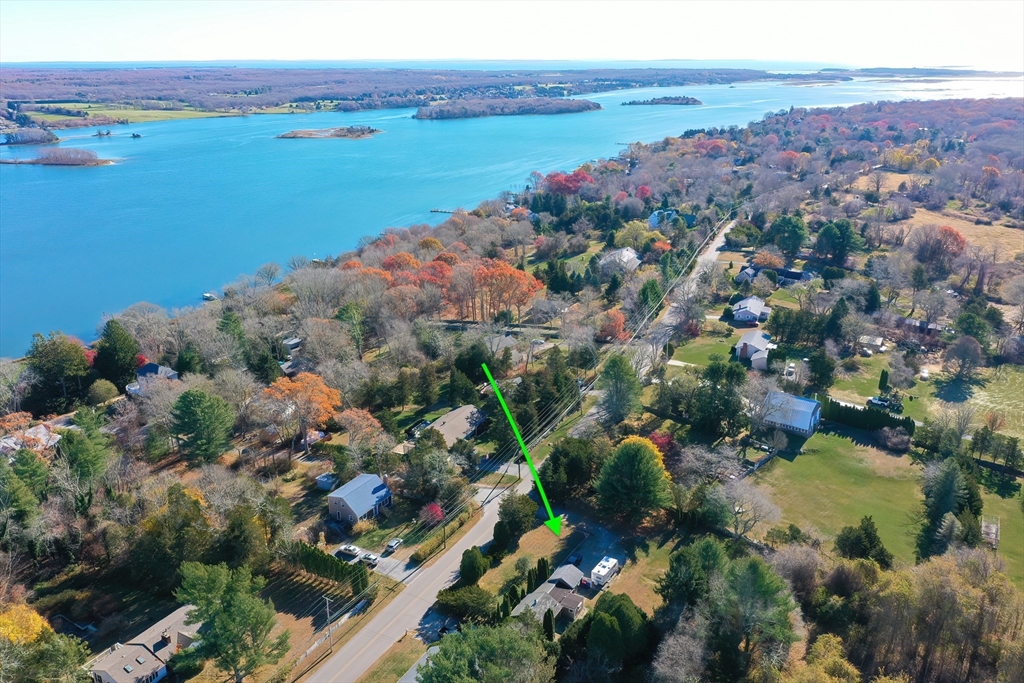
$525,000
1
bds
|
1
ba
|
596
sqft
|
built
1945
1371 Drift Rd, Westport, MA 02790
$-1,587
Cash flow
-15.8%
Cash-on-Cash Return
2.1%
Cap rate
0.3%
Rent to Value Ratio
Active
$1,650,000
4
bds
|
2
ba
|
3,500
sqft
|
built
1901
1789 Broadway, Raynham, MA 02767
$-3,875
Cash flow
-12.3%
Cash-on-Cash Return
2.9%
Cap rate
0.3%
Rent to Value Ratio
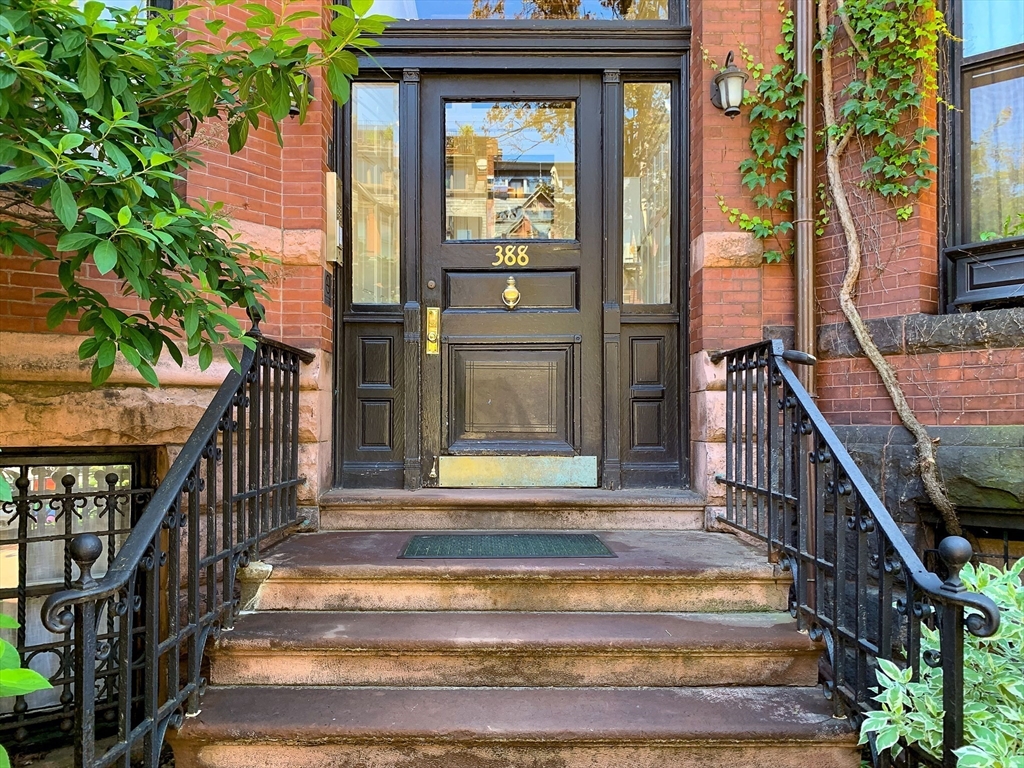
Active
$675,000
1
bds
|
1
ba
|
516
sqft
|
built
1880
388 Marlborough St, Boston, MA 02115
$-2,207
Cash flow
-17.1%
Cash-on-Cash Return
1.8%
Cap rate
0.4%
Rent to Value Ratio
Active
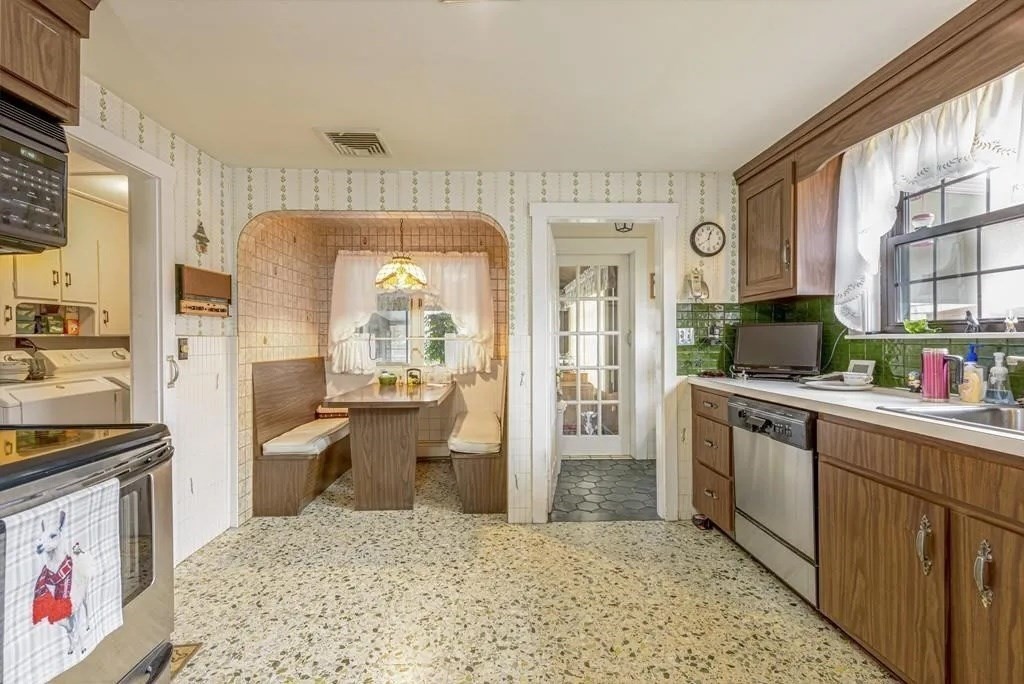
$600,000
2
bds
|
1
ba
|
1,237
sqft
|
built
1954
8 Wyman Ave, Salem, MA 01970
$-691
Cash flow
-6.0%
Cash-on-Cash Return
4.3%
Cap rate
0.6%
Rent to Value Ratio