Massachusetts Investment Properties for Sale
Browse homes for sale and investment properties in Massachusetts. Refine your search by price, property type, or more.
Best cash flowing properties in Massachusetts
Active
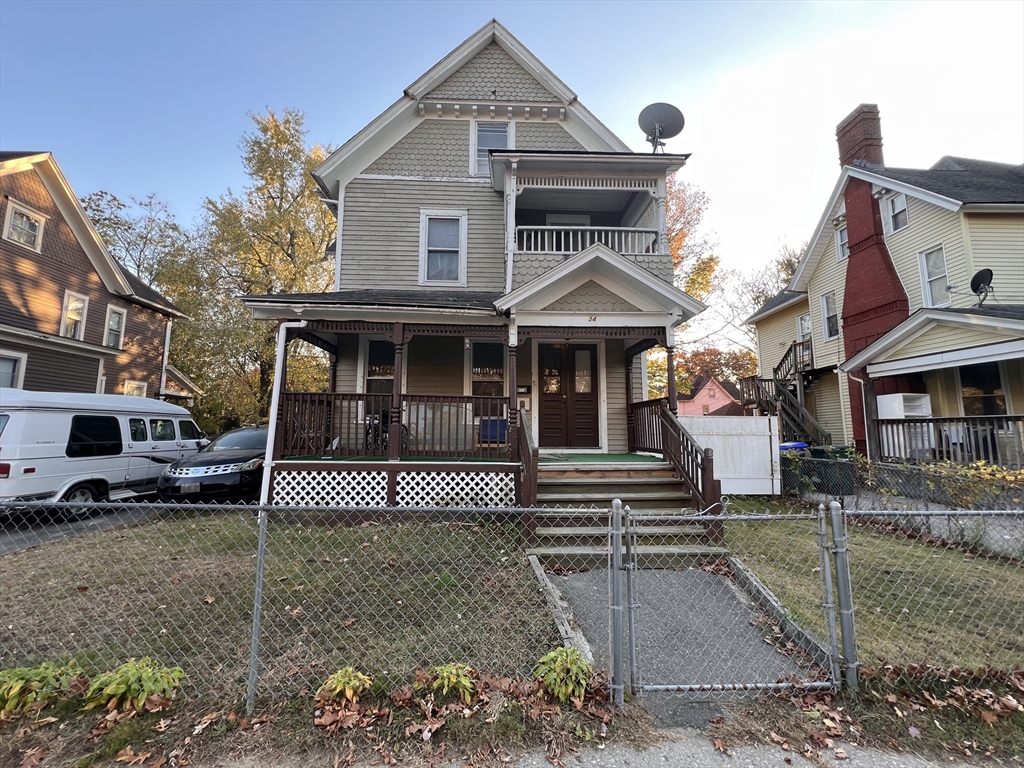
$219,900
6
bds
|
4
ba
|
2,565
sqft
|
built
1911
34 Wellesley St, Springfield, MA 01109
$430
Cash flow
10.2%
Cash-on-Cash Return
8.6%
Cap rate
1.2%
Rent to Value Ratio
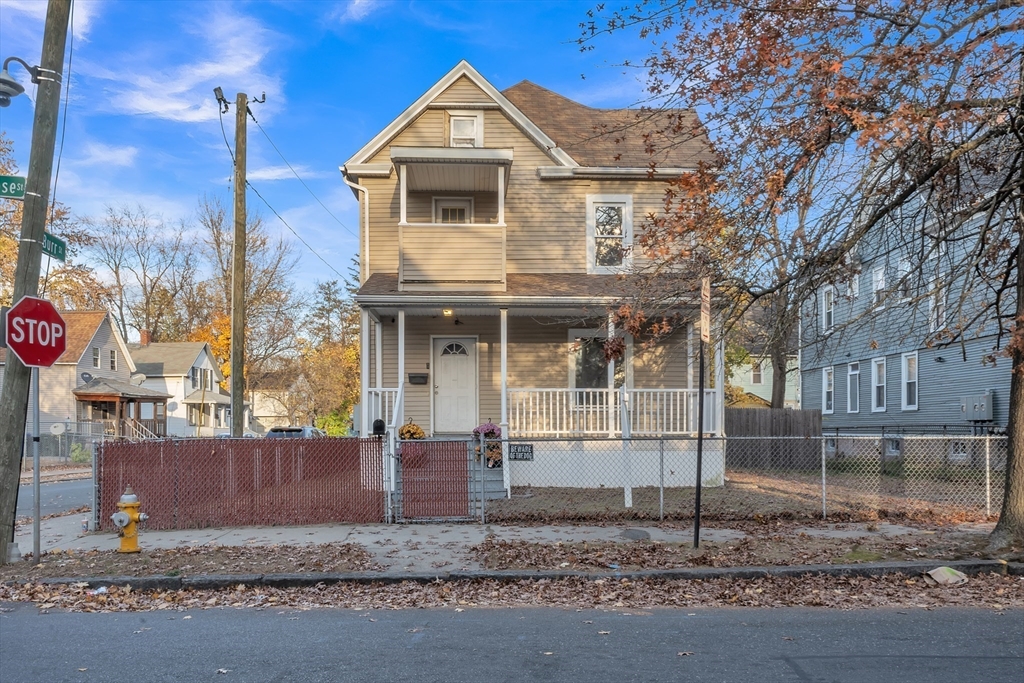
Active under contract
$250,000
4
bds
|
2
ba
|
1,585
sqft
|
built
1919
95 Montrose St, Springfield, MA 01109
$416
Cash flow
8.7%
Cash-on-Cash Return
8.3%
Cap rate
1.1%
Rent to Value Ratio
5,392 out of 10,603 properties for sale in Massachusetts
Limited Results Shown
Create a free account, or log in to reveal all property listings and enjoy the complete experience.
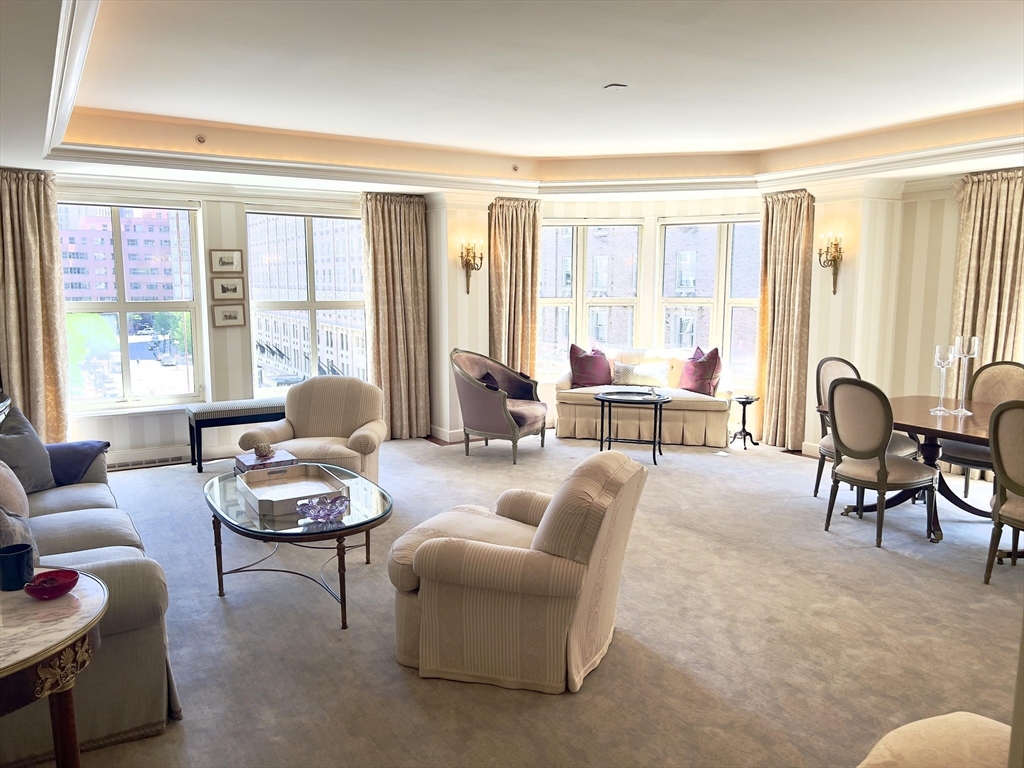
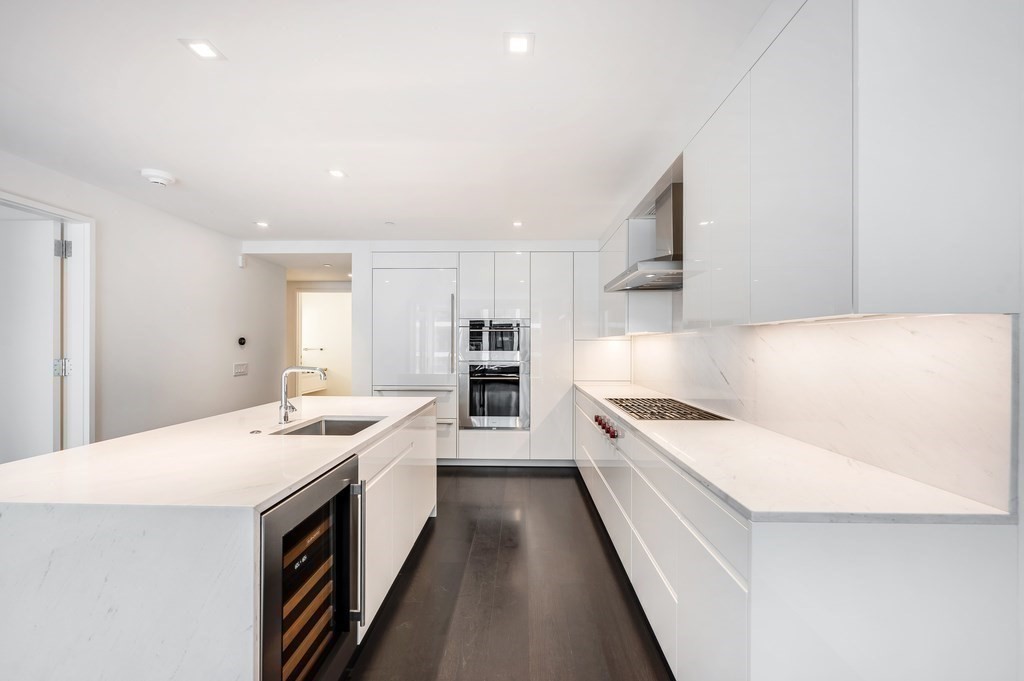
Active
$3,495,000
2
bds
|
3
ba
|
2,077
sqft
|
built
1988
300 Boylston St, Boston, MA 02116
$-16,969
Cash flow
-25.3%
Cash-on-Cash Return
0.5%
Cap rate
0.3%
Rent to Value Ratio
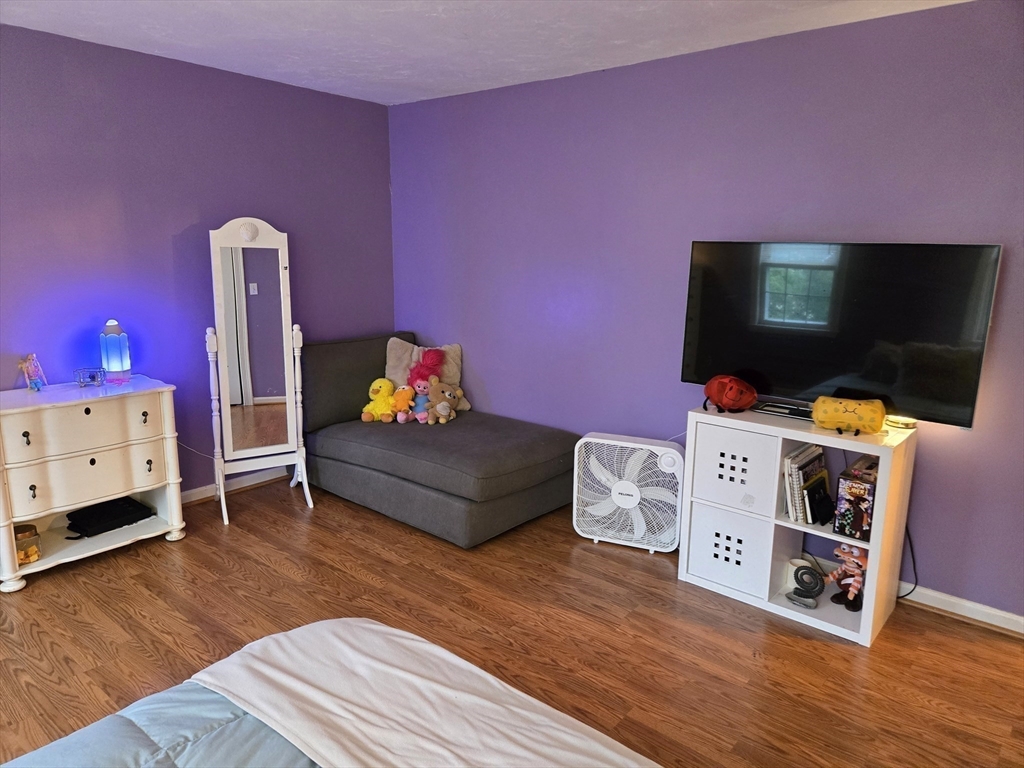
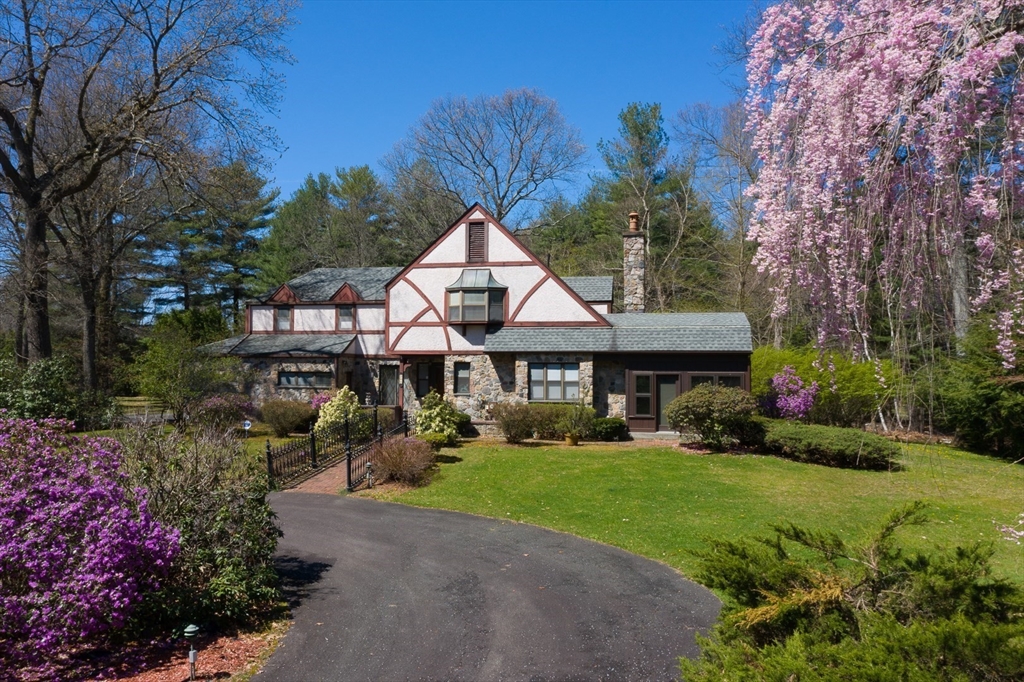
Active
$836,000
3
bds
|
3
ba
|
2,116
sqft
|
built
1996
13 Quail Hollow Cir, Sandwich, MA 02563
$-2,266
Cash flow
-14.1%
Cash-on-Cash Return
3.0%
Cap rate
0.5%
Rent to Value Ratio

Active
$549,000
2
bds
|
2
ba
|
1,059
sqft
|
built
1890
496 E 7th St, Boston, MA 02127
$-1,352
Cash flow
-12.8%
Cash-on-Cash Return
3.3%
Cap rate
0.6%
Rent to Value Ratio
Active
$850,000
1
bds
|
1
ba
|
424
sqft
|
built
1850
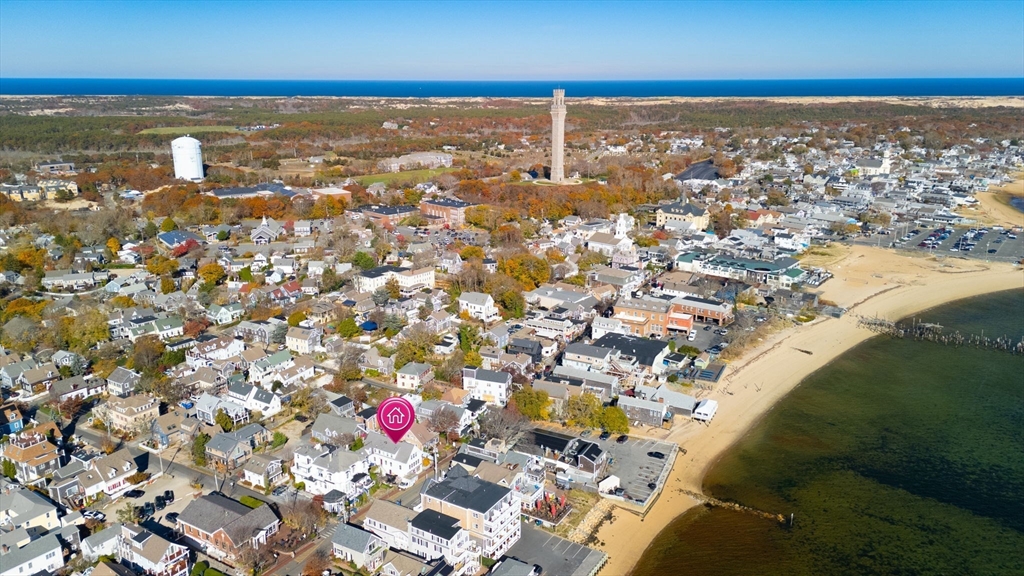
176 Commercial St, Provincetown, MA 02657
$-2,983
Cash flow
-18.3%
Cash-on-Cash Return
2.1%
Cap rate
0.3%
Rent to Value Ratio
Active under contract
$250,000
4
bds
|
2
ba
|
1,585
sqft
|
built
1919
95 Montrose St, Springfield, MA 01109
$416
Cash flow
8.7%
Cash-on-Cash Return
8.3%
Cap rate
1.1%
Rent to Value Ratio
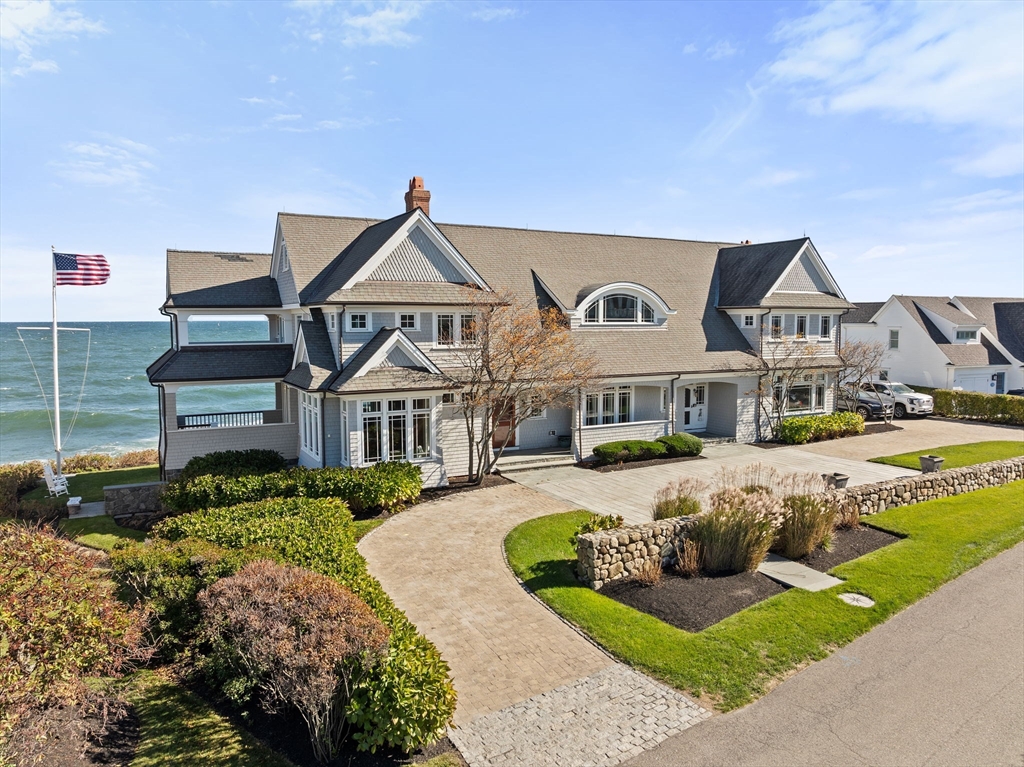
Active
$5,500,000
4
bds
|
7
ba
|
6,102
sqft
|
built
2003
21 Circuit Ave, Scituate, MA 02066
$-26,163
Cash flow
-24.8%
Cash-on-Cash Return
0.6%
Cap rate
0.2%
Rent to Value Ratio
Active
$749,900
1
bds
|
1
ba
|
384
sqft
|
built
1850
495 Commercial St, Provincetown, MA 02657
$-3,396
Cash flow
-23.6%
Cash-on-Cash Return
0.8%
Cap rate
0.3%
Rent to Value Ratio
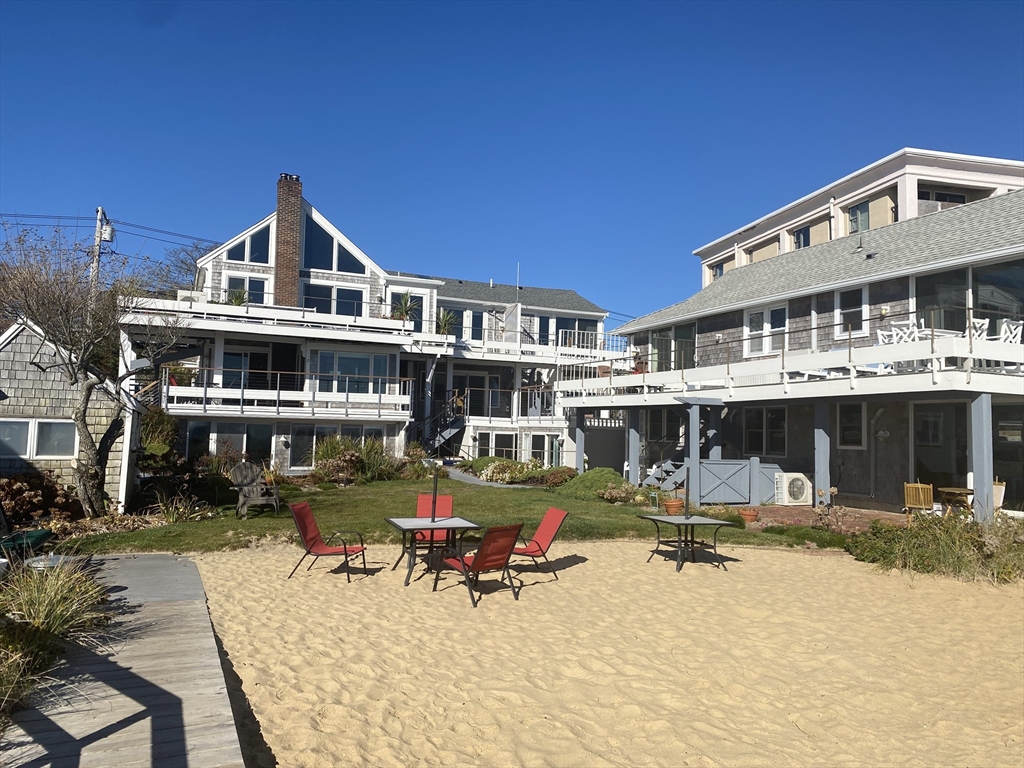
Active
$1,175,000
3
bds
|
2
ba
|
2,662
sqft
|
built
2007
99 Ashburton Ave, Marshfield, MA 02050
$-3,531
Cash flow
-15.7%
Cash-on-Cash Return
2.7%
Cap rate
0.4%
Rent to Value Ratio
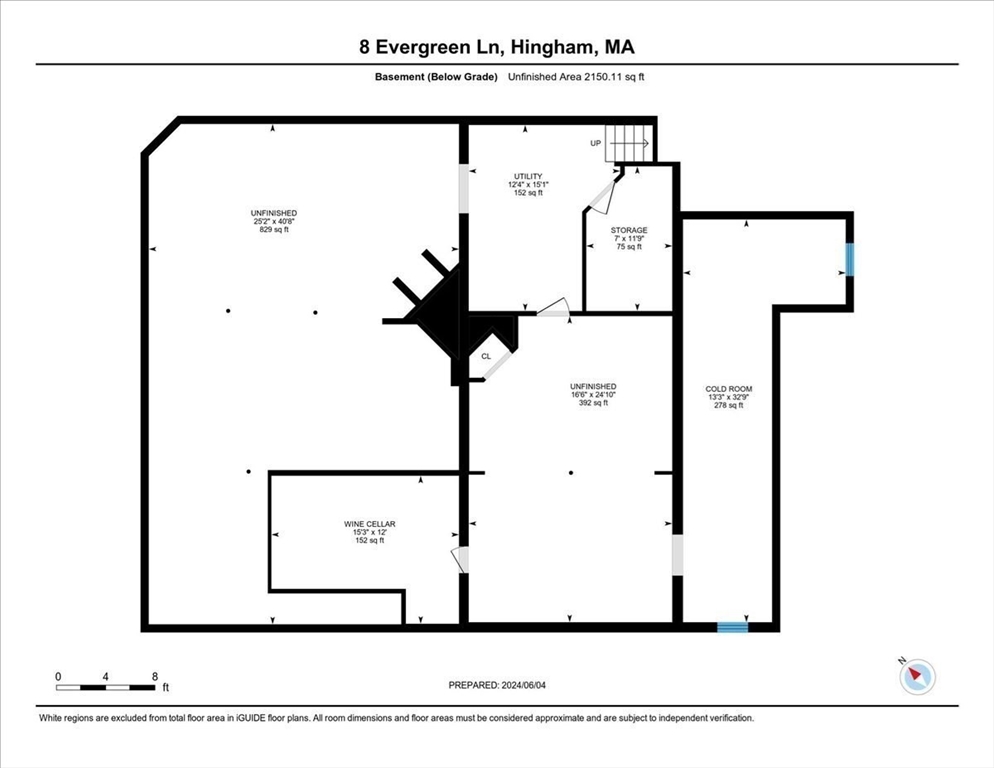
Active
$2,997,000
4
bds
|
6
ba
|
5,855
sqft
|
built
1963
8 Evergreen Ln, Hingham, MA 02043
$-10,882
Cash flow
-18.9%
Cash-on-Cash Return
1.9%
Cap rate
0.3%
Rent to Value Ratio
Active
$3,100,000
2
bds
|
2
ba
|
1,585
sqft
|
built
1989
75-83 Cambridge Pkwy, Cambridge, MA 02142
$-14,611
Cash flow
-24.6%
Cash-on-Cash Return
0.6%
Cap rate
0.3%
Rent to Value Ratio
Active
$719,000
1
bds
|
1
ba
|
502
sqft
|
built
1900
15 River St, Boston, MA 02108
$-3,151
Cash flow
-22.9%
Cash-on-Cash Return
1.0%
Cap rate
0.4%
Rent to Value Ratio
Active
$415,000
2
bds
|
2
ba
|
1,080
sqft
|
built
1983
300 Falmouth Rd, Mashpee, MA 02649
$-826
Cash flow
-10.4%
Cash-on-Cash Return
3.9%
Cap rate
0.7%
Rent to Value Ratio
Active
$565,000
3
bds
|
2
ba
|
1,571
sqft
|
built
1938
108 West St, Brockton, MA 02301
$-910
Cash flow
-8.4%
Cash-on-Cash Return
4.4%
Cap rate
0.6%
Rent to Value Ratio
Active
$320,000
6
bds
|
3
ba
|
3,179
sqft
|
built
1906
61-63 Pomona St, Springfield, MA 01108
$-294
Cash flow
-4.8%
Cash-on-Cash Return
5.2%
Cap rate
0.8%
Rent to Value Ratio
Active
$1,925,000
1
bds
|
2
ba
|
1,128
sqft
|
built
2022
150 Seaport Blvd, Boston, MA 02210
$-8,298
Cash flow
-22.5%
Cash-on-Cash Return
1.1%
Cap rate
0.5%
Rent to Value Ratio
Active
$1,100,000
4
bds
|
5
ba
|
4,814
sqft
|
built
1983
242 Eastwood Dr, Westfield, MA 01085
$-3,812
Cash flow
-18.1%
Cash-on-Cash Return
2.1%
Cap rate
0.4%
Rent to Value Ratio
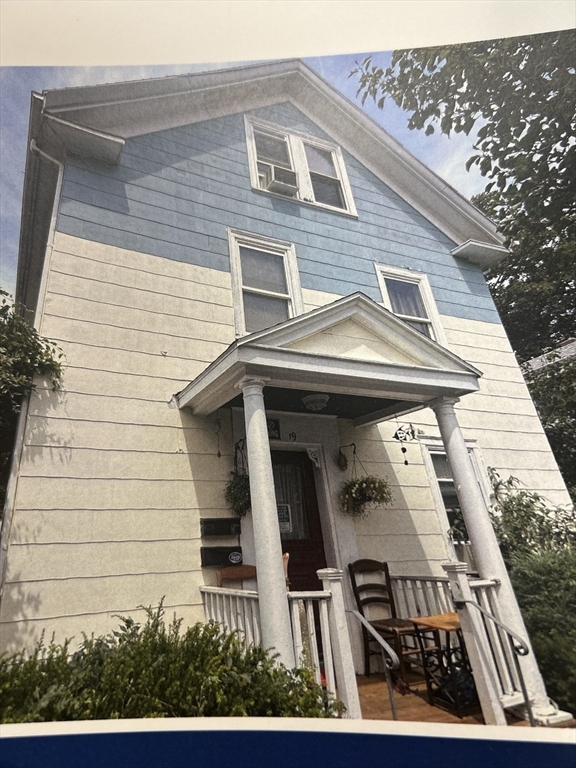
Active
$774,999
5
bds
|
3
ba
|
2,459
sqft
|
built
1900
19 Pond St, Beverly, MA 01915
$-2,609
Cash flow
-17.6%
Cash-on-Cash Return
2.2%
Cap rate
0.4%
Rent to Value Ratio
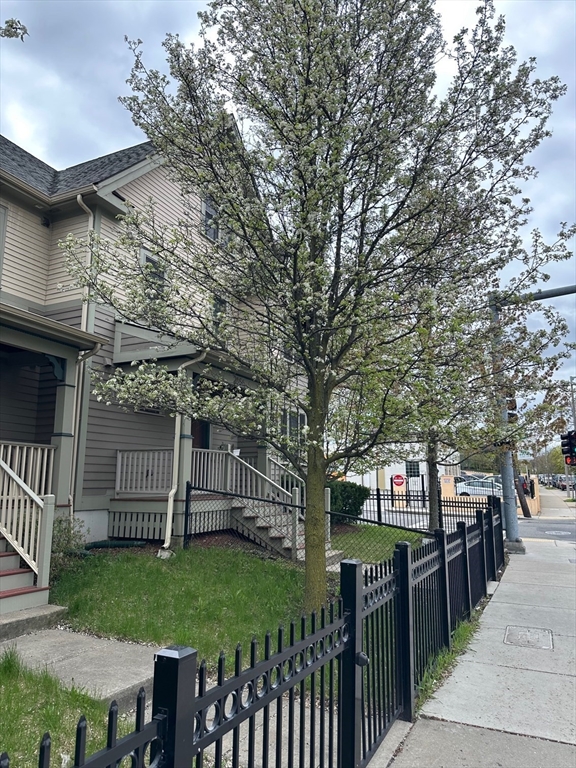
Active
$899,000
4
bds
|
4
ba
|
2,648
sqft
|
built
2005
2856 Washington St, Boston, MA 02119
$-2,646
Cash flow
-15.4%
Cash-on-Cash Return
2.8%
Cap rate
0.5%
Rent to Value Ratio

Active
$315,000
3
bds
|
2
ba
|
1,608
sqft
|
built
1930
145 Main St, Westfield, MA 01085
$-235
Cash flow
-3.9%
Cash-on-Cash Return
5.4%
Cap rate
0.8%
Rent to Value Ratio

Active
$1,139,900
5
bds
|
4
ba
|
4,500
sqft
|
built
1955
19 Mohawk Rd, Burlington, MA 01803
$-2,653
Cash flow
-12.1%
Cash-on-Cash Return
3.5%
Cap rate
0.5%
Rent to Value Ratio
Active
$1,999,000
6
bds
|
4
ba
|
5,376
sqft
|
built
2016
5 Oak St, Wareham, MA 02571
$-10,081
Cash flow
-26.3%
Cash-on-Cash Return
0.2%
Cap rate
0.2%
Rent to Value Ratio
Active
$870,000
4
bds
|
3
ba
|
2,337
sqft
|
built
1990
17 Whitehead Ave, Hull, MA 02045
$-2,687
Cash flow
-16.1%
Cash-on-Cash Return
2.6%
Cap rate
0.4%
Rent to Value Ratio
Active
$385,200
2
bds
|
2
ba
|
994
sqft
|
built
1986
2 Englewood Dr, Harwich, MA 02645
$-953
Cash flow
-12.9%
Cash-on-Cash Return
3.3%
Cap rate
0.6%
Rent to Value Ratio
Active
$1,399,000
6
bds
|
4
ba
|
3,284
sqft
|
built
1880
426 N Main St, Randolph, MA 02368
$-5,753
Cash flow
-21.5%
Cash-on-Cash Return
1.3%
Cap rate
0.2%
Rent to Value Ratio

Active
$10,400,000
6
bds
|
6
ba
|
8,386
sqft
|
built
1893
8 Traill St, Cambridge, MA 02138
$-52,756
Cash flow
-26.5%
Cash-on-Cash Return
0.2%
Cap rate
0.1%
Rent to Value Ratio

Active
$8,900,000
4
bds
|
4
ba
|
3,771
sqft
|
built
1860
36 Commonwealth Ave, Boston, MA 02116
$-49,593
Cash flow
-29.1%
Cash-on-Cash Return
-0.4%
Cap rate
0.1%
Rent to Value Ratio
Active
$1,499,000
7
bds
|
5
ba
|
2,802
sqft
|
built
1918
69 Suomi Rd, Quincy, MA 02169
$-5,637
Cash flow
-19.6%
Cash-on-Cash Return
1.8%
Cap rate
0.3%
Rent to Value Ratio
Active
$925,000
3
bds
|
5
ba
|
3,724
sqft
|
built
2012
143 Clemence Hill Rd, Southbridge, MA 01550
$-1,936
Cash flow
-10.9%
Cash-on-Cash Return
3.8%
Cap rate
0.6%
Rent to Value Ratio
Active
$219,900
6
bds
|
4
ba
|
2,565
sqft
|
built
1911
34 Wellesley St, Springfield, MA 01109
$430
Cash flow
10.2%
Cash-on-Cash Return
8.6%
Cap rate
1.2%
Rent to Value Ratio
Active
$589,000
2
bds
|
2
ba
|
1,364
sqft
|
built
1989
85 E Squantum St, Quincy, MA 02171
$-2,458
Cash flow
-21.8%
Cash-on-Cash Return
1.3%
Cap rate
0.5%
Rent to Value Ratio
Active
$8,900,000
5
bds
|
8
ba
|
13,220
sqft
|
built
2006
150 Horseneck Rd, Dartmouth, MA 02748
$-45,897
Cash flow
-26.9%
Cash-on-Cash Return
0.1%
Cap rate
0.1%
Rent to Value Ratio
Active
$999,900
1
bds
|
1
ba
|
375
sqft
|
built
1850
495 Commercial St, Provincetown, MA 02657
$-4,411
Cash flow
-23.0%
Cash-on-Cash Return
1.0%
Cap rate
0.3%
Rent to Value Ratio
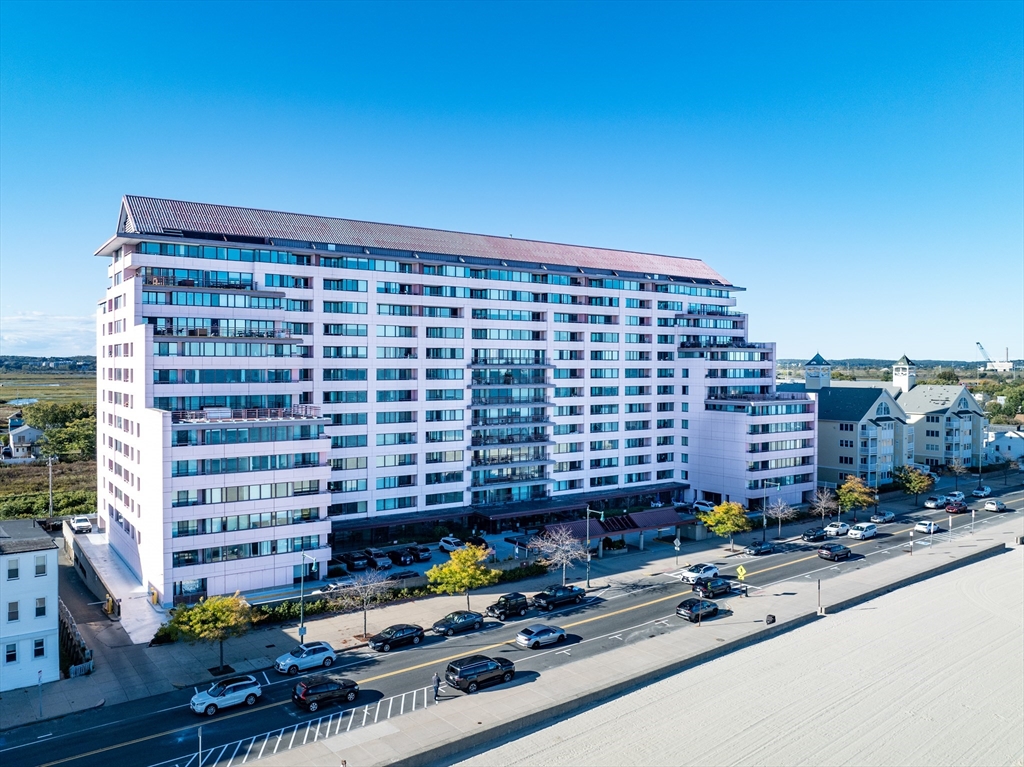
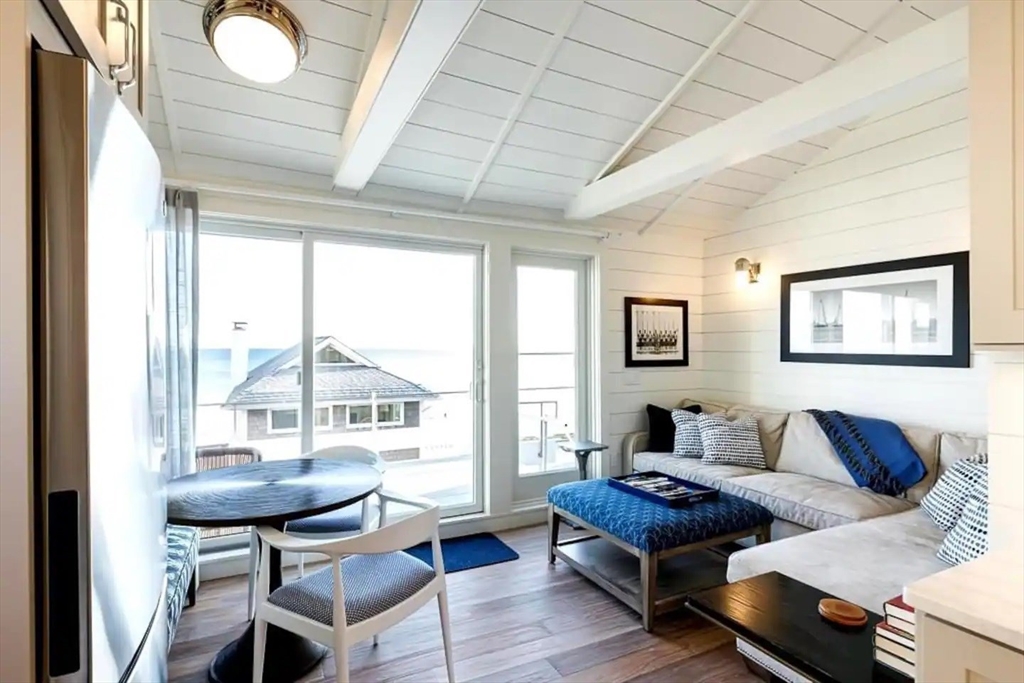
Pending
$330,000
bds
|
1
ba
|
483
sqft
|
built
1988
350 Revere Beach Blvd, Revere, MA 02151
$-584
Cash flow
-9.2%
Cash-on-Cash Return
4.2%
Cap rate
0.8%
Rent to Value Ratio
Active
$2,199,999
4
bds
|
6
ba
|
6,748
sqft
|
built
2021
116 Indian Ln, Canton, MA 02021
$-4,987
Cash flow
-11.8%
Cash-on-Cash Return
3.6%
Cap rate
0.5%
Rent to Value Ratio
Active
$199,900
5
bds
|
3
ba
|
3,720
sqft
|
built
1900
25 Pleasant St, Westfield, MA 01085
$217
Cash flow
5.7%
Cash-on-Cash Return
7.6%
Cap rate
1.3%
Rent to Value Ratio
Active
$2,399,000
4
bds
|
4
ba
|
2,745
sqft
|
built
2019
56 Belmont St, Boston, MA 02129
$-8,467
Cash flow
-18.4%
Cash-on-Cash Return
2.0%
Cap rate
0.4%
Rent to Value Ratio
Active
$1,625,000
3
bds
|
2
ba
|
1,495
sqft
|
built
1986
6 Gerts Way, Edgartown, MA 02539
$-4,361
Cash flow
-14.0%
Cash-on-Cash Return
3.1%
Cap rate
0.4%
Rent to Value Ratio
Active
$6,499,000
7
bds
|
8
ba
|
8,905
sqft
|
built
2022
863 Concord Ave, Belmont, MA 02478
$-31,256
Cash flow
-25.1%
Cash-on-Cash Return
0.5%
Cap rate
0.2%
Rent to Value Ratio
Active
$369,000
2
bds
|
1
ba
|
730
sqft
|
built
1946
461 Arborway, Boston, MA 02130
$-1,025
Cash flow
-14.5%
Cash-on-Cash Return
2.9%
Cap rate
0.7%
Rent to Value Ratio
Active
$8,395,000
5
bds
|
7
ba
|
7,000
sqft
|
built
2024
61 Heath St, Brookline, MA 02445
$-37,683
Cash flow
-23.4%
Cash-on-Cash Return
0.9%
Cap rate
0.1%
Rent to Value Ratio