Massachusetts Investment Properties for Sale
Browse homes for sale and investment properties in Massachusetts. Refine your search by price, property type, or more.
Best cash flowing properties in Massachusetts

Active
$159,900
1
bds
|
1
ba
|
376
sqft
|
built
1893
285 Lynn Shore Dr, Lynn, MA 01902
$465
Cash flow
15.2%
Cash-on-Cash Return
9.2%
Cap rate
1.3%
Rent to Value Ratio

Pending
$319,900
3
bds
|
2
ba
|
4,056
sqft
|
built
1921
523 Boston Rd, Springfield, MA 01109
$246
Cash flow
4.0%
Cash-on-Cash Return
6.6%
Cap rate
1.0%
Rent to Value Ratio
5,327 out of 10,465 properties for sale in Massachusetts
Limited Results Shown
Create a free account, or log in to reveal all property listings and enjoy the complete experience.

Active
$9,500,000
3
bds
|
3
ba
|
2,684
sqft
|
built
1982
2 Commonwealth Ave, Boston, MA 02116
$-48,663
Cash flow
-26.7%
Cash-on-Cash Return
-0.5%
Cap rate
0.1%
Rent to Value Ratio

Active
$11,900,000
5
bds
|
10
ba
|
11,352
sqft
|
built
2012
70 Possum Rd, Weston, MA 02493
$-58,456
Cash flow
-25.6%
Cash-on-Cash Return
-0.2%
Cap rate
0.1%
Rent to Value Ratio

Active
$5,500,000
5
bds
|
4
ba
|
6,700
sqft
|
built
1989
24 Wood Island Rd, Scituate, MA 02066
$-22,945
Cash flow
-21.8%
Cash-on-Cash Return
0.7%
Cap rate
0.2%
Rent to Value Ratio

Active
$3,950,000
5
bds
|
7
ba
|
7,561
sqft
|
built
1989
1069 Horseneck Rd, Westport, MA 02790
$-16,669
Cash flow
-22.0%
Cash-on-Cash Return
0.6%
Cap rate
0.1%
Rent to Value Ratio
Active
$1,775,000
3
bds
|
3
ba
|
1,502
sqft
|
built
2013
580 Washington St, Boston, MA 02111
$-5,320
Cash flow
-15.6%
Cash-on-Cash Return
2.1%
Cap rate
0.5%
Rent to Value Ratio
Active
$499,000
1
bds
|
1
ba
|
445
sqft
|
built
2020
99 Sumner St, Boston, MA 02128
$-1,415
Cash flow
-14.8%
Cash-on-Cash Return
2.3%
Cap rate
0.6%
Rent to Value Ratio
Active
$1,250,000
4
bds
|
2
ba
|
2,124
sqft
|
built
1983
83 Colonial Way, Falmouth, MA 02540
$-3,413
Cash flow
-14.2%
Cash-on-Cash Return
2.4%
Cap rate
0.4%
Rent to Value Ratio

Active
$1,099,000
4
bds
|
3
ba
|
1,709
sqft
|
built
1960
342 Needham St, Dedham, MA 02026
$-2,651
Cash flow
-12.6%
Cash-on-Cash Return
2.8%
Cap rate
0.4%
Rent to Value Ratio
Active
$499,000
1
bds
|
1
ba
|
431
sqft
|
built
2020
99 Sumner St, Boston, MA 02128
$-1,097
Cash flow
-11.5%
Cash-on-Cash Return
3.0%
Cap rate
0.6%
Rent to Value Ratio

Active
$3,065,000
29
bds
|
14
ba
|
11,627
sqft
|
built
1900
260 Fountain St, Fall River, MA 02721
$-15,262
Cash flow
-26.0%
Cash-on-Cash Return
-0.3%
Cap rate
0.0%
Rent to Value Ratio

Active
$399,000
3
bds
|
3
ba
|
1,540
sqft
|
built
1900
50 Frankfort St, Fitchburg, MA 01420
$-272
Cash flow
-3.6%
Cash-on-Cash Return
4.9%
Cap rate
0.7%
Rent to Value Ratio
Active
$345,000
2
bds
|
3
ba
|
1,293
sqft
|
built
1900
50 Frankfort St, Fitchburg, MA 01420
$-107
Cash flow
-1.6%
Cash-on-Cash Return
5.3%
Cap rate
0.8%
Rent to Value Ratio

Active
$370,000
2
bds
|
2
ba
|
1,339
sqft
|
built
1900
50 Frankfort St, Fitchburg, MA 01420
$-225
Cash flow
-3.2%
Cash-on-Cash Return
4.9%
Cap rate
0.7%
Rent to Value Ratio
Active
$1,689,000
5
bds
|
6
ba
|
8,771
sqft
|
built
1990
14 High Meadow Cir, East Longmeadow, MA 01028
$-6,605
Cash flow
-20.4%
Cash-on-Cash Return
1.0%
Cap rate
0.2%
Rent to Value Ratio

Active
$7,995,000
5
bds
|
3
ba
|
4,524
sqft
|
built
1925
341 King Caesar Rd, Duxbury, MA 02332
$-36,586
Cash flow
-23.9%
Cash-on-Cash Return
0.2%
Cap rate
0.1%
Rent to Value Ratio

Active
$3,490,000
4
bds
|
3
ba
|
2,725
sqft
|
built
1850
61 Mount Vernon St, Boston, MA 02129
$-14,955
Cash flow
-22.4%
Cash-on-Cash Return
0.5%
Cap rate
0.3%
Rent to Value Ratio

Active
$9,500,000
7
bds
|
8
ba
|
9,500
sqft
|
built
1912
355 Buckminster Rd, Brookline, MA 02445
$-872,149
Cash flow
-479.0%
Cash-on-Cash Return
-104.5%
Cap rate
0.1%
Rent to Value Ratio

Active
$3,799,000
3
bds
|
4
ba
|
2,525
sqft
|
built
2019
153 Bayside Rd, Quincy, MA 02171
$-12,336
Cash flow
-16.9%
Cash-on-Cash Return
1.8%
Cap rate
0.3%
Rent to Value Ratio

Active
$8,950,000
4
bds
|
6
ba
|
6,596
sqft
|
built
1822
11 Chestnut St, Boston, MA 02108
$-41,249
Cash flow
-24.0%
Cash-on-Cash Return
0.1%
Cap rate
0.1%
Rent to Value Ratio

Active
$9,950,000
8
bds
|
8
ba
|
9,504
sqft
|
built
1899
164 Marlborough St, Boston, MA 02116
$-46,228
Cash flow
-24.2%
Cash-on-Cash Return
0.1%
Cap rate
0.1%
Rent to Value Ratio

Active
$1,350,000
3
bds
|
3
ba
|
1,800
sqft
|
built
1930
58 Oak St, Wellesley, MA 02482
$-2,299
Cash flow
-8.9%
Cash-on-Cash Return
3.6%
Cap rate
0.5%
Rent to Value Ratio
Active
$3,000,000
3
bds
|
1
ba
|
1,512
sqft
|
built
1998
337 Old Fall River Rd, Dartmouth, MA 02747
$-12,226
Cash flow
-21.3%
Cash-on-Cash Return
0.8%
Cap rate
0.1%
Rent to Value Ratio

Active
$1,649,000
2
bds
|
2
ba
|
1,219
sqft
|
built
2021
45 Lewis St, Boston, MA 02128
$-6,341
Cash flow
-20.1%
Cash-on-Cash Return
1.1%
Cap rate
0.3%
Rent to Value Ratio

Active
$1,875,000
2
bds
|
2
ba
|
1,367
sqft
|
built
2018
110 Broad St, Boston, MA 02110
$-6,593
Cash flow
-18.3%
Cash-on-Cash Return
1.5%
Cap rate
0.4%
Rent to Value Ratio

Pending
$8,750,000
3
bds
|
4
ba
|
2,383
sqft
|
built
2015
22 Liberty Pl, Boston, MA 02127
$-42,840
Cash flow
-25.5%
Cash-on-Cash Return
-0.2%
Cap rate
0.1%
Rent to Value Ratio

Active
$14,800,000
3
bds
|
5
ba
|
4,361
sqft
|
built
2019
1 Dalton St, Boston, MA 02115
$-78,579
Cash flow
-27.7%
Cash-on-Cash Return
-0.7%
Cap rate
0.1%
Rent to Value Ratio
Active
$519,000
4
bds
|
3
ba
|
3,393
sqft
|
built
1988
65 Lake Ave, Worcester, MA 01604
$-3,035
Cash flow
-30.5%
Cash-on-Cash Return
-1.3%
Cap rate
0.8%
Rent to Value Ratio
Active
$2,700,000
5
bds
|
5
ba
|
5,700
sqft
|
built
2025
55 Widow Rites Ln, Sudbury, MA 01776
$-7,937
Cash flow
-15.3%
Cash-on-Cash Return
2.2%
Cap rate
0.3%
Rent to Value Ratio
Active
$4,495,000
3
bds
|
3
ba
|
2,654
sqft
|
built
2001
100 Belvidere St, Boston, MA 02199
$-24,152
Cash flow
-28.0%
Cash-on-Cash Return
-0.8%
Cap rate
0.2%
Rent to Value Ratio
Active
$6,499,000
7
bds
|
9
ba
|
6,000
sqft
|
built
2016
75 Goddard Ave, Brookline, MA 02445
$-857,050
Cash flow
-688.0%
Cash-on-Cash Return
-152.6%
Cap rate
0.2%
Rent to Value Ratio

Active
$1,099,995
2
bds
|
2
ba
|
1,212
sqft
|
built
1972
85 E India Row, Boston, MA 02110
$-3,122
Cash flow
-14.8%
Cash-on-Cash Return
2.3%
Cap rate
0.5%
Rent to Value Ratio

Active
$1,045,000
1
bds
|
1
ba
|
810
sqft
|
built
1999
1 Huntington Ave, Boston, MA 02116
$-3,527
Cash flow
-17.6%
Cash-on-Cash Return
1.6%
Cap rate
0.5%
Rent to Value Ratio

Active
$810,000
3
bds
|
1
ba
|
1,407
sqft
|
built
1945
16 Shoreview Ave, Mattapoisett, MA 02739
$-2,024
Cash flow
-13.0%
Cash-on-Cash Return
2.7%
Cap rate
0.4%
Rent to Value Ratio
Pending
$319,900
3
bds
|
2
ba
|
4,056
sqft
|
built
1921
523 Boston Rd, Springfield, MA 01109
$246
Cash flow
4.0%
Cash-on-Cash Return
6.6%
Cap rate
1.0%
Rent to Value Ratio
Active
$3,550,000
6
bds
|
7
ba
|
6,197
sqft
|
built
2023
7 Stage Coach Rd, Lexington, MA 02421
$-11,383
Cash flow
-16.7%
Cash-on-Cash Return
1.8%
Cap rate
0.3%
Rent to Value Ratio
Active
$889,900
3
bds
|
3
ba
|
1,800
sqft
|
built
2024
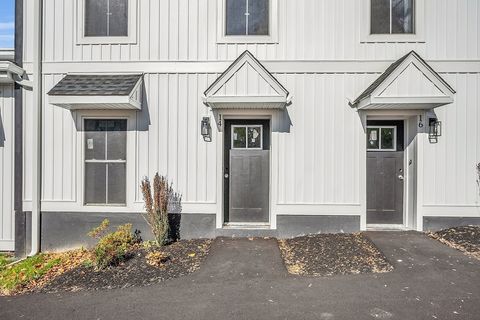
3 Michael Ln, Haverhill, MA 01830
$-1,451
Cash flow
-8.5%
Cash-on-Cash Return
3.7%
Cap rate
0.4%
Rent to Value Ratio

Active
$1,750,000
4
bds
|
5
ba
|
3,500
sqft
|
built
1900
1015 Hale St, Beverly, MA 01915
$-4,318
Cash flow
-12.9%
Cash-on-Cash Return
2.7%
Cap rate
0.5%
Rent to Value Ratio

Active
$10,950,000
6
bds
|
6
ba
|
5,700
sqft
|
built
1870
1 Fairfield St, Boston, MA 02116
$-49,766
Cash flow
-23.7%
Cash-on-Cash Return
0.2%
Cap rate
0.1%
Rent to Value Ratio

Active
$889,000
3
bds
|
3
ba
|
2,100
sqft
|
built
2023
1 Michael Ln, Haverhill, MA 01830
$-1,792
Cash flow
-10.5%
Cash-on-Cash Return
3.3%
Cap rate
0.4%
Rent to Value Ratio
Active
$159,900
1
bds
|
1
ba
|
376
sqft
|
built
1893
285 Lynn Shore Dr, Lynn, MA 01902
$465
Cash flow
15.2%
Cash-on-Cash Return
9.2%
Cap rate
1.3%
Rent to Value Ratio