Mableton, GA Investment Properties for Sale
Browse homes for sale and investment properties in Mableton, GA. Refine your search by price, property type, or more.
Best cash flowing properties in Mableton, GA
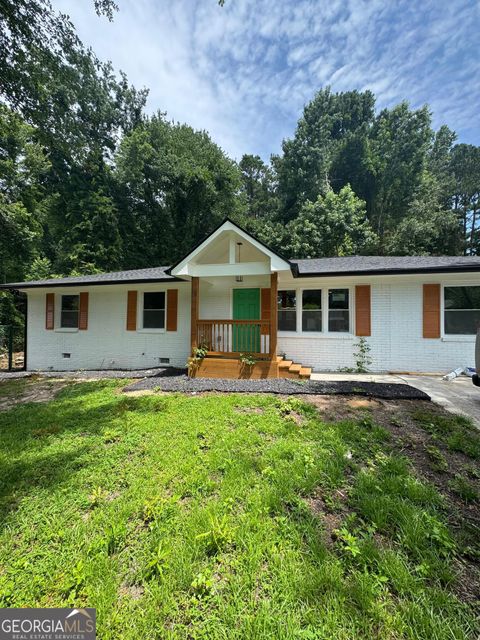
Active
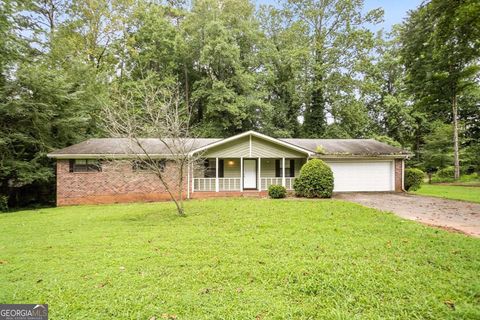
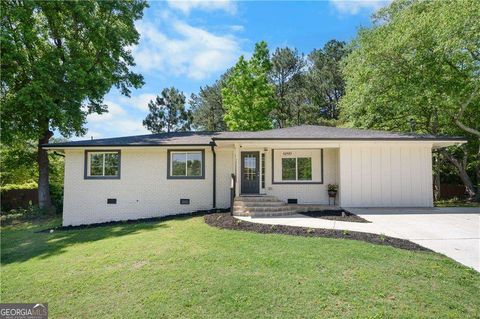
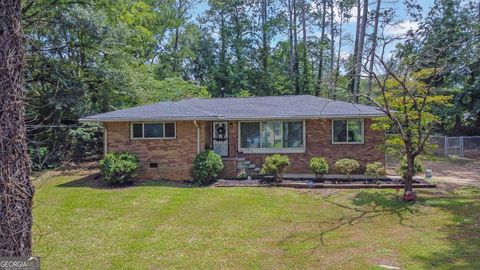
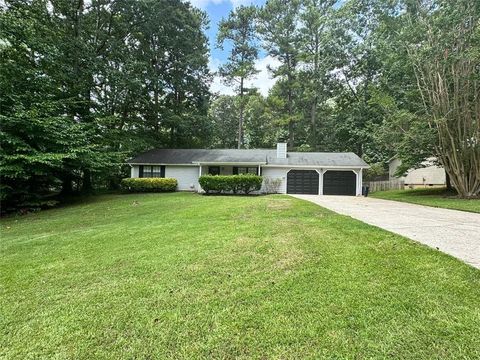
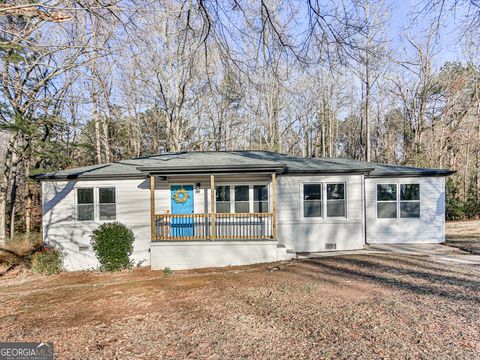
$210,000
4
bds
|
3
ba
|
1,512
sqft
|
built
1981
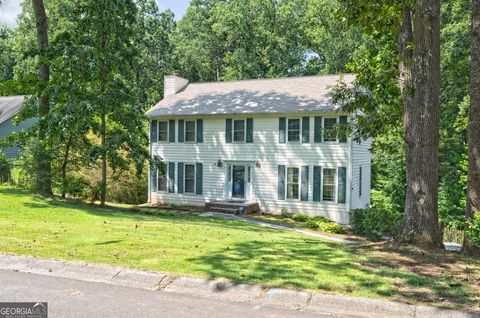
5215 Concord Ridge Dr SW, Mableton, GA 30126
$119
Cash flow
3.0%
Cash-on-Cash Return
6.8%
Cap rate
1.0%
Rent to Value Ratio
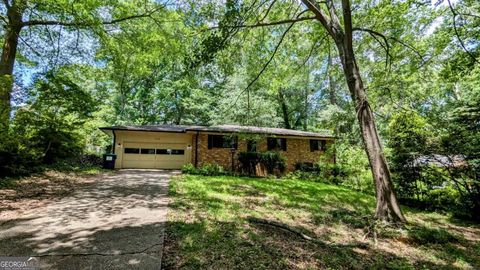
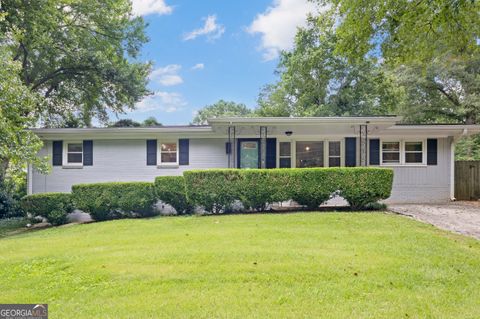
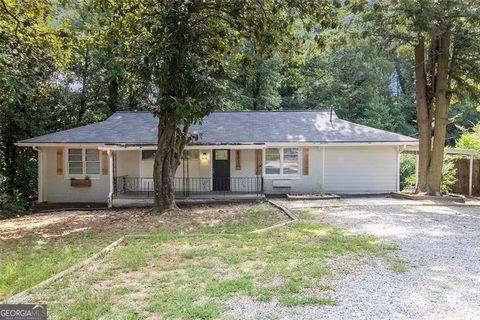
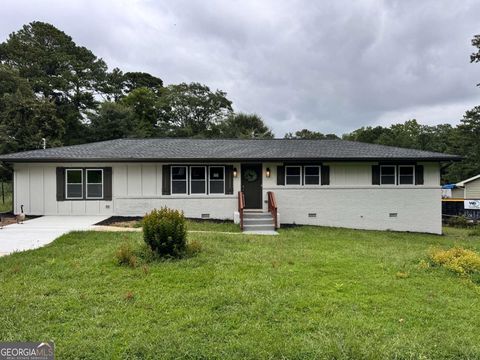
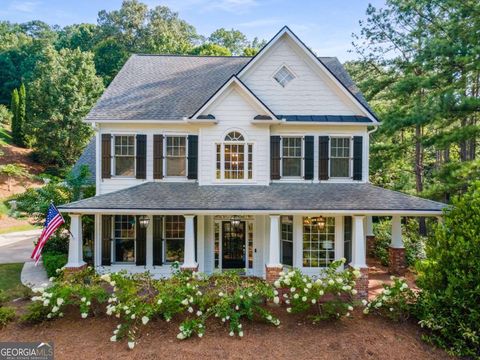
Active
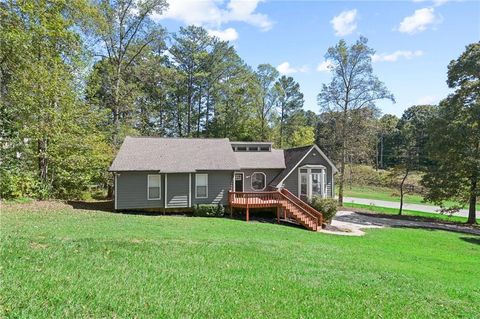
$215,000
3
bds
|
1.5
ba
|
1,152
sqft
|
built
1960
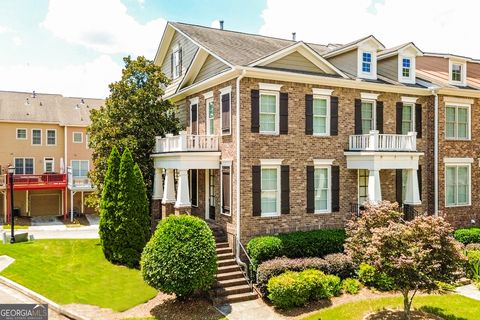
5508 Zanola Dr SW, Mableton, GA 30126
$-104
Cash flow
-2.5%
Cash-on-Cash Return
5.6%
Cap rate
0.8%
Rent to Value Ratio
97 out of 116 properties for sale in Mableton, GA
Limited Results Shown
Create a free account, or log in to reveal all property listings and enjoy the complete experience.
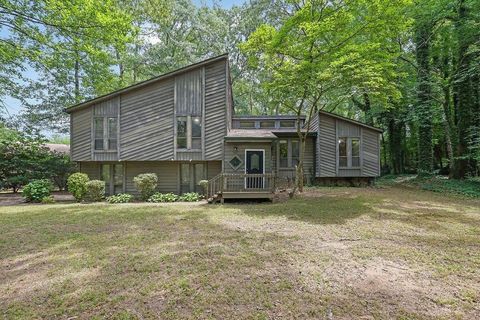
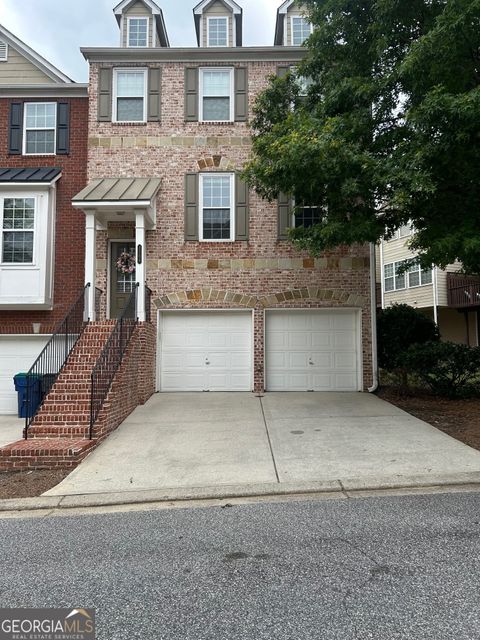
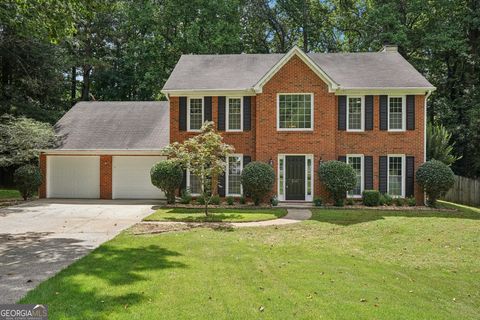
Active
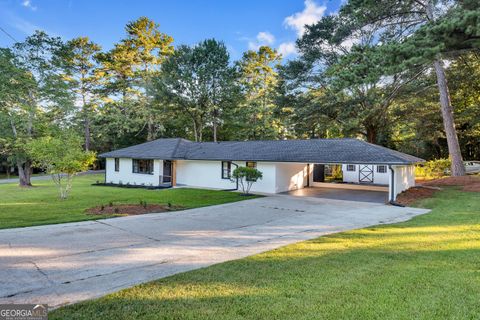
$264,000
3
bds
|
2
ba
|
0
sqft
|
built
1980
361 Gordon Valley Ln SW, Mableton, GA 30126
$-216
Cash flow
-4.3%
Cash-on-Cash Return
5.2%
Cap rate
0.8%
Rent to Value Ratio
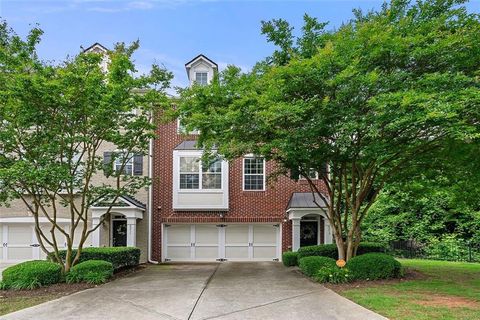
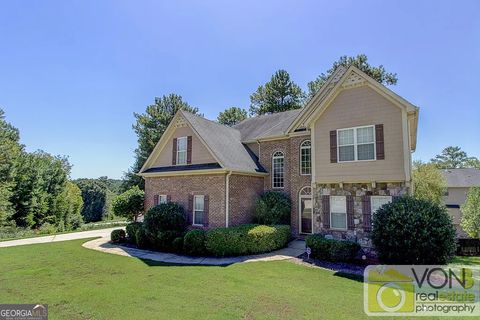
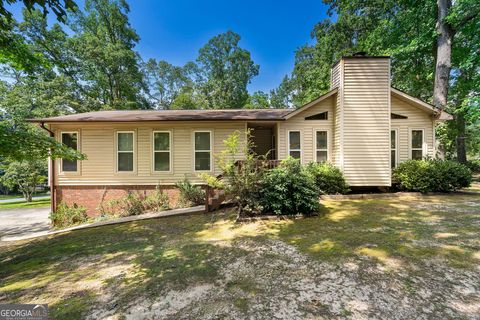
Active
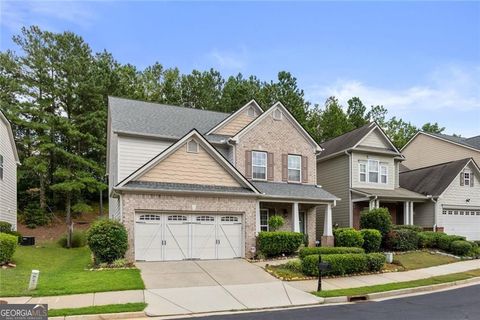
$345,000
3
bds
|
4
ba
|
2,910
sqft
|
built
2005
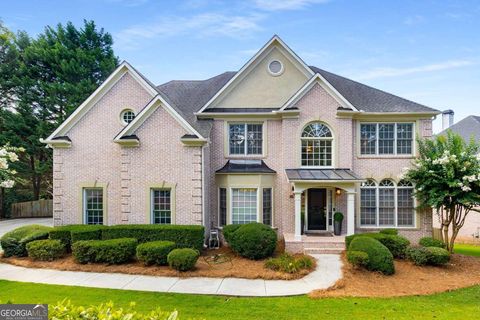
6213 Indian Wood Cir SE, Mableton, GA 30126
$-719
Cash flow
-10.9%
Cash-on-Cash Return
3.6%
Cap rate
0.8%
Rent to Value Ratio
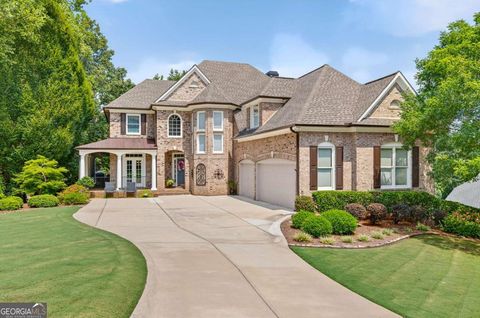
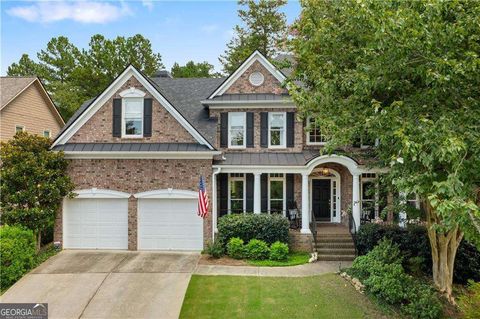
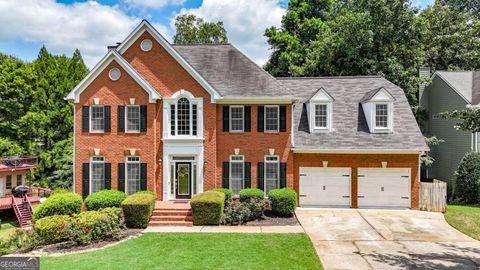
Active
$899,900
4
bds
|
3
ba
|
3,699
sqft
|
built
2003
1255 Grand View Dr SE, Mableton, GA 30126
$-1,798
Cash flow
-10.4%
Cash-on-Cash Return
3.7%
Cap rate
0.5%
Rent to Value Ratio

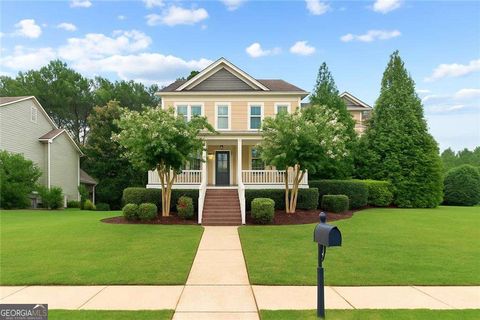
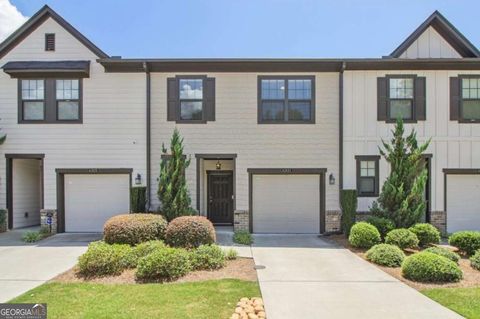
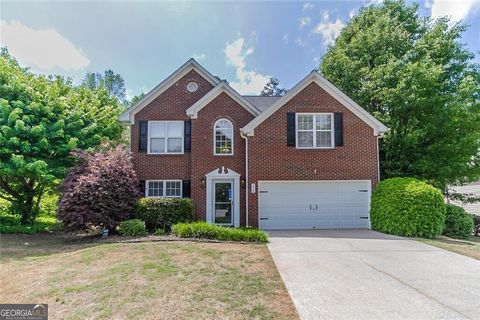
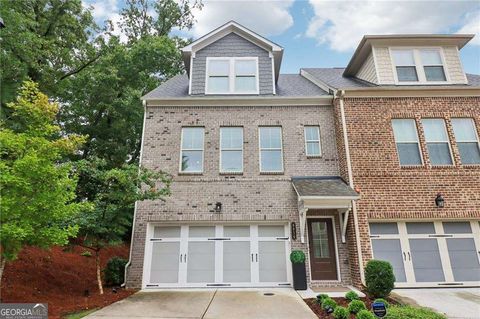
Active
$449,900
4
bds
|
3.5
ba
|
2,294
sqft
|
built
2016
879 Grand Weston Way, Mableton, GA 30126
$-1,146
Cash flow
-13.3%
Cash-on-Cash Return
3.1%
Cap rate
0.6%
Rent to Value Ratio
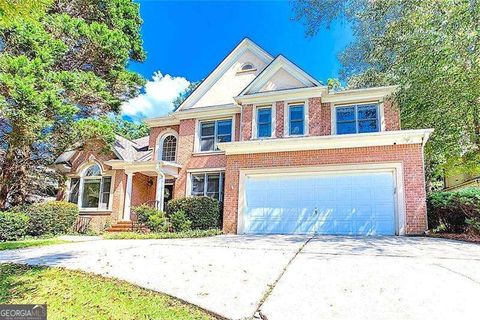
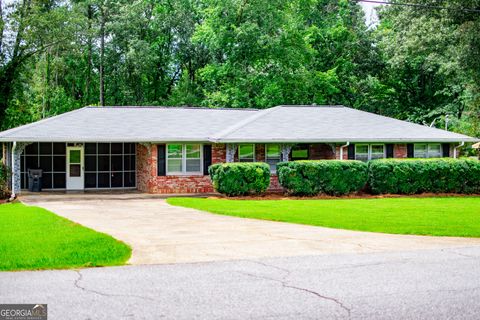
Active
$355,000
3
bds
|
2
ba
|
1,728
sqft
|
built
1961
70 Driskell Ave SW, Mableton, GA 30126
$-386
Cash flow
-5.7%
Cash-on-Cash Return
4.8%
Cap rate
0.7%
Rent to Value Ratio
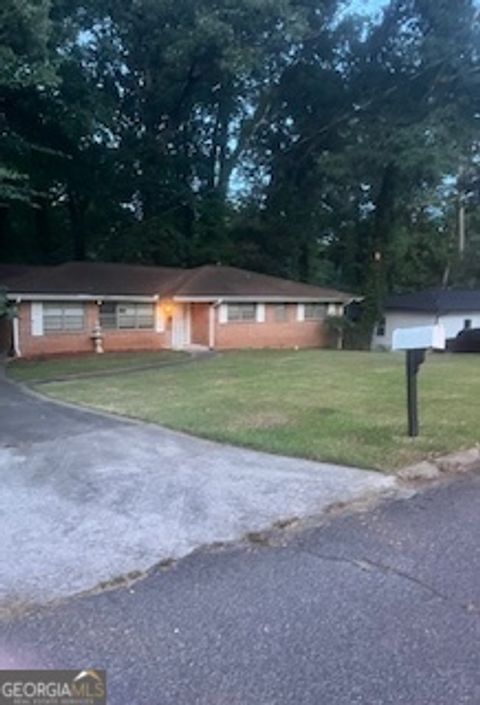
Active
$619,000
5
bds
|
4
ba
|
3,190
sqft
|
built
2010
6415 Century Park Pl SE, Mableton, GA 30126
$-1,423
Cash flow
-12.0%
Cash-on-Cash Return
3.4%
Cap rate
0.6%
Rent to Value Ratio
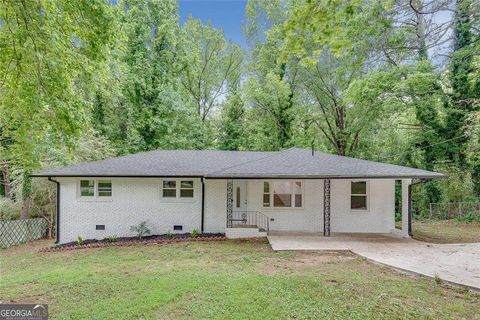
Active
$350,000
4
bds
|
3
ba
|
1,504
sqft
|
built
1962
870 Orris Ln SW, Mableton, GA 30126
$-781
Cash flow
-11.6%
Cash-on-Cash Return
3.5%
Cap rate
0.5%
Rent to Value Ratio
Active
$857,500
5
bds
|
4.5
ba
|
4,330
sqft
|
built
2002
5377 Windsor Green Ct SE, Mableton, GA 30126
$-2,567
Cash flow
-15.6%
Cash-on-Cash Return
2.6%
Cap rate
0.4%
Rent to Value Ratio
Active
$300,000
3
bds
|
2.5
ba
|
1,496
sqft
|
built
2018
6321 Mountain Home Way SE, Mableton, GA 30126
$-562
Cash flow
-9.8%
Cash-on-Cash Return
3.9%
Cap rate
0.7%
Rent to Value Ratio
Active
$740,000
5
bds
|
4
ba
|
0
sqft
|
built
1999
5071 Vinings Estates Ct SE, Mableton, GA 30126
$-1,657
Cash flow
-11.7%
Cash-on-Cash Return
3.5%
Cap rate
0.5%
Rent to Value Ratio
Active
$320,000
4
bds
|
2
ba
|
1,368
sqft
|
built
1963
6030 Ridge Dr SE, Mableton, GA 30126
$-346
Cash flow
-5.6%
Cash-on-Cash Return
4.8%
Cap rate
0.7%
Rent to Value Ratio
Active
$288,000
5
bds
|
1.5
ba
|
1,903
sqft
|
built
1960
6215 Dodgen Rd SW, Mableton, GA 30126
$-315
Cash flow
-5.7%
Cash-on-Cash Return
4.8%
Cap rate
0.7%
Rent to Value Ratio
Active
$424,900
3
bds
|
2.5
ba
|
1,785
sqft
|
built
2002
5560 Sylvania Dr SE, Mableton, GA 30126
$-895
Cash flow
-11.0%
Cash-on-Cash Return
3.6%
Cap rate
0.6%
Rent to Value Ratio
Active
$315,000
3
bds
|
2
ba
|
1,667
sqft
|
built
1962
1711 Seayes Rd SW, Mableton, GA 30126
$-284
Cash flow
-4.7%
Cash-on-Cash Return
5.1%
Cap rate
0.6%
Rent to Value Ratio
Active
$289,500
3
bds
|
2
ba
|
1,432
sqft
|
built
1963
5527 Andrew Dr SW, Mableton, GA 30126
$-212
Cash flow
-3.8%
Cash-on-Cash Return
5.3%
Cap rate
0.7%
Rent to Value Ratio
Active
$347,500
3
bds
|
2.5
ba
|
1,954
sqft
|
built
2004
1807 Evadale Ct, Mableton, GA 30126
$-587
Cash flow
-8.8%
Cash-on-Cash Return
4.1%
Cap rate
0.7%
Rent to Value Ratio
Active
$349,900
3
bds
|
2
ba
|
1,661
sqft
|
built
1955
5760 Brenda Dr SW, Mableton, GA 30126
$-591
Cash flow
-8.8%
Cash-on-Cash Return
4.1%
Cap rate
0.5%
Rent to Value Ratio
Active
$370,000
3
bds
|
3.5
ba
|
3,100
sqft
|
built
2005
6207 Indian Wood Cir SE, Mableton, GA 30126
$-449
Cash flow
-6.3%
Cash-on-Cash Return
4.7%
Cap rate
0.7%
Rent to Value Ratio
Active
$209,900
3
bds
|
1
ba
|
1,150
sqft
|
built
1960
6006 Blackhawk Trl SE, Mableton, GA 30126
$-210
Cash flow
-5.2%
Cash-on-Cash Return
4.9%
Cap rate
0.7%
Rent to Value Ratio
Active
$354,000
4
bds
|
2.5
ba
|
1,423
sqft
|
built
1962
6090 Heritage Way SE, Mableton, GA 30126
$-400
Cash flow
-5.9%
Cash-on-Cash Return
4.8%
Cap rate
0.7%
Rent to Value Ratio
Active
$339,900
4
bds
|
1.5
ba
|
0
sqft
|
built
1959
5981 Pisgah Rd SW, Mableton, GA 30126
$-642
Cash flow
-9.9%
Cash-on-Cash Return
3.9%
Cap rate
0.5%
Rent to Value Ratio
Active
$425,990
3
bds
|
0
ba
|
0
sqft
|
built
2005
2206 Concordia Way SE, Mableton, GA 30126
$-1,112
Cash flow
-13.6%
Cash-on-Cash Return
3.0%
Cap rate
0.6%
Rent to Value Ratio
Active
$493,000
5
bds
|
3.5
ba
|
3,314
sqft
|
built
2003
5977 Rosie Ln SE, Mableton, GA 30126
$-868
Cash flow
-9.2%
Cash-on-Cash Return
4.0%
Cap rate
0.6%
Rent to Value Ratio
Active
$595,000
4
bds
|
2.5
ba
|
4,280
sqft
|
built
1994
5344 Saint Martins Ct SE, Mableton, GA 30126
$-1,397
Cash flow
-12.2%
Cash-on-Cash Return
3.3%
Cap rate
0.5%
Rent to Value Ratio
Active
$400,000
3
bds
|
3.5
ba
|
0
sqft
|
built
2020
6616 Brooklyn Ct SE, Mableton, GA 30126
$-597
Cash flow
-7.8%
Cash-on-Cash Return
4.4%
Cap rate
0.7%
Rent to Value Ratio
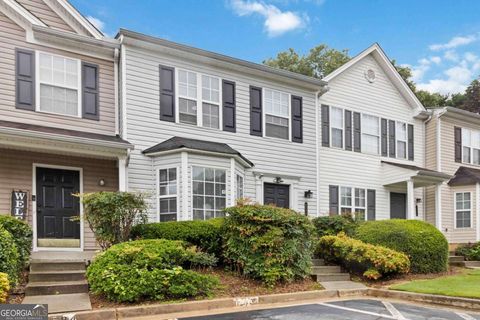
Active
$219,000
2
bds
|
2.5
ba
|
1,392
sqft
|
built
2003
6584 Arbor Gate Dr SW, Mableton, GA 30126
$-454
Cash flow
-10.8%
Cash-on-Cash Return
3.7%
Cap rate
0.7%
Rent to Value Ratio
Active
$265,000
2
bds
|
1
ba
|
1,351
sqft
|
built
1956
6361 Dodgen Rd SW, Mableton, GA 30126
$-148
Cash flow
-2.9%
Cash-on-Cash Return
5.5%
Cap rate
0.7%
Rent to Value Ratio
Active
$299,000
2
bds
|
1
ba
|
1,204
sqft
|
built
1977
4724 Warrior Way SE, Mableton, GA 30126
$-418
Cash flow
-7.3%
Cash-on-Cash Return
4.5%
Cap rate
0.7%
Rent to Value Ratio
Active
$490,000
4
bds
|
3
ba
|
0
sqft
|
built
1987
4909 Millen Dr SE, Mableton, GA 30126
$-1,194
Cash flow
-12.7%
Cash-on-Cash Return
3.2%
Cap rate
0.5%
Rent to Value Ratio
Active
$350,000
4
bds
|
2
ba
|
1,626
sqft
|
built
1956
522 Elizabeth Ln SW, Mableton, GA 30126
$-732
Cash flow
-10.9%
Cash-on-Cash Return
3.6%
Cap rate
0.5%
Rent to Value Ratio
Active
$485,000
4
bds
|
2.5
ba
|
2,528
sqft
|
built
2007
5835 Cobblestone Creek Cir, Mableton, GA 30126
$-962
Cash flow
-10.3%
Cash-on-Cash Return
3.8%
Cap rate
0.6%
Rent to Value Ratio
Active
$314,999
3
bds
|
2
ba
|
960
sqft
|
built
1958
5205 Silhouette Ln SW, Mableton, GA 30126
$-641
Cash flow
-10.6%
Cash-on-Cash Return
3.7%
Cap rate
0.5%
Rent to Value Ratio
Active
$700,000
5
bds
|
4
ba
|
0
sqft
|
built
2002
550 Vinings Springs Dr SE, Mableton, GA 30126
$-1,599
Cash flow
-11.9%
Cash-on-Cash Return
3.4%
Cap rate
0.5%
Rent to Value Ratio
Active
$415,000
3
bds
|
2.5
ba
|
0
sqft
|
built
1989
1047 Retner Dr SW, Mableton, GA 30126
$-848
Cash flow
-10.7%
Cash-on-Cash Return
3.7%
Cap rate
0.6%
Rent to Value Ratio
Active
$340,000
3
bds
|
2
ba
|
1,427
sqft
|
built
1978
6650 Valley Hill Dr SW, Mableton, GA 30126
$-384
Cash flow
-5.9%
Cash-on-Cash Return
4.8%
Cap rate
0.7%
Rent to Value Ratio
Active
$439,000
4
bds
|
2.5
ba
|
0
sqft
|
built
1985
26 Flint Ridge Dr SE, Mableton, GA 30126
$-413
Cash flow
-4.9%
Cash-on-Cash Return
5.0%
Cap rate
0.6%
Rent to Value Ratio
Active
$365,000
3
bds
|
3.5
ba
|
2,040
sqft
|
built
2005
6386 Queens Court Trce, Mableton, GA 30126
$-932
Cash flow
-13.3%
Cash-on-Cash Return
3.1%
Cap rate
0.7%
Rent to Value Ratio
Active
$799,900
6
bds
|
4.5
ba
|
0
sqft
|
built
2001
476 Cooper Lake Rd SE, Mableton, GA 30126
$-2,154
Cash flow
-14.0%
Cash-on-Cash Return
2.9%
Cap rate
0.5%
Rent to Value Ratio