Marblehead, MA Investment Properties for Sale
Browse homes for sale and investment properties in Marblehead, MA. Refine your search by price, property type, or more.
Best cash flowing properties in Marblehead, MA
Active
$335,000
1
bds
|
1
ba
|
715
sqft
|
built
1900
148-150 Pleasant St, Marblehead, MA 01945
$-243
Cash flow
-3.8%
Cash-on-Cash Return
4.8%
Cap rate
0.7%
Rent to Value Ratio

Active
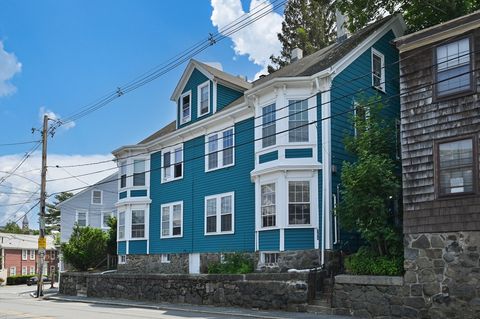
$699,000
3
bds
|
3
ba
|
1,613
sqft
|
built
2018
105 Green St, Marblehead, MA 01945
$-1,145
Cash flow
-8.5%
Cash-on-Cash Return
3.7%
Cap rate
0.6%
Rent to Value Ratio
16 out of 22 properties for sale in Marblehead, MA
Limited Results Shown
Create a free account, or log in to reveal all property listings and enjoy the complete experience.

Active
$2,650,000
5
bds
|
4
ba
|
2,736
sqft
|
built
1900
4 Ballast Ln, Marblehead, MA 01945
$-9,322
Cash flow
-18.4%
Cash-on-Cash Return
1.5%
Cap rate
0.2%
Rent to Value Ratio

Active
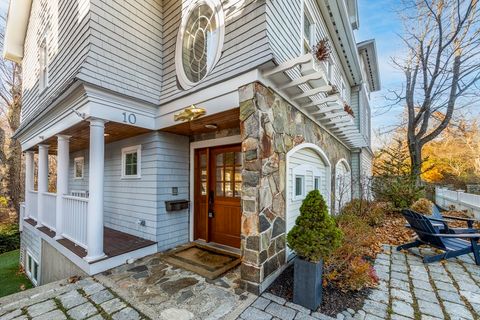
$795,000
5
bds
|
2
ba
|
1,957
sqft
|
built
1936
10 Shepard St, Marblehead, MA 01945
$-1,495
Cash flow
-9.8%
Cash-on-Cash Return
3.4%
Cap rate
0.5%
Rent to Value Ratio

Active
$1,060,000
3
bds
|
3
ba
|
2,243
sqft
|
built
1951
4 Miles Standish Rd, Marblehead, MA 01945
$-2,279
Cash flow
-11.2%
Cash-on-Cash Return
3.1%
Cap rate
0.5%
Rent to Value Ratio
Active
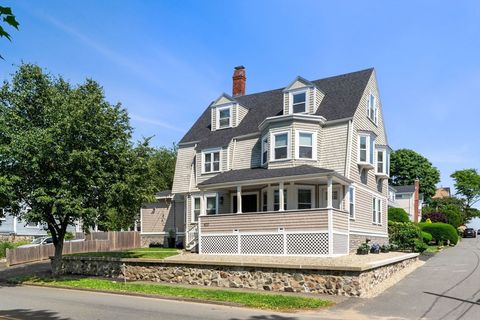
$895,000
3
bds
|
2
ba
|
1,985
sqft
|
built
1951
27 May St, Marblehead, MA 01945
$-2,042
Cash flow
-11.9%
Cash-on-Cash Return
2.9%
Cap rate
0.5%
Rent to Value Ratio

Active
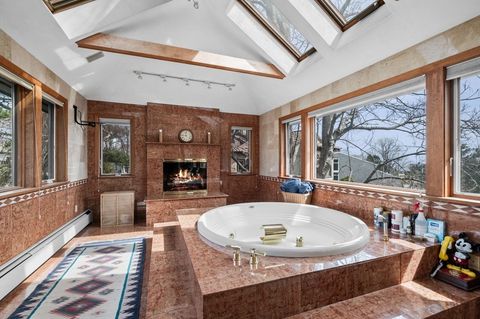
$1,195,000
4
bds
|
3
ba
|
2,600
sqft
|
built
1935
139 Jersey St, Marblehead, MA 01945
$-2,144
Cash flow
-9.4%
Cash-on-Cash Return
3.5%
Cap rate
0.5%
Rent to Value Ratio

Active
$3,200,000
7
bds
|
5
ba
|
5,306
sqft
|
built
1880
372 Ocean Ave, Marblehead, MA 01945
$-11,049
Cash flow
-18.0%
Cash-on-Cash Return
1.5%
Cap rate
0.3%
Rent to Value Ratio

Active
$999,900
1
bds
|
2
ba
|
1,130
sqft
|
built
1948
24 Lee St, Marblehead, MA 01945
$-4,378
Cash flow
-22.8%
Cash-on-Cash Return
0.4%
Cap rate
0.4%
Rent to Value Ratio
Active
$1,625,000
5
bds
|
4
ba
|
3,008
sqft
|
built
2002
10 Risley Rd, Marblehead, MA 01945
$-4,046
Cash flow
-13.0%
Cash-on-Cash Return
2.7%
Cap rate
0.4%
Rent to Value Ratio
Active
$1,450,000
4
bds
|
4
ba
|
3,377
sqft
|
built
1920
420 Atlantic Ave, Marblehead, MA 01945
$-1,342
Cash flow
-4.8%
Cash-on-Cash Return
4.6%
Cap rate
0.6%
Rent to Value Ratio

Active
$1,776,000
4
bds
|
4
ba
|
3,107
sqft
|
built
1721
6 Lee St, Marblehead, MA 01945
$-4,862
Cash flow
-14.3%
Cash-on-Cash Return
2.4%
Cap rate
0.4%
Rent to Value Ratio

Active
$4,995,000
6
bds
|
8
ba
|
7,109
sqft
|
built
1890
358 Ocean Ave, Marblehead, MA 01945
$-20,561
Cash flow
-21.5%
Cash-on-Cash Return
0.7%
Cap rate
0.2%
Rent to Value Ratio
Active
$3,990,000
4
bds
|
6
ba
|
6,241
sqft
|
built
1960
244 Ocean Ave, Marblehead, MA 01945
$-15,969
Cash flow
-20.9%
Cash-on-Cash Return
0.9%
Cap rate
0.2%
Rent to Value Ratio

Active
$18,000,000
5
bds
|
9
ba
|
9,586
sqft
|
built
1999
17 Crowninshield Rd, Marblehead, MA 01945
$-85,956
Cash flow
-24.9%
Cash-on-Cash Return
-0.1%
Cap rate
0.0%
Rent to Value Ratio

Active
$6,900,000
9
bds
|
8
ba
|
9,593
sqft
|
built
1900
4 Broadmere Way, Marblehead, MA 01945
$-31,793
Cash flow
-24.0%
Cash-on-Cash Return
0.1%
Cap rate
0.1%
Rent to Value Ratio