Matteson, IL Investment Properties for Sale
Browse homes for sale and investment properties in Matteson, IL. Refine your search by price, property type, or more.
Best cash flowing properties in Matteson, IL
Active
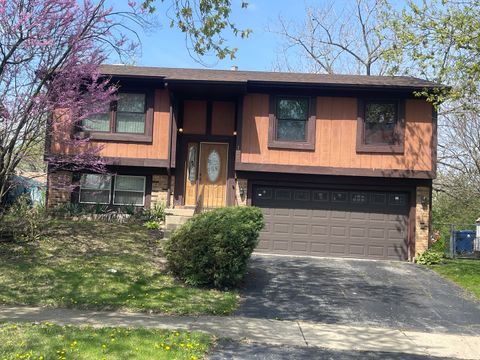
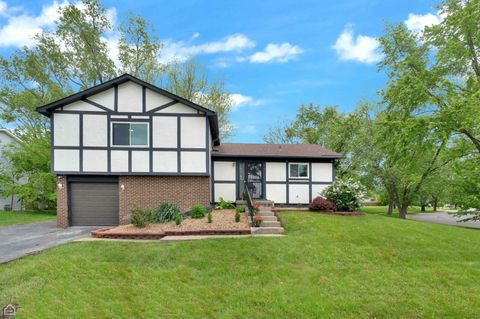
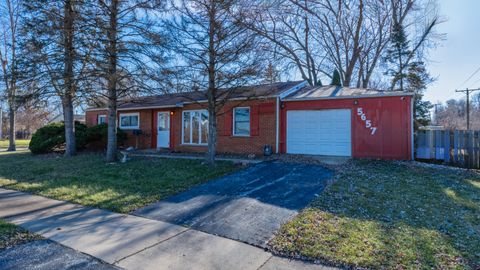
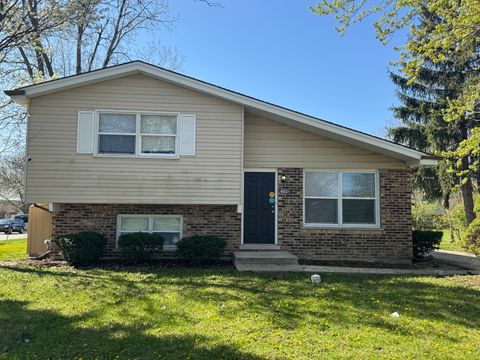
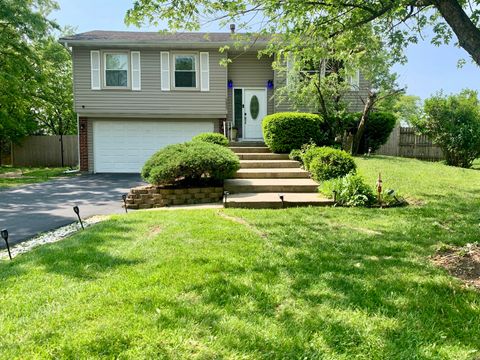
$162,900
3
bds
|
2
ba
|
1,006
sqft
|
built
1974
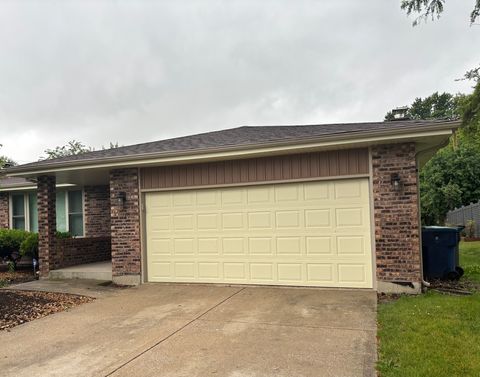
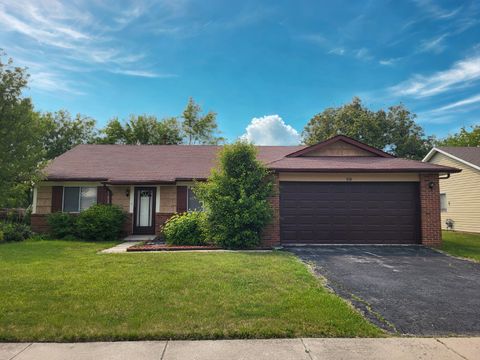
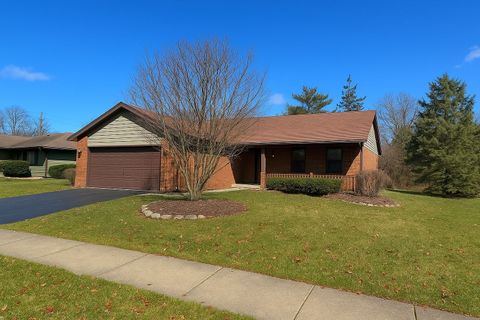
122 Deerpath Rd, Matteson, IL 60443
$470
Cash flow
15.1%
Cash-on-Cash Return
9.1%
Cap rate
1.5%
Rent to Value Ratio
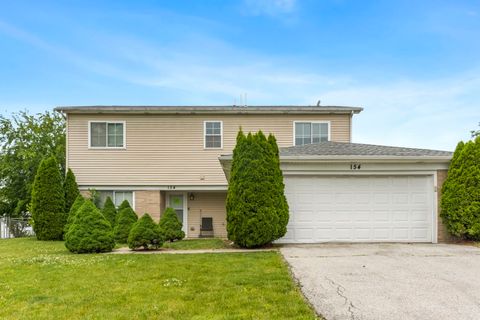
Active
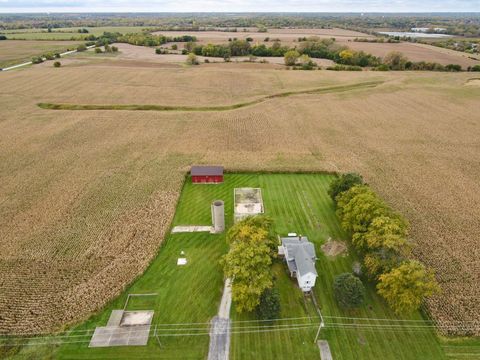
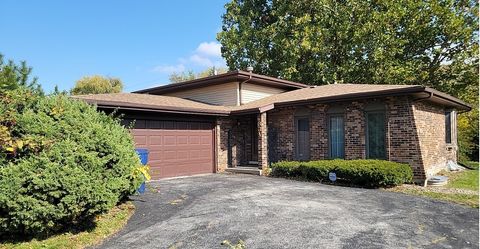
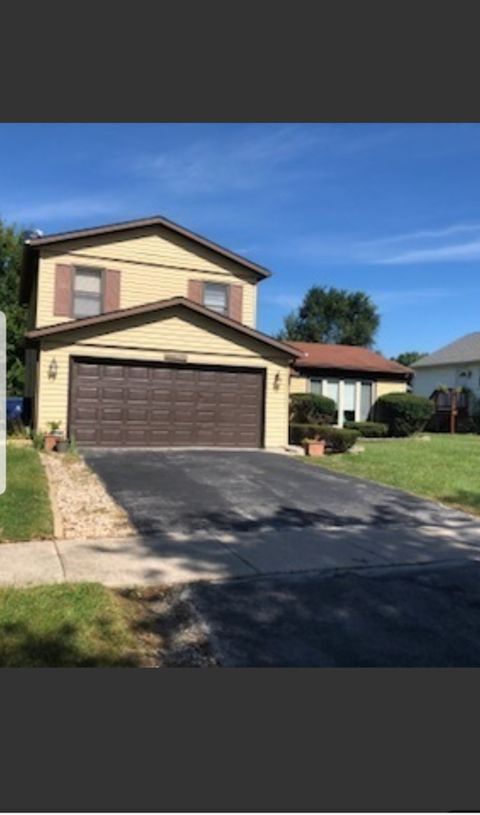
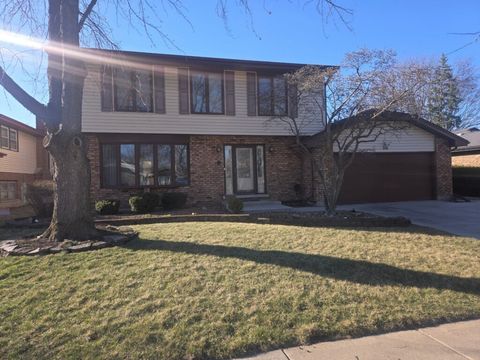
$275,000
4
bds
|
3
ba
|
2,008
sqft
|
built
1978
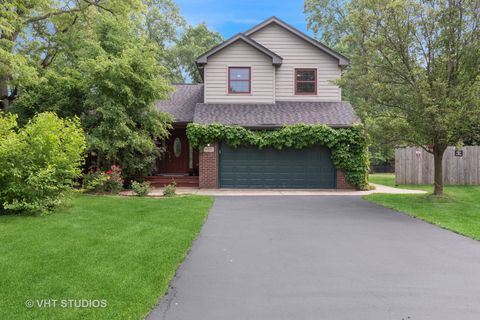
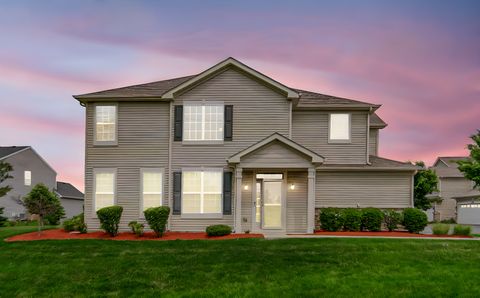
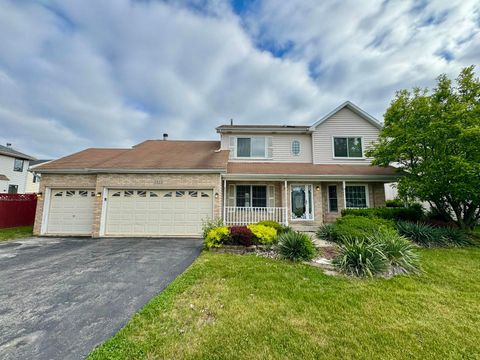
154 Pheasant Rd, Matteson, IL 60443
$349
Cash flow
6.6%
Cash-on-Cash Return
7.2%
Cap rate
1.2%
Rent to Value Ratio
44 out of 48 properties for sale in Matteson, IL
Limited Results Shown
Create a free account, or log in to reveal all property listings and enjoy the complete experience.
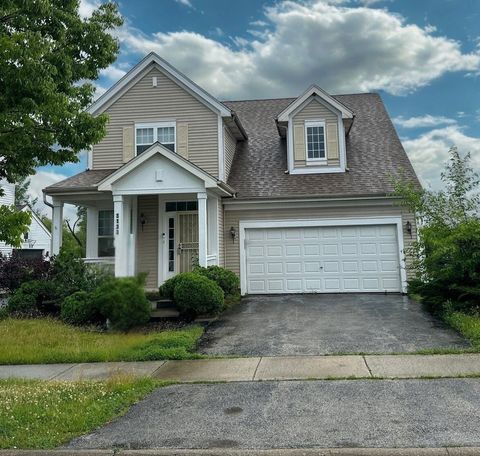
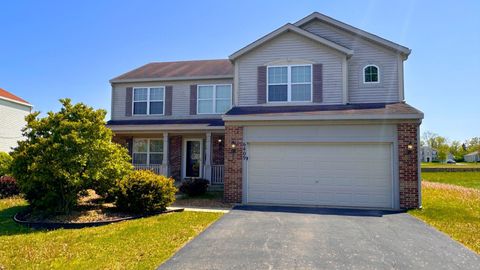
Active
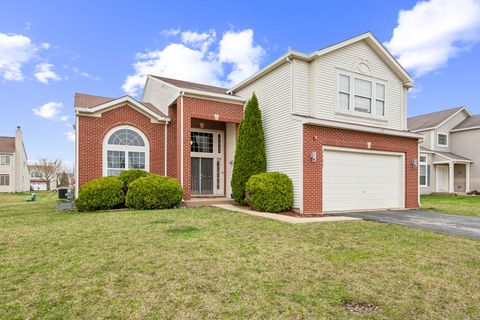
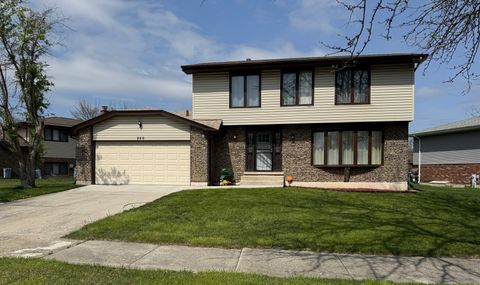
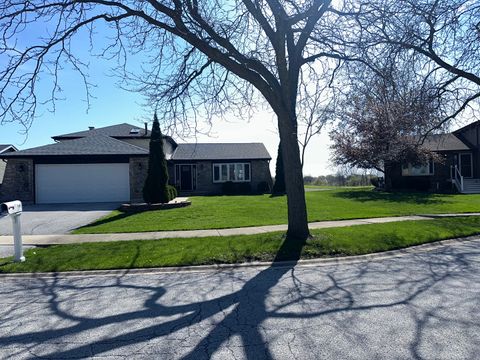
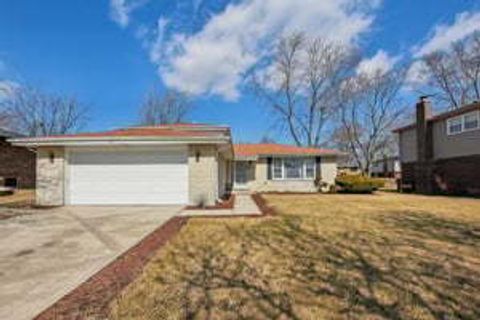
$321,999
4
bds
|
3
ba
|
2,122
sqft
|
built
2001
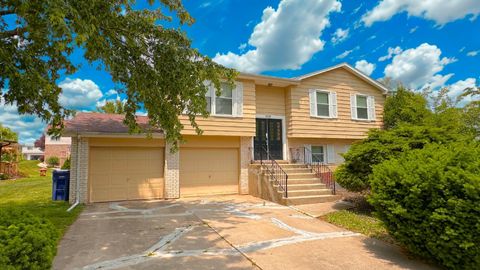
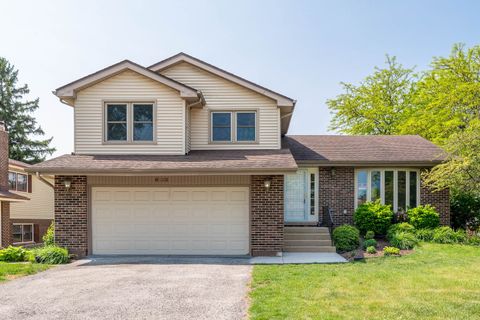
3133 Heritage Blvd, Matteson, IL 60443
$-479
Cash flow
-7.8%
Cash-on-Cash Return
3.9%
Cap rate
0.8%
Rent to Value Ratio
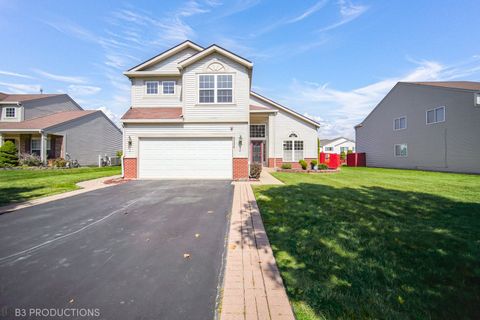
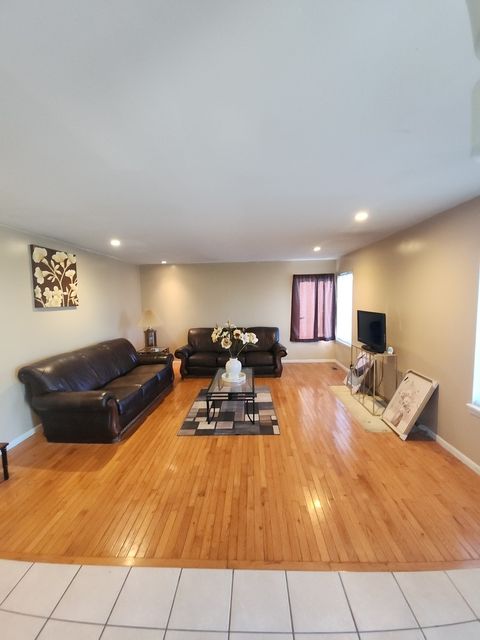
Active
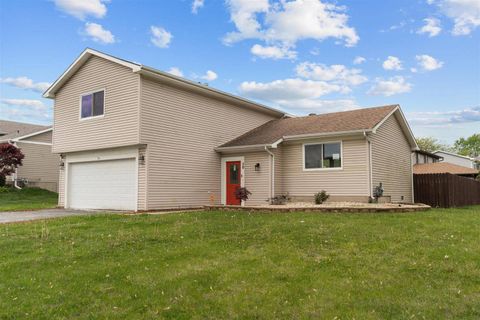
$360,000
4
bds
|
4
ba
|
2,100
sqft
|
built
2005
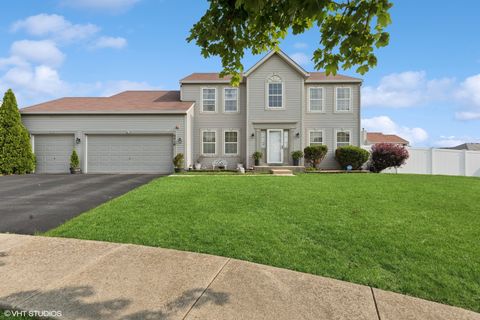
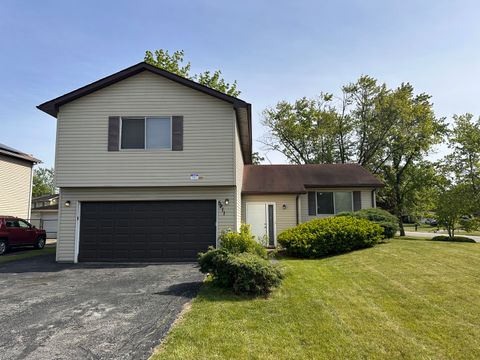
6520 Bridle Path Dr, Matteson, IL 60443
$-484
Cash flow
-7.0%
Cash-on-Cash Return
4.1%
Cap rate
0.9%
Rent to Value Ratio
Active
$249,999
4
bds
|
2
ba
|
1,735
sqft
|
built
1975
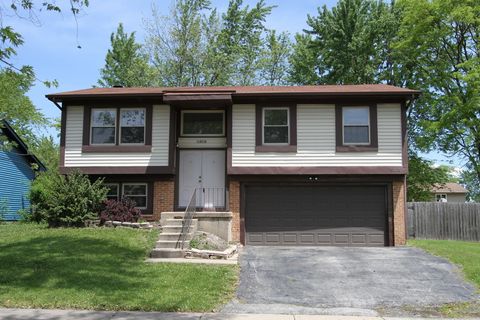
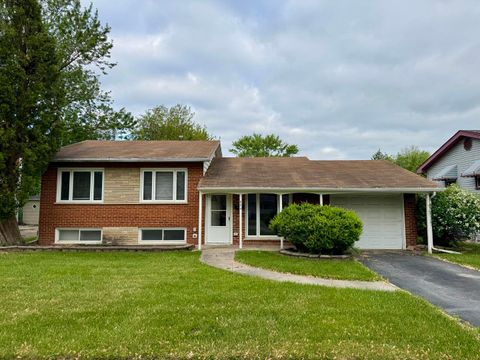
46 Cloverleaf Rd, Matteson, IL 60443
$207
Cash flow
4.3%
Cash-on-Cash Return
6.7%
Cap rate
1.1%
Rent to Value Ratio
Active
$1,629,808
6
bds
|
2
ba
|
1,725
sqft
|
built
1878
22132 Ridgeland Ave, Matteson, IL 60443
$-6,822
Cash flow
-21.8%
Cash-on-Cash Return
1.2%
Cap rate
0.2%
Rent to Value Ratio
Active
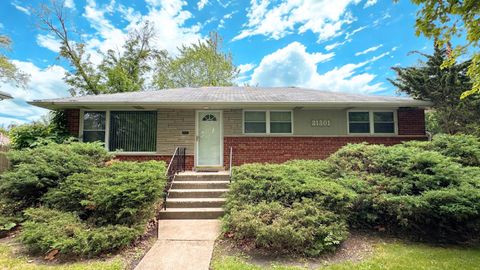
$205,000
3
bds
|
2
ba
|
1,300
sqft
|
built
1958
21301 Tower Ave, Matteson, IL 60443
$164
Cash flow
4.2%
Cash-on-Cash Return
7.2%
Cap rate
1.2%
Rent to Value Ratio
Active
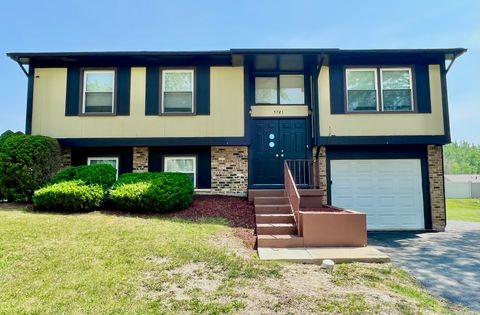
$250,000
3
bds
|
2
ba
|
971
sqft
|
built
1973
5741 Allemong Dr, Matteson, IL 60443
$14
Cash flow
0.3%
Cash-on-Cash Return
5.7%
Cap rate
1.0%
Rent to Value Ratio
Active
$224,000
2
bds
|
2
ba
|
1,025
sqft
|
built
1962
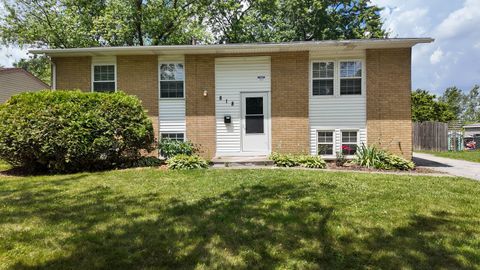
818 Princeton Ave, Matteson, IL 60443
$51
Cash flow
1.2%
Cash-on-Cash Return
6.0%
Cap rate
1.1%
Rent to Value Ratio
Active
$455,000
5
bds
|
3
ba
|
3,148
sqft
|
built
2005
6500 Pasture Side Trl, Matteson, IL 60443
$-763
Cash flow
-8.7%
Cash-on-Cash Return
3.7%
Cap rate
0.8%
Rent to Value Ratio
Active
$259,900
3
bds
|
2
ba
|
1,212
sqft
|
built
1972
5808 Allemong Dr, Matteson, IL 60443
$-127
Cash flow
-2.5%
Cash-on-Cash Return
5.1%
Cap rate
1.0%
Rent to Value Ratio
Active
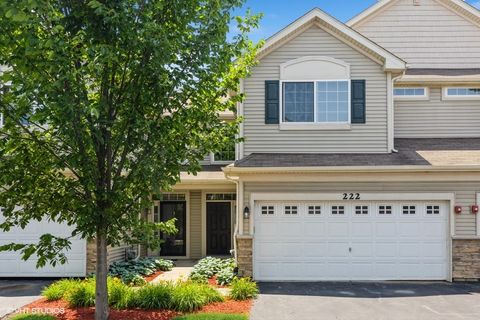
$285,000
2
bds
|
3
ba
|
1,435
sqft
|
built
2016
222 Owen St, Matteson, IL 60443
$-515
Cash flow
-9.4%
Cash-on-Cash Return
3.5%
Cap rate
0.9%
Rent to Value Ratio
Active
$250,000
3
bds
|
2
ba
|
1,698
sqft
|
built
1980
744 Academy Ave, Matteson, IL 60443
$-149
Cash flow
-3.1%
Cash-on-Cash Return
5.5%
Cap rate
1.1%
Rent to Value Ratio
Active
$545,000
3
bds
|
4
ba
|
1,739
sqft
|
built
2005
4335 Dewey Ave, Matteson, IL 60443
$-1,476
Cash flow
-14.1%
Cash-on-Cash Return
2.4%
Cap rate
0.5%
Rent to Value Ratio
Active
$255,000
3
bds
|
2
ba
|
1,097
sqft
|
built
1976
6024 Beechwood Rd, Matteson, IL 60443
$-243
Cash flow
-5.0%
Cash-on-Cash Return
5.1%
Cap rate
1.0%
Rent to Value Ratio
Active
$375,000
4
bds
|
3
ba
|
2,492
sqft
|
built
2005
6416 Pasture Side Trl, Matteson, IL 60443
$-695
Cash flow
-9.7%
Cash-on-Cash Return
3.5%
Cap rate
0.8%
Rent to Value Ratio
Active
$247,000
3
bds
|
2
ba
|
1,356
sqft
|
built
1976
50 Oakhurst Rd, Matteson, IL 60443
$106
Cash flow
2.2%
Cash-on-Cash Return
6.2%
Cap rate
1.1%
Rent to Value Ratio
Active
$299,500
2
bds
|
3
ba
|
1,690
sqft
|
built
2016
192 Owen St, Matteson, IL 60443
$-365
Cash flow
-6.4%
Cash-on-Cash Return
4.2%
Cap rate
0.9%
Rent to Value Ratio
Active
$264,900
3
bds
|
3
ba
|
1,712
sqft
|
built
1984
6133 Elm Ln, Matteson, IL 60443
$-48
Cash flow
-0.9%
Cash-on-Cash Return
5.5%
Cap rate
1.0%
Rent to Value Ratio
Active
$313,000
4
bds
|
3
ba
|
1,776
sqft
|
built
1977
5911 Timberlane Rd, Matteson, IL 60443
$-203
Cash flow
-3.4%
Cash-on-Cash Return
4.9%
Cap rate
0.9%
Rent to Value Ratio
Active
$312,000
4
bds
|
3
ba
|
1,666
sqft
|
built
1978
807 Violet Ln, Matteson, IL 60443
$-354
Cash flow
-5.9%
Cash-on-Cash Return
4.3%
Cap rate
0.9%
Rent to Value Ratio
Active
$360,000
3
bds
|
3
ba
|
1,972
sqft
|
built
1994
5522 Mallard Dr, Matteson, IL 60443
$-705
Cash flow
-10.2%
Cash-on-Cash Return
3.3%
Cap rate
0.8%
Rent to Value Ratio
Active
$228,000
3
bds
|
3
ba
|
1,044
sqft
|
built
1961
824 Dartmouth Ave, Matteson, IL 60443
$70
Cash flow
1.6%
Cash-on-Cash Return
6.0%
Cap rate
1.1%
Rent to Value Ratio

Active
$255,000
3
bds
|
2
ba
|
1,272
sqft
|
built
1976
4156 Sumter Dr, Matteson, IL 60443
$58
Cash flow
1.2%
Cash-on-Cash Return
6.0%
Cap rate
1.0%
Rent to Value Ratio
Active
$257,000
3
bds
|
2
ba
|
1,491
sqft
|
built
1979
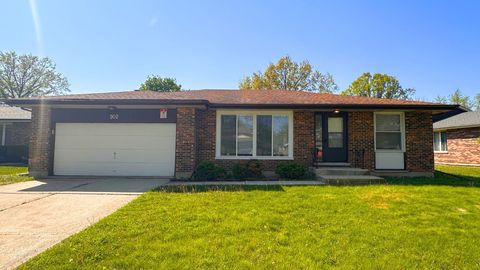
902 School Ave, Matteson, IL 60443
$-214
Cash flow
-4.3%
Cash-on-Cash Return
4.7%
Cap rate
1.0%
Rent to Value Ratio
Active
$390,000
4
bds
|
3
ba
|
2,287
sqft
|
built
2006
6409 Old Plank Blvd, Matteson, IL 60443
$-778
Cash flow
-10.4%
Cash-on-Cash Return
3.3%
Cap rate
0.8%
Rent to Value Ratio
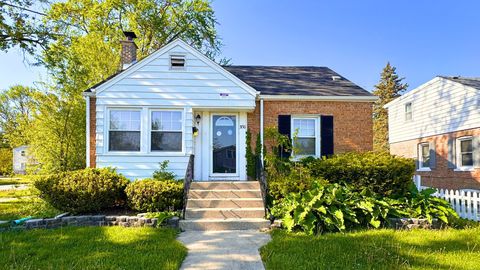
Active
$223,000
3
bds
|
3
ba
|
1,222
sqft
|
built
1950
3736 217th St, Matteson, IL 60443
$73
Cash flow
1.7%
Cash-on-Cash Return
6.1%
Cap rate
1.0%
Rent to Value Ratio
Active
$263,000
3
bds
|
2
ba
|
1,730
sqft
|
built
1977
123 Oriole Rd, Matteson, IL 60443
$-38
Cash flow
-0.8%
Cash-on-Cash Return
5.5%
Cap rate
1.0%
Rent to Value Ratio
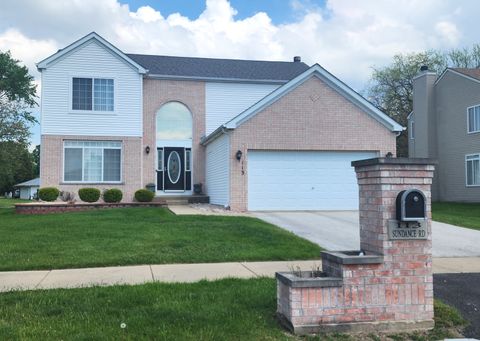
Active
$360,000
3
bds
|
3
ba
|
2,278
sqft
|
built
2001
113 Sundance Rd, Matteson, IL 60443
$-524
Cash flow
-7.6%
Cash-on-Cash Return
3.9%
Cap rate
0.8%
Rent to Value Ratio
Active
$214,000
3
bds
|
2
ba
|
1,300
sqft
|
built
1963
5657 Colgate Ln, Matteson, IL 60443
$90
Cash flow
2.2%
Cash-on-Cash Return
6.2%
Cap rate
1.1%
Rent to Value Ratio
Active
$339,900
3
bds
|
2
ba
|
1,180
sqft
|
built
1976
831 Violet Ln, Matteson, IL 60443
$-619
Cash flow
-9.5%
Cash-on-Cash Return
3.5%
Cap rate
0.7%
Rent to Value Ratio
Active
$295,000
3
bds
|
3
ba
|
1,781
sqft
|
built
1979
850 Campus Ave, Matteson, IL 60443
$-235
Cash flow
-4.2%
Cash-on-Cash Return
4.7%
Cap rate
0.9%
Rent to Value Ratio
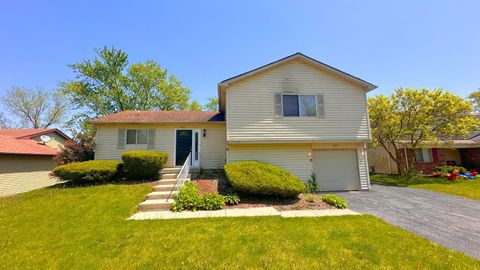
Active
$294,900
4
bds
|
3
ba
|
1,868
sqft
|
built
1980
50 Wedgewood Rd, Matteson, IL 60443
$17
Cash flow
0.3%
Cash-on-Cash Return
5.7%
Cap rate
1.1%
Rent to Value Ratio
Active
$232,000
3
bds
|
2
ba
|
1,168
sqft
|
built
1973
6021 Spring Ln, Matteson, IL 60443
$-67
Cash flow
-1.5%
Cash-on-Cash Return
5.3%
Cap rate
1.1%
Rent to Value Ratio
Active
$215,000
3
bds
|
2
ba
|
1,551
sqft
|
built
1978
5326 Yale Ln, Matteson, IL 60443
$86
Cash flow
2.1%
Cash-on-Cash Return
6.2%
Cap rate
1.2%
Rent to Value Ratio
Active
$254,300
4
bds
|
3
ba
|
1,290
sqft
|
built
1988
749 Old Meadow Rd, Matteson, IL 60443
$-151
Cash flow
-3.1%
Cash-on-Cash Return
5.5%
Cap rate
1.1%
Rent to Value Ratio
Active
$350,000
4
bds
|
3
ba
|
2,309
sqft
|
built
1999
136 Moonlight Rd, Matteson, IL 60443
$-670
Cash flow
-10.0%
Cash-on-Cash Return
3.4%
Cap rate
0.8%
Rent to Value Ratio
Active
$295,000
3
bds
|
2
ba
|
1,500
sqft
|
built
1972
5621 Fernwood Ct, Matteson, IL 60443
$-40
Cash flow
-0.7%
Cash-on-Cash Return
5.5%
Cap rate
0.9%
Rent to Value Ratio
Active
$325,000
4
bds
|
4
ba
|
1,960
sqft
|
built
1978
916 College Ave, Matteson, IL 60443
$171
Cash flow
2.7%
Cash-on-Cash Return
6.3%
Cap rate
0.9%
Rent to Value Ratio
Active
$255,000
3
bds
|
2
ba
|
1,307
sqft
|
built
1978
6260 Sunflower Dr, Matteson, IL 60443
$-208
Cash flow
-4.3%
Cash-on-Cash Return
4.7%
Cap rate
1.0%
Rent to Value Ratio