Medford, MA Investment Properties for Sale
Browse homes for sale and investment properties in Medford, MA. Refine your search by price, property type, or more.
Best cash flowing properties in Medford, MA
Active
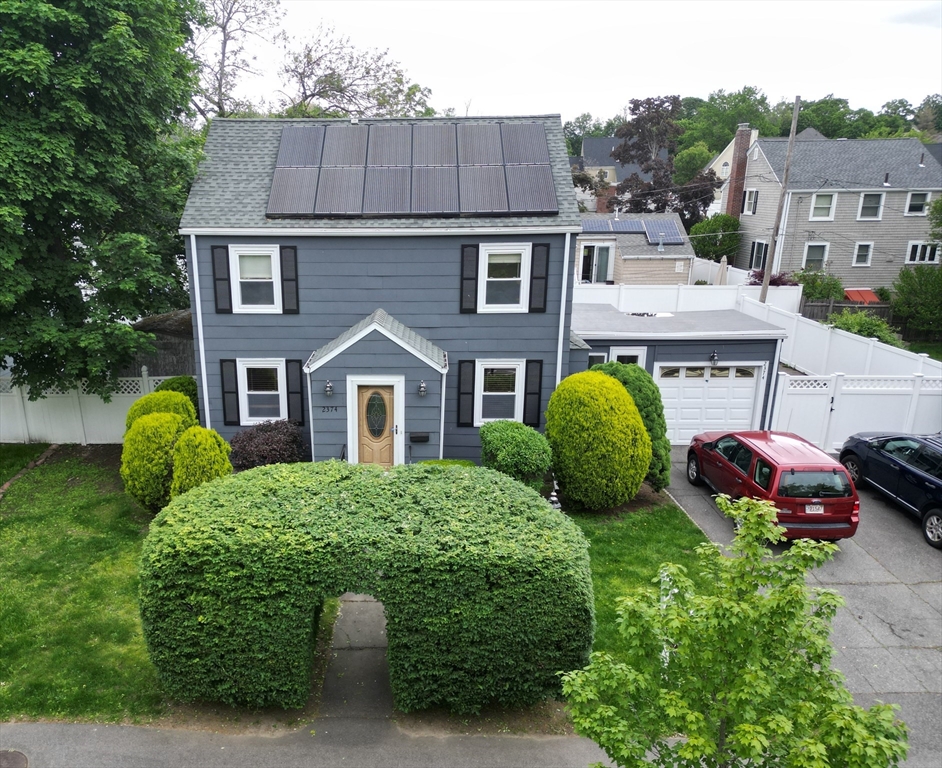
$719,000
3
bds
|
2
ba
|
1,262
sqft
|
built
1950
2374 Mystic Valley Pkwy, Medford, MA 02155
$-1,069
Cash flow
-7.8%
Cash-on-Cash Return
3.9%
Cap rate
0.6%
Rent to Value Ratio
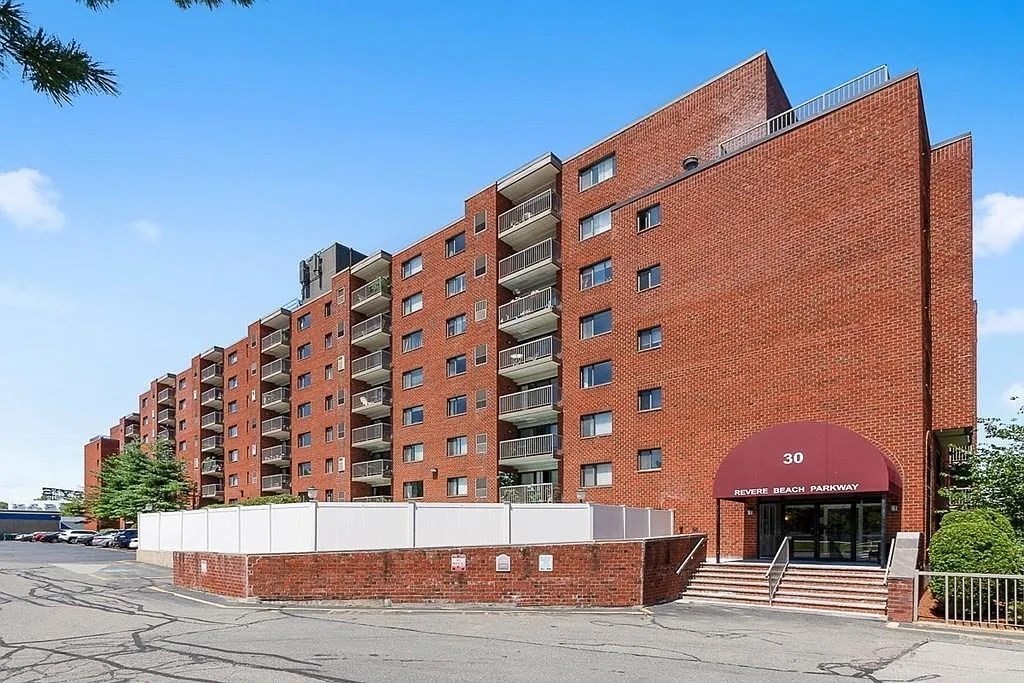
Active
$459,900
1
bds
|
1
ba
|
844
sqft
|
built
1987
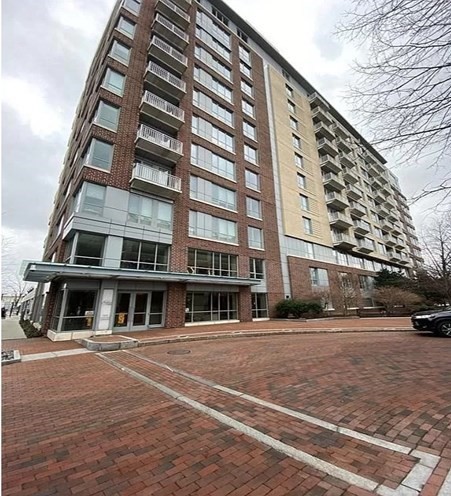
30 Revere Beach Pkwy, Medford, MA 02155
$-1,114
Cash flow
-12.6%
Cash-on-Cash Return
2.8%
Cap rate
0.5%
Rent to Value Ratio
45 out of 69 properties for sale in Medford, MA
Limited Results Shown
Create a free account, or log in to reveal all property listings and enjoy the complete experience.
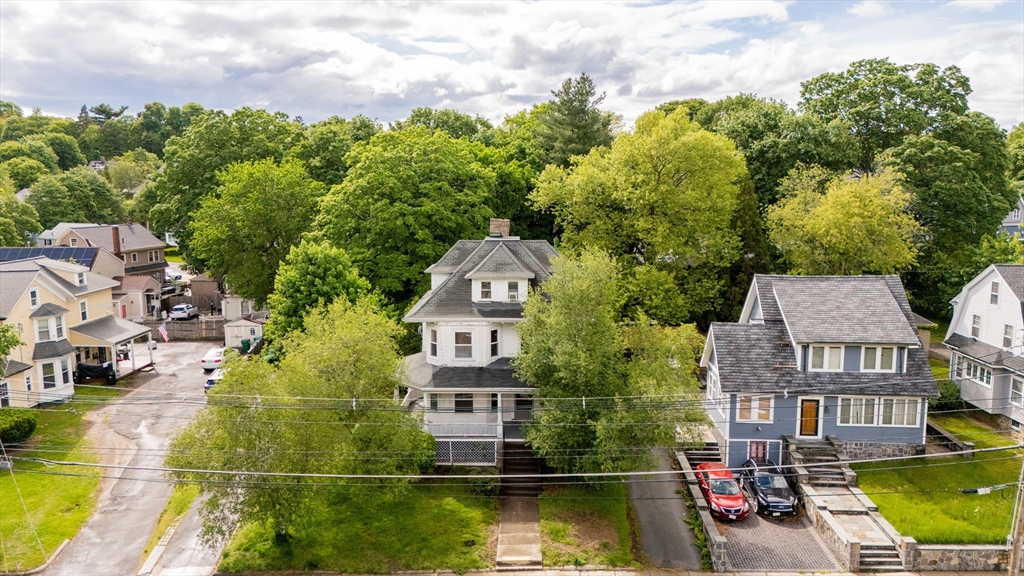
Active
$1,399,000
6
bds
|
4
ba
|
3,797
sqft
|
built
1920
124 Forest St, Medford, MA 02155
$-4,677
Cash flow
-17.4%
Cash-on-Cash Return
1.7%
Cap rate
0.3%
Rent to Value Ratio
Active
$719,000
3
bds
|
2
ba
|
1,262
sqft
|
built
1950
2374 Mystic Valley Pkwy, Medford, MA 02155
$-1,069
Cash flow
-7.8%
Cash-on-Cash Return
3.9%
Cap rate
0.6%
Rent to Value Ratio
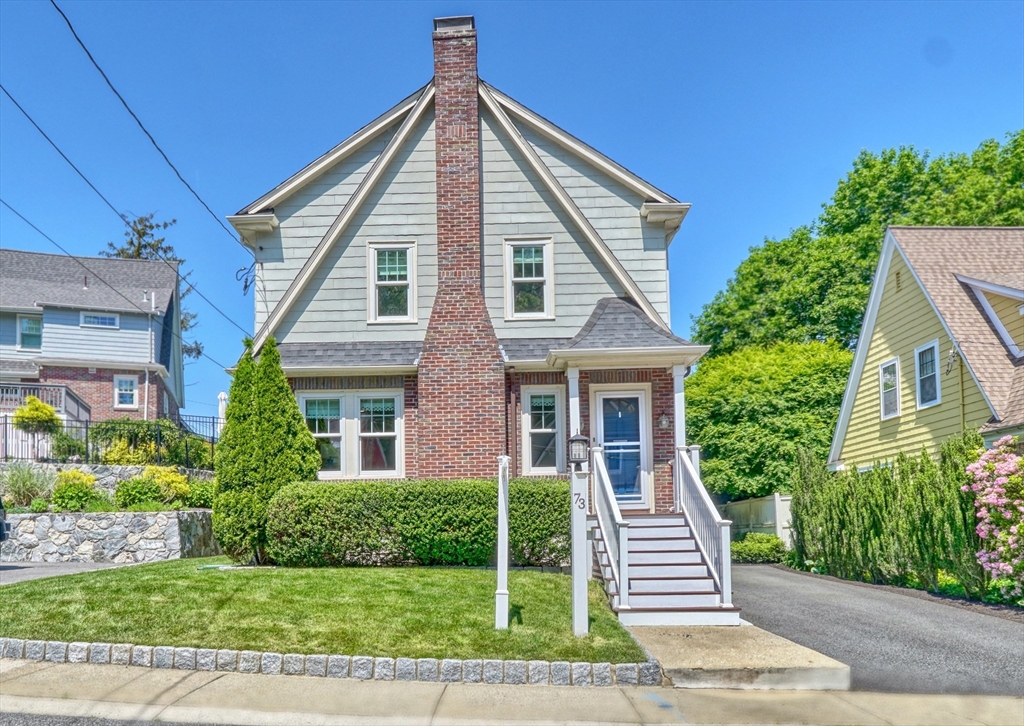
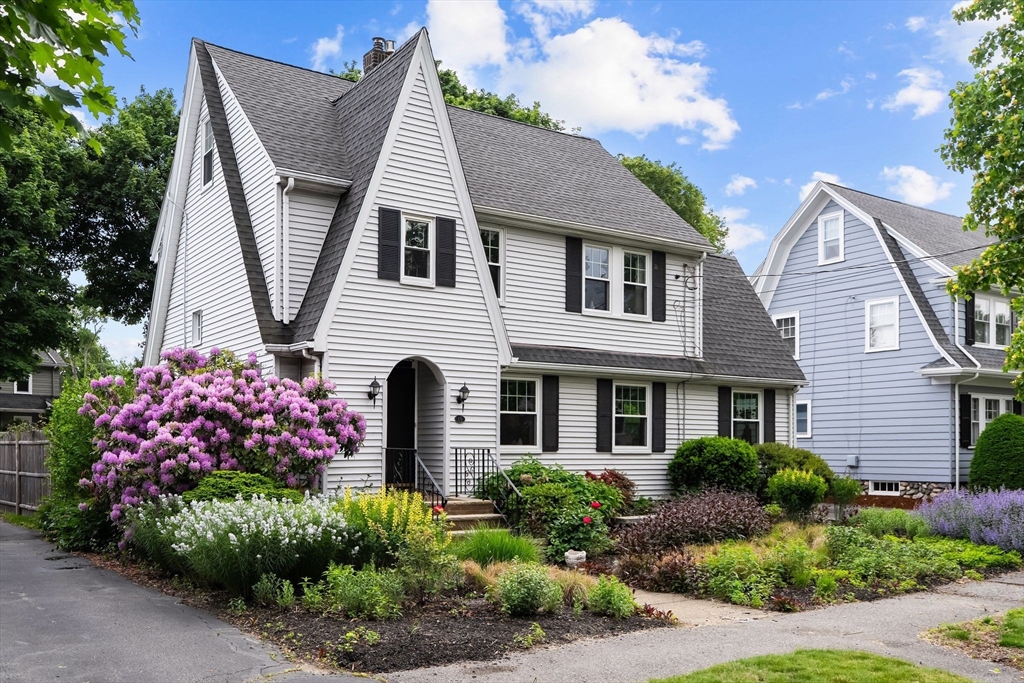
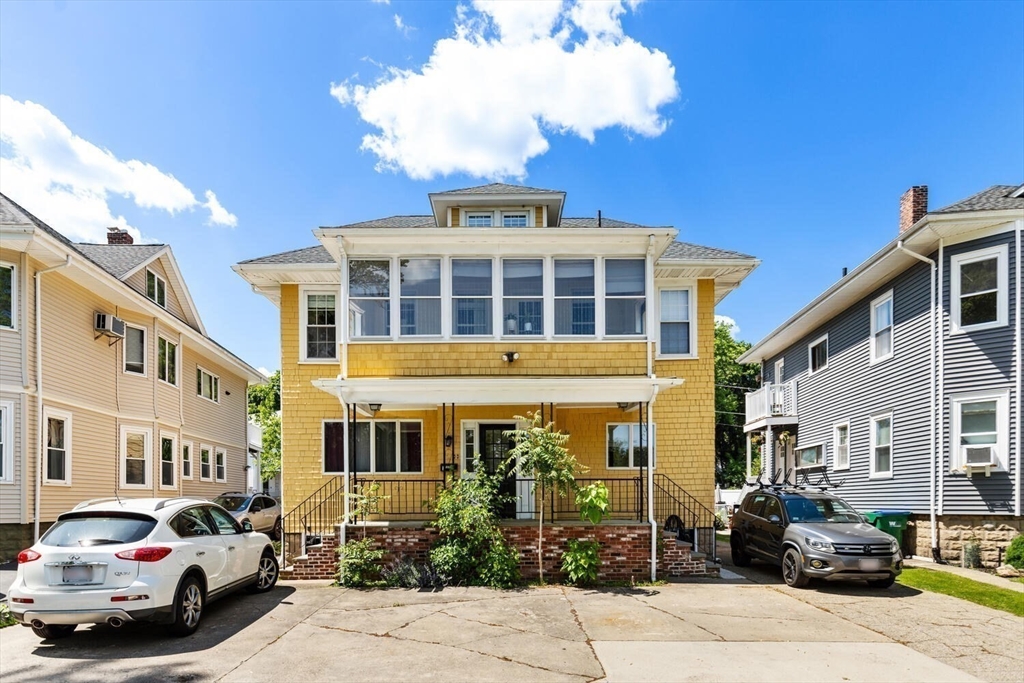
Active
$849,000
3
bds
|
2
ba
|
2,273
sqft
|
built
1925
73 Cedar Rd, Medford, MA 02155
$-1,129
Cash flow
-6.9%
Cash-on-Cash Return
4.1%
Cap rate
0.6%
Rent to Value Ratio
Active
$459,900
1
bds
|
1
ba
|
844
sqft
|
built
1987
30 Revere Beach Pkwy, Medford, MA 02155
$-1,114
Cash flow
-12.6%
Cash-on-Cash Return
2.8%
Cap rate
0.5%
Rent to Value Ratio
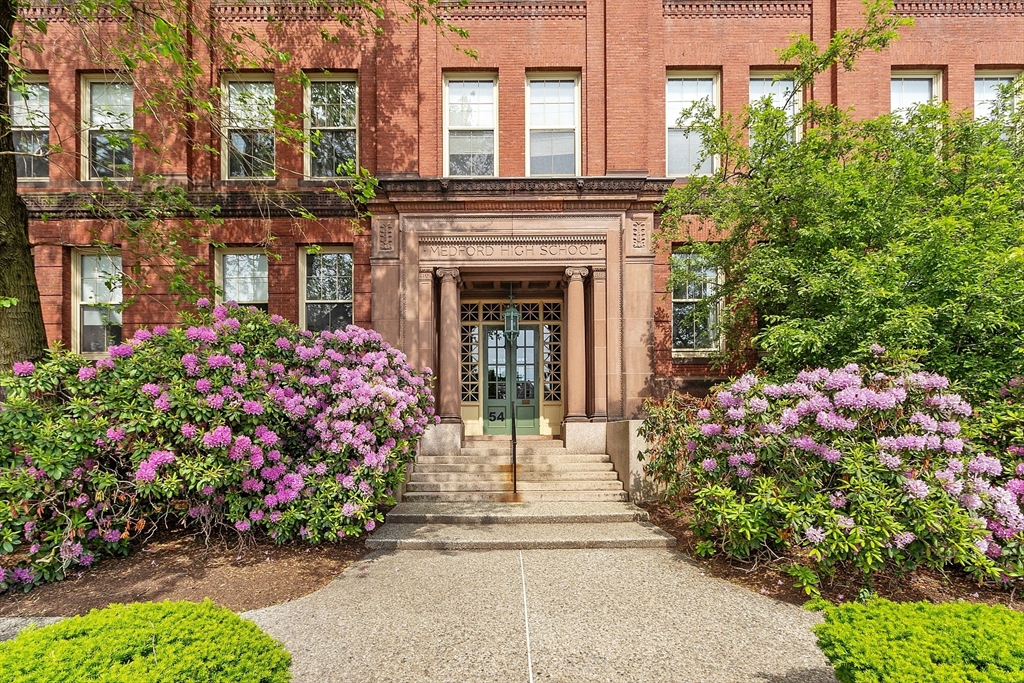
Active
$512,500
1
bds
|
1
ba
|
767
sqft
|
built
1890
54 Forest St, Medford, MA 02155
$-1,745
Cash flow
-17.8%
Cash-on-Cash Return
1.6%
Cap rate
0.4%
Rent to Value Ratio
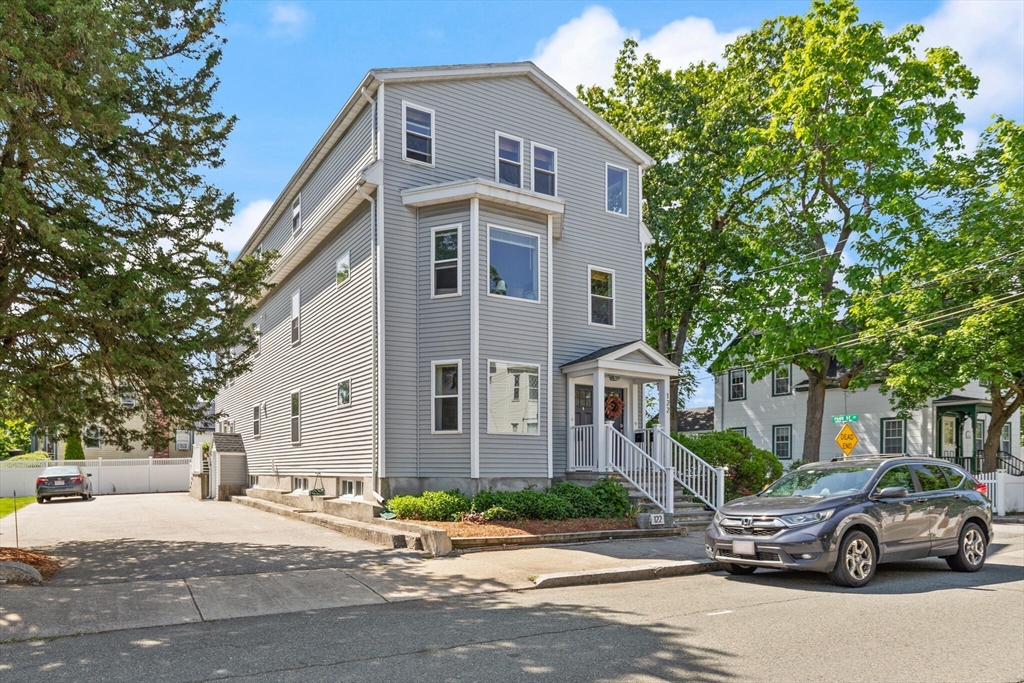
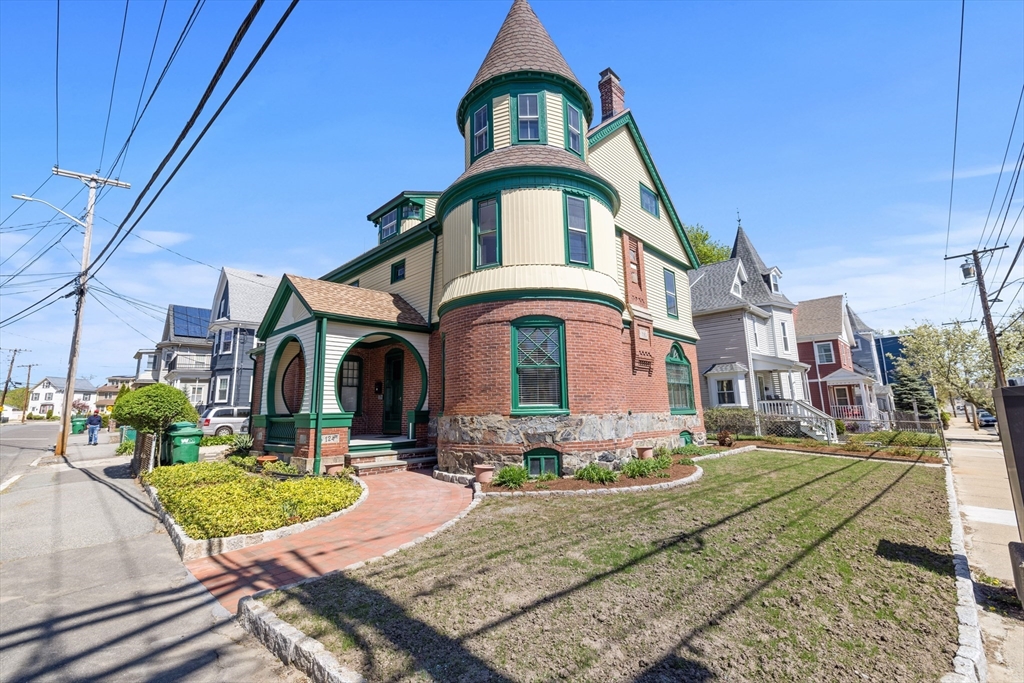
Active
$739,000
2
bds
|
2
ba
|
1,360
sqft
|
built
1900
122 Park St, Medford, MA 02155
$-1,749
Cash flow
-12.3%
Cash-on-Cash Return
2.8%
Cap rate
0.5%
Rent to Value Ratio

Active
$1,550,000
7
bds
|
4
ba
|
4,269
sqft
|
built
1900
66 Bradlee Rd, Medford, MA 02155
$-2,402
Cash flow
-8.1%
Cash-on-Cash Return
3.8%
Cap rate
0.6%
Rent to Value Ratio
Active
$1,088,000
3
bds
|
3
ba
|
1,791
sqft
|
built
1930
17 Burbank Rd, Medford, MA 02155
$-2,321
Cash flow
-11.1%
Cash-on-Cash Return
3.1%
Cap rate
0.5%
Rent to Value Ratio
Active
$1,099,000
3
bds
|
4
ba
|
2,189
sqft
|
built
1930
15 Grace Rd, Medford, MA 02155
$-2,020
Cash flow
-9.6%
Cash-on-Cash Return
3.5%
Cap rate
0.5%
Rent to Value Ratio
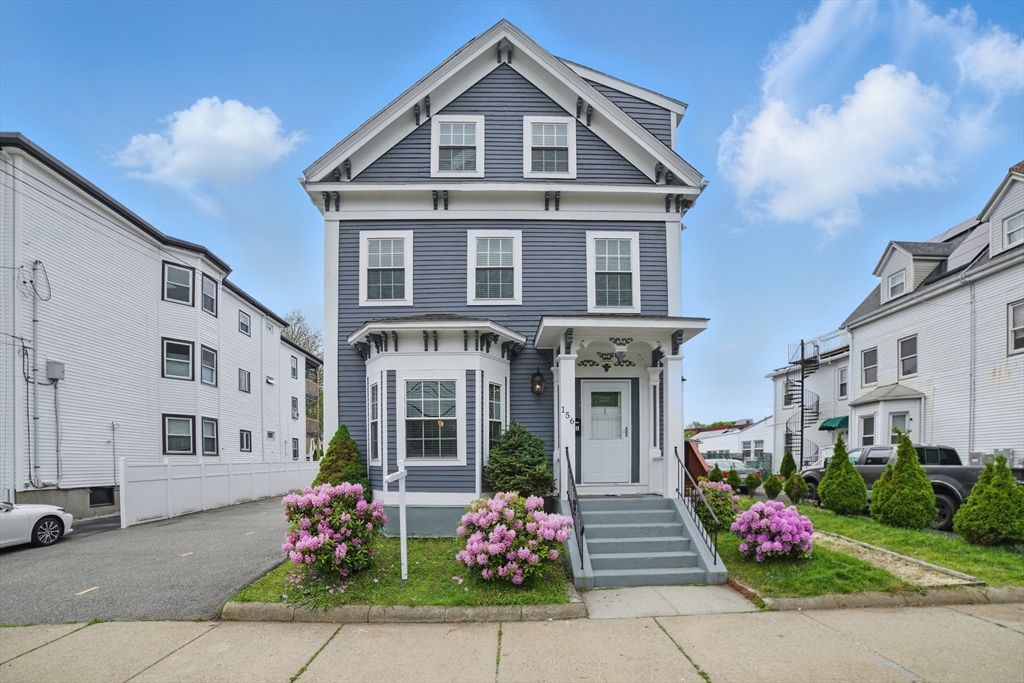
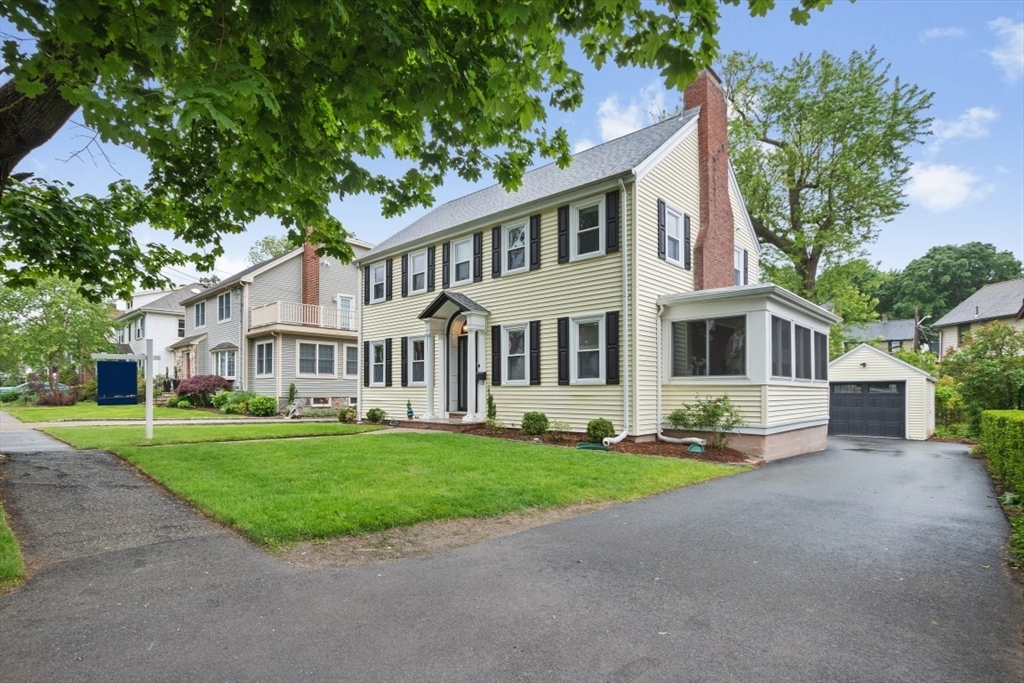
Active
$849,000
3
bds
|
3
ba
|
2,393
sqft
|
built
1910
156 Park St, Medford, MA 02155
$-1,625
Cash flow
-10.0%
Cash-on-Cash Return
3.4%
Cap rate
0.5%
Rent to Value Ratio
Active
$1,295,000
5
bds
|
3
ba
|
2,865
sqft
|
built
1890
124 Boston Ave, Medford, MA 02155
$-4,441
Cash flow
-17.9%
Cash-on-Cash Return
1.6%
Cap rate
0.3%
Rent to Value Ratio

Active
$1,250,000
4
bds
|
3
ba
|
2,262
sqft
|
built
1910
202 Middlesex Ave, Medford, MA 02155
$-2,632
Cash flow
-11.0%
Cash-on-Cash Return
3.2%
Cap rate
0.5%
Rent to Value Ratio
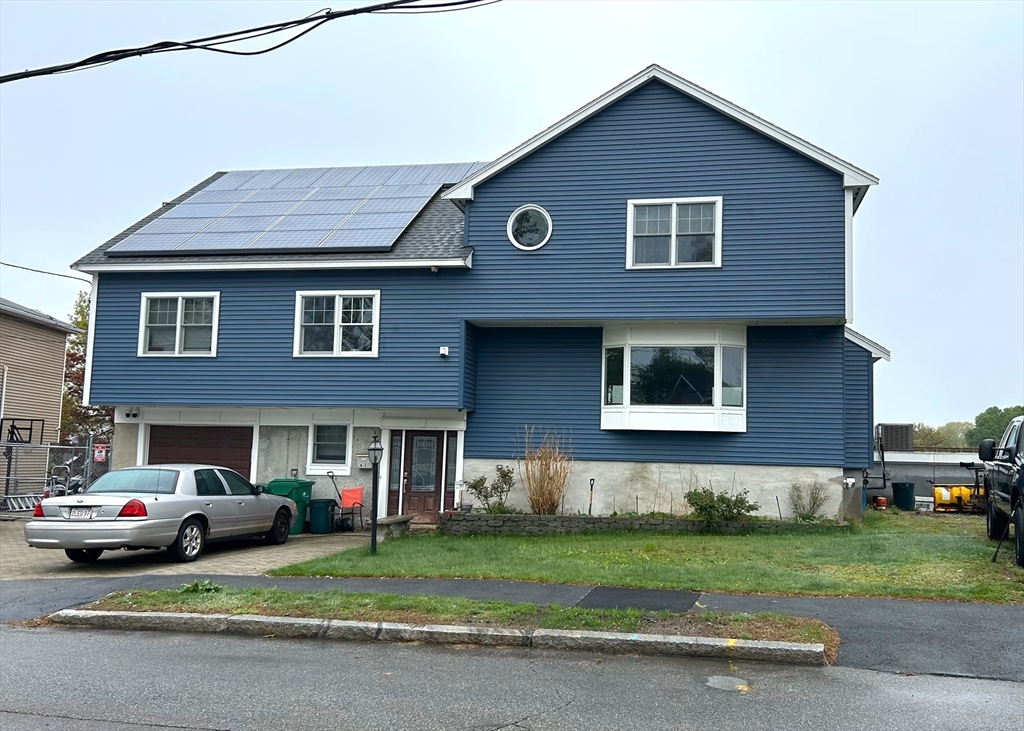
Active
$1,350,000
4
bds
|
3
ba
|
3,500
sqft
|
built
1964
63 Doonan St, Medford, MA 02155
$-3,317
Cash flow
-12.8%
Cash-on-Cash Return
2.7%
Cap rate
0.4%
Rent to Value Ratio
Active
$1,399,000
6
bds
|
3
ba
|
2,975
sqft
|
built
1920
2218 Mystic Valley Pkwy, Medford, MA 02155
$-4,484
Cash flow
-16.7%
Cash-on-Cash Return
1.8%
Cap rate
0.3%
Rent to Value Ratio
Active
$1,175,000
6
bds
|
3
ba
|
3,484
sqft
|
built
1905
232 Central Ave, Medford, MA 02155
$-3,519
Cash flow
-15.6%
Cash-on-Cash Return
2.1%
Cap rate
0.3%
Rent to Value Ratio
Active
$859,000
2
bds
|
2
ba
|
1,265
sqft
|
built
2009
215 Harvard St, Medford, MA 02155
$-2,522
Cash flow
-15.3%
Cash-on-Cash Return
2.2%
Cap rate
0.5%
Rent to Value Ratio
Active
$685,000
1
bds
|
1
ba
|
937
sqft
|
built
2022
320 Middlesex Ave, Medford, MA 02155
$-2,128
Cash flow
-16.2%
Cash-on-Cash Return
2.0%
Cap rate
0.4%
Rent to Value Ratio
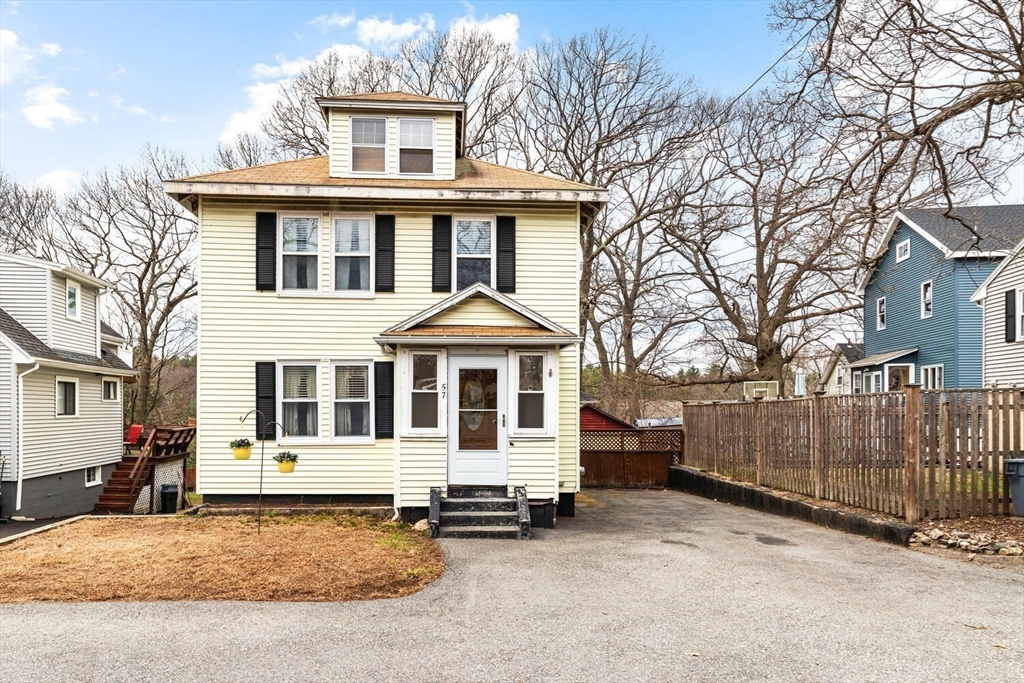
Active
$719,000
3
bds
|
2
ba
|
1,486
sqft
|
built
1915
57 Taft St, Medford, MA 02155
$-1,391
Cash flow
-10.1%
Cash-on-Cash Return
3.4%
Cap rate
0.5%
Rent to Value Ratio
Active
$1,299,900
3
bds
|
3
ba
|
2,328
sqft
|
built
1935
79 Hutchins Rd, Medford, MA 02155
$-3,965
Cash flow
-15.9%
Cash-on-Cash Return
2.0%
Cap rate
0.3%
Rent to Value Ratio
Active
$638,000
1
bds
|
1
ba
|
789
sqft
|
built
2007
100 Station Lndg, Medford, MA 02155
$-1,812
Cash flow
-14.8%
Cash-on-Cash Return
2.3%
Cap rate
0.5%
Rent to Value Ratio
Active
$699,000
3
bds
|
1
ba
|
1,290
sqft
|
built
1944
194 Fells Ave, Medford, MA 02155
$-1,306
Cash flow
-9.7%
Cash-on-Cash Return
3.4%
Cap rate
0.5%
Rent to Value Ratio
Active
$1,099,000
7
bds
|
2
ba
|
2,679
sqft
|
built
1910
562 Main St, Medford, MA 02155
$-3,519
Cash flow
-16.7%
Cash-on-Cash Return
1.8%
Cap rate
0.3%
Rent to Value Ratio
Active
$674,999
1
bds
|
1
ba
|
1,055
sqft
|
built
2023
320 Middlesex Ave, Medford, MA 02155
$-2,131
Cash flow
-16.5%
Cash-on-Cash Return
1.9%
Cap rate
0.4%
Rent to Value Ratio

Active
$1,599,900
9
bds
|
3
ba
|
3,074
sqft
|
built
1920
88 Princeton St, Medford, MA 02155
$-5,919
Cash flow
-19.3%
Cash-on-Cash Return
1.2%
Cap rate
0.2%
Rent to Value Ratio

Active
$899,000
4
bds
|
3
ba
|
2,016
sqft
|
built
1926
48 West St, Medford, MA 02155
$-1,675
Cash flow
-9.7%
Cash-on-Cash Return
3.4%
Cap rate
0.5%
Rent to Value Ratio
Active
$1,195,000
3
bds
|
3
ba
|
1,882
sqft
|
built
1929
89 Woburn St, Medford, MA 02155
$-3,528
Cash flow
-15.4%
Cash-on-Cash Return
2.1%
Cap rate
0.3%
Rent to Value Ratio
Active
$1,050,000
4
bds
|
2
ba
|
1,989
sqft
|
built
1900
67 Prescott St, Medford, MA 02155
$-2,149
Cash flow
-10.7%
Cash-on-Cash Return
3.2%
Cap rate
0.5%
Rent to Value Ratio

Active
$1,749,000
6
bds
|
3
ba
|
3,203
sqft
|
built
1900
124 Grant Ave, Medford, MA 02155
$-6,696
Cash flow
-20.0%
Cash-on-Cash Return
1.1%
Cap rate
0.2%
Rent to Value Ratio
Active
$799,000
3
bds
|
2
ba
|
2,471
sqft
|
built
1968
44 Clematis Rd, Medford, MA 02155
$-1,564
Cash flow
-10.2%
Cash-on-Cash Return
3.3%
Cap rate
0.5%
Rent to Value Ratio
Active
$925,000
2
bds
|
2
ba
|
1,265
sqft
|
built
2007
100 Station Lndg, Medford, MA 02155
$-3,014
Cash flow
-17.0%
Cash-on-Cash Return
1.8%
Cap rate
0.4%
Rent to Value Ratio
Active
$640,000
2
bds
|
2
ba
|
1,224
sqft
|
built
1987
30 Revere Beach Pkwy, Medford, MA 02155
$-1,724
Cash flow
-14.1%
Cash-on-Cash Return
2.4%
Cap rate
0.5%
Rent to Value Ratio

Active
$749,000
3
bds
|
2
ba
|
1,600
sqft
|
built
1940
211 Arlington St, Medford, MA 02155
$-1,241
Cash flow
-8.6%
Cash-on-Cash Return
3.7%
Cap rate
0.5%
Rent to Value Ratio

Active
$929,500
2
bds
|
2
ba
|
1,116
sqft
|
built
2007
100 Station Lndg, Medford, MA 02155
$-3,546
Cash flow
-19.9%
Cash-on-Cash Return
1.1%
Cap rate
0.4%
Rent to Value Ratio

Active
$1,549,000
9
bds
|
4
ba
|
3,218
sqft
|
built
1878
42 Dudley St, Medford, MA 02155
$-5,488
Cash flow
-18.5%
Cash-on-Cash Return
1.4%
Cap rate
0.3%
Rent to Value Ratio
Active
$1,399,900
6
bds
|
2
ba
|
2,795
sqft
|
built
1910
168 Main St, Medford, MA 02155
$-4,863
Cash flow
-18.1%
Cash-on-Cash Return
1.5%
Cap rate
0.3%
Rent to Value Ratio

Active
$879,000
3
bds
|
3
ba
|
1,554
sqft
|
built
2022
34 Salem St, Medford, MA 02155
$-2,904
Cash flow
-17.2%
Cash-on-Cash Return
1.7%
Cap rate
0.4%
Rent to Value Ratio
Active
$1,225,000
4
bds
|
4
ba
|
2,721
sqft
|
built
2006
20 Roosevelt Rd, Medford, MA 02155
$-2,570
Cash flow
-10.9%
Cash-on-Cash Return
3.2%
Cap rate
0.5%
Rent to Value Ratio

Active
$849,000
4
bds
|
1
ba
|
1,686
sqft
|
built
1910
6 Wolcott St, Medford, MA 02155
$-1,429
Cash flow
-8.8%
Cash-on-Cash Return
3.7%
Cap rate
0.5%
Rent to Value Ratio

Active
$965,000
2
bds
|
2
ba
|
1,420
sqft
|
built
2022
320 Middlesex Ave, Medford, MA 02155
$-3,049
Cash flow
-16.5%
Cash-on-Cash Return
1.9%
Cap rate
0.4%
Rent to Value Ratio
Active
$750,000
2
bds
|
2
ba
|
1,404
sqft
|
built
1941
262 Winthrop St, Medford, MA 02155
$-1,301
Cash flow
-9.1%
Cash-on-Cash Return
3.6%
Cap rate
0.5%
Rent to Value Ratio