Berrien County Investment Properties for Sale
Browse homes for sale and investment properties in Berrien County. Refine your search by price, property type, or more.
Best cash flowing properties in Berrien County
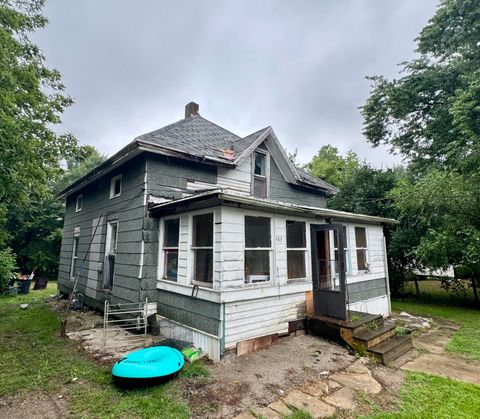
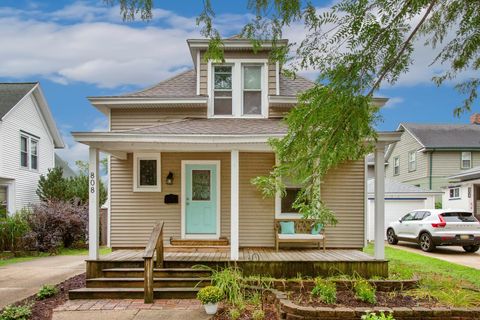
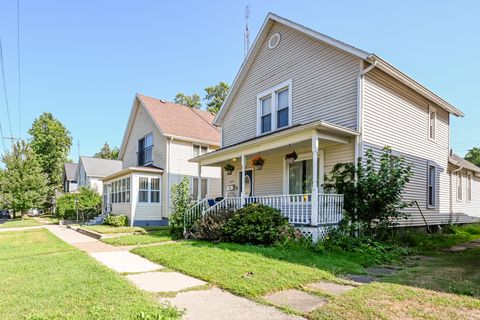
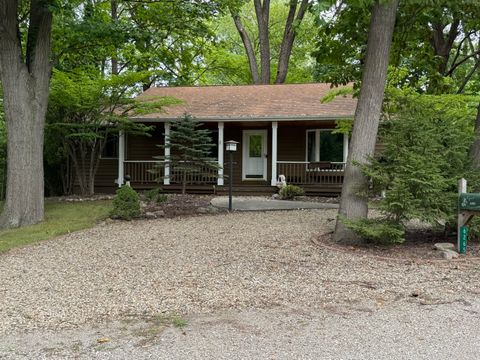
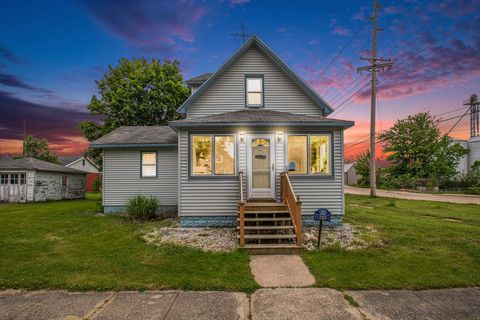
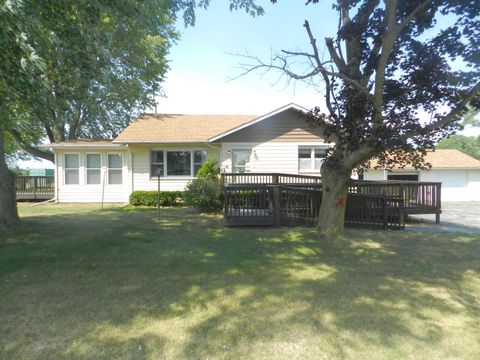
Active
$52,000
4
bds
|
2
ba
|
1,252
sqft
|
built
1920
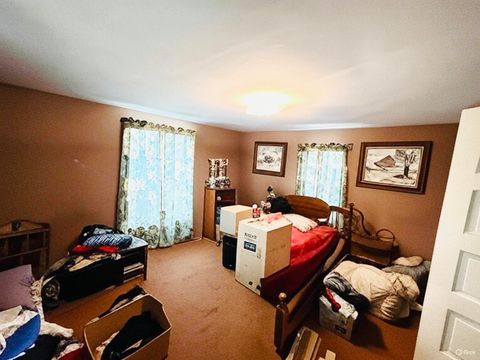
483 2nd St, Benton Harbor, MI 49022
$592
Cash flow
13.3%
Cash-on-Cash Return
13.7%
Cap rate
1.9%
Rent to Value Ratio
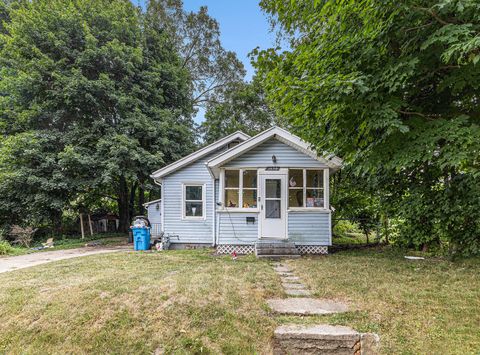
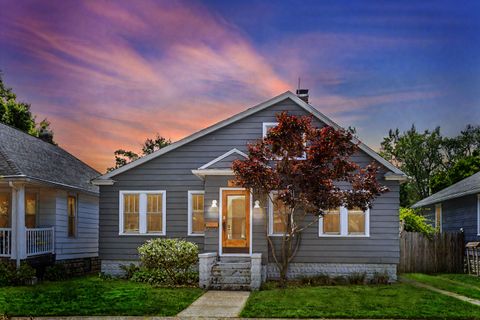
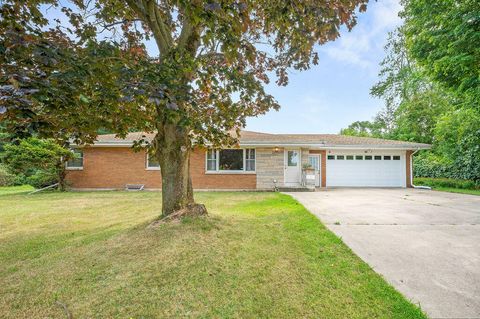
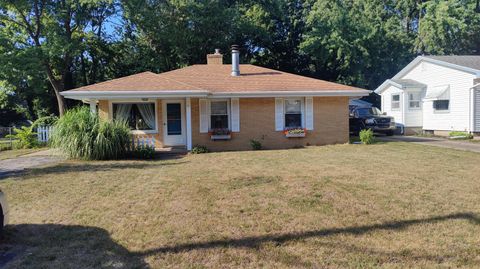
Active
$117,900
2
bds
|
1
ba
|
756
sqft
|
built
1940
1638 Cherry St, Niles, MI 49120
$237
Cash flow
10.5%
Cash-on-Cash Return
8.6%
Cap rate
1.2%
Rent to Value Ratio
238 out of 311 properties for sale in Berrien County
Limited Results Shown
Create a free account, or log in to reveal all property listings and enjoy the complete experience.
Active
$375,000
4
bds
|
3
ba
|
1,872
sqft
|
built
1976
10617 Baldwin Rd, Bridgman, MI 49106
$-352
Cash flow
-4.9%
Cash-on-Cash Return
5.0%
Cap rate
0.7%
Rent to Value Ratio

Active
$699,000
3
bds
|
3
ba
|
2,188
sqft
|
built
1988
4160 Creek Dr, New Buffalo, MI 49117
$-1,799
Cash flow
-13.4%
Cash-on-Cash Return
3.1%
Cap rate
0.5%
Rent to Value Ratio

Active
$500,000
4
bds
|
3
ba
|
2,532
sqft
|
built
1947
2206 Morton Ave, Saint Joseph, MI 49085
$-1,233
Cash flow
-12.9%
Cash-on-Cash Return
3.2%
Cap rate
0.6%
Rent to Value Ratio
Active
$670,000
6
bds
|
3
ba
|
2,941
sqft
|
built
1961
2878 W Bundy Rd, Coloma, MI 49038
$-1,417
Cash flow
-11.0%
Cash-on-Cash Return
3.6%
Cap rate
0.5%
Rent to Value Ratio

Active
$1,299,000
3
bds
|
4
ba
|
2,600
sqft
|
built
1933
9325 Matthews Rd, Union Pier, MI 49129
$-6,013
Cash flow
-24.2%
Cash-on-Cash Return
0.6%
Cap rate
0.2%
Rent to Value Ratio
Active
$299,000
4
bds
|
1
ba
|
2,216
sqft
|
built
1960
5248 Coloma Rd, Coloma, MI 49038
$-221
Cash flow
-3.9%
Cash-on-Cash Return
5.3%
Cap rate
0.7%
Rent to Value Ratio

Active
$1,430,000
5
bds
|
4
ba
|
4,440
sqft
|
built
1973
2949 Pagoda Path, Stevensville, MI 49127
$-5,864
Cash flow
-21.4%
Cash-on-Cash Return
1.2%
Cap rate
0.2%
Rent to Value Ratio
Active
$1,850,000
3
bds
|
3
ba
|
3,300
sqft
|
built
1972
7206 Beechwood Cir, Watervliet, MI 49098
$-6,755
Cash flow
-19.1%
Cash-on-Cash Return
1.8%
Cap rate
0.3%
Rent to Value Ratio

Active
$459,500
3
bds
|
0
ba
|
0
sqft
|
built
1972
8687 Lilac Ln, Berrien Springs, MI 49103
$-1,155
Cash flow
-13.1%
Cash-on-Cash Return
3.1%
Cap rate
0.5%
Rent to Value Ratio
Active
$800,000
4
bds
|
4
ba
|
3,324
sqft
|
built
2000
4509 Hanover Rd, Sawyer, MI 49125
$-1,818
Cash flow
-11.9%
Cash-on-Cash Return
3.4%
Cap rate
0.5%
Rent to Value Ratio

Active
$2,450,000
3
bds
|
3
ba
|
3,448
sqft
|
built
1999
15157 Lakeshore Rd, Lakeside, MI 49116
$-10,686
Cash flow
-22.8%
Cash-on-Cash Return
0.9%
Cap rate
0.2%
Rent to Value Ratio
Active
$239,900
4
bds
|
2
ba
|
1,995
sqft
|
built
1920
118 Schirmer Pkwy, Buchanan, MI 49107
$-54
Cash flow
-1.2%
Cash-on-Cash Return
5.9%
Cap rate
0.8%
Rent to Value Ratio

Active
$469,500
5
bds
|
0
ba
|
0
sqft
|
built
1976
8892 Maplewood Dr, Berrien Springs, MI 49103
$-1,113
Cash flow
-12.4%
Cash-on-Cash Return
3.3%
Cap rate
0.5%
Rent to Value Ratio
Active
$242,000
2
bds
|
2
ba
|
1,248
sqft
|
built
1915
808 Wisconsin Ave, Saint Joseph, MI 49085
$-231
Cash flow
-5.0%
Cash-on-Cash Return
5.0%
Cap rate
0.7%
Rent to Value Ratio
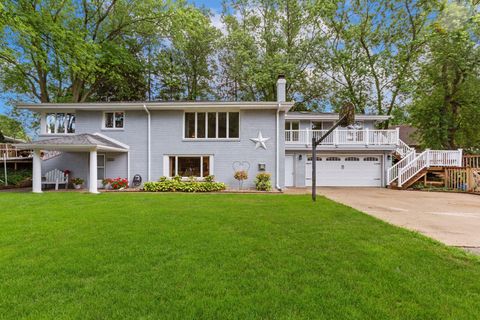
Active
$430,000
5
bds
|
4
ba
|
3,350
sqft
|
built
1960
1610 Church St, Baroda, MI 49101
$-659
Cash flow
-8.0%
Cash-on-Cash Return
4.3%
Cap rate
0.7%
Rent to Value Ratio
Active
$339,000
2
bds
|
1
ba
|
1,136
sqft
|
built
1950
306 E Indiana St, New Buffalo, MI 49117
$-896
Cash flow
-13.8%
Cash-on-Cash Return
3.0%
Cap rate
0.4%
Rent to Value Ratio
Active
$1,200,000
3
bds
|
3
ba
|
2,516
sqft
|
built
1996
19745 S Lakeside Rd, New Buffalo, MI 49117
$-4,824
Cash flow
-21.0%
Cash-on-Cash Return
1.3%
Cap rate
0.3%
Rent to Value Ratio
Active
$314,000
3
bds
|
2
ba
|
1,440
sqft
|
built
1922
1004 Harrison Ave, Saint Joseph, MI 49085
$-430
Cash flow
-7.1%
Cash-on-Cash Return
4.5%
Cap rate
0.7%
Rent to Value Ratio

Active
$255,000
2
bds
|
1
ba
|
930
sqft
|
built
1920
4940 Pottawatamie Dr, Watervliet, MI 49098
$-346
Cash flow
-7.1%
Cash-on-Cash Return
4.5%
Cap rate
0.8%
Rent to Value Ratio
Active
$269,900
2
bds
|
1
ba
|
1,068
sqft
|
built
1928
526 La Salle Ave, Saint Joseph, MI 49085
$-598
Cash flow
-11.6%
Cash-on-Cash Return
3.5%
Cap rate
0.7%
Rent to Value Ratio
Active
$315,000
3
bds
|
2
ba
|
1,474
sqft
|
built
1954
2019 Sunset Dr, Saint Joseph, MI 49085
$-649
Cash flow
-10.7%
Cash-on-Cash Return
3.7%
Cap rate
0.6%
Rent to Value Ratio

Active
$689,900
4
bds
|
4
ba
|
3,618
sqft
|
built
1970
2049 E Hinchman Rd, Berrien Springs, MI 49103
$-2,160
Cash flow
-16.3%
Cash-on-Cash Return
2.4%
Cap rate
0.4%
Rent to Value Ratio
Active
$1,030,000
5
bds
|
3
ba
|
3,472
sqft
|
built
1960
9555 Dunewood Dr, Bridgman, MI 49106
$-3,925
Cash flow
-19.9%
Cash-on-Cash Return
1.6%
Cap rate
0.2%
Rent to Value Ratio
Active
$450,000
4
bds
|
2
ba
|
2,256
sqft
|
built
1995
6265 Elm Dr, Sawyer, MI 49125
$-1,395
Cash flow
-16.2%
Cash-on-Cash Return
2.4%
Cap rate
0.4%
Rent to Value Ratio
Active
$267,000
3
bds
|
2
ba
|
1,668
sqft
|
built
1956
768 Polfus Dr, Benton Harbor, MI 49022
$-203
Cash flow
-4.0%
Cash-on-Cash Return
5.2%
Cap rate
0.7%
Rent to Value Ratio
Active
$544,900
5
bds
|
3
ba
|
2,885
sqft
|
built
2017
3045 Little Glendora Rd, Buchanan, MI 49107
$-1,232
Cash flow
-11.8%
Cash-on-Cash Return
3.4%
Cap rate
0.5%
Rent to Value Ratio
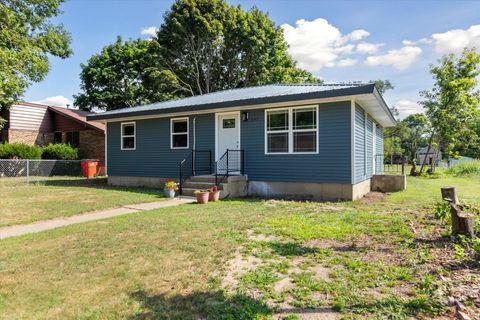
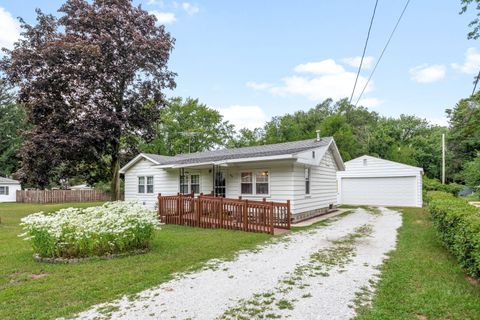
Active
$145,000
3
bds
|
1
ba
|
1,008
sqft
|
built
1990
680 Waukonda Ave, Benton Harbor, MI 49022
$110
Cash flow
4.0%
Cash-on-Cash Return
7.1%
Cap rate
1.0%
Rent to Value Ratio
Active
$215,000
3
bds
|
1
ba
|
1,539
sqft
|
built
1901
202 Maple St, Three Oaks, MI 49128
$-125
Cash flow
-3.0%
Cash-on-Cash Return
5.4%
Cap rate
0.7%
Rent to Value Ratio
Active
$489,000
2
bds
|
2
ba
|
1,735
sqft
|
built
2020
824 N Philip Rd, Niles, MI 49120
$-1,394
Cash flow
-14.9%
Cash-on-Cash Return
2.7%
Cap rate
0.5%
Rent to Value Ratio

Active
$393,000
3
bds
|
2
ba
|
2,321
sqft
|
built
1971
5771 Echo Rdg, Stevensville, MI 49127
$-532
Cash flow
-7.1%
Cash-on-Cash Return
4.5%
Cap rate
0.7%
Rent to Value Ratio
Active
$809,000
4
bds
|
4
ba
|
1,880
sqft
|
built
2013
293 Morning Walk Path, Benton Harbor, MI 49022
$-3,074
Cash flow
-19.8%
Cash-on-Cash Return
1.6%
Cap rate
0.4%
Rent to Value Ratio
Active
$140,000
bds
|
0
ba
|
0
sqft
|
built
1910
514 S 5th St, Niles, MI 49120
$73
Cash flow
2.7%
Cash-on-Cash Return
6.8%
Cap rate
1.0%
Rent to Value Ratio

Active
$265,000
3
bds
|
0
ba
|
0
sqft
|
built
1965
7039 Curtis Dr, Coloma, MI 49038
$-230
Cash flow
-4.5%
Cash-on-Cash Return
5.1%
Cap rate
0.8%
Rent to Value Ratio
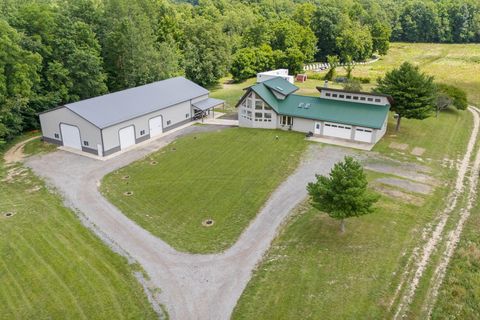
Active
$294,900
3
bds
|
1
ba
|
1,580
sqft
|
built
1950
4495 Oxbow Rd, Eau Claire, MI 49111
$-490
Cash flow
-8.7%
Cash-on-Cash Return
4.2%
Cap rate
0.5%
Rent to Value Ratio
Active
$160,000
2
bds
|
1
ba
|
936
sqft
|
built
1953
117 Messner Dr, Benton Harbor, MI 49022
$25
Cash flow
0.8%
Cash-on-Cash Return
6.3%
Cap rate
0.9%
Rent to Value Ratio
Active
$695,000
3
bds
|
2
ba
|
1,616
sqft
|
built
2005
14217 Wildwood Ln, Harbert, MI 49115
$-2,474
Cash flow
-18.6%
Cash-on-Cash Return
1.9%
Cap rate
0.4%
Rent to Value Ratio
Active
$229,000
2
bds
|
3
ba
|
1,536
sqft
|
built
1970
2727 S Lakeshore Dr, Saint Joseph, MI 49085
$-618
Cash flow
-14.1%
Cash-on-Cash Return
2.9%
Cap rate
0.9%
Rent to Value Ratio
Active
$630,000
3
bds
|
3
ba
|
2,284
sqft
|
built
1983
1501 W Water St, New Buffalo, MI 49117
$-3,837
Cash flow
-31.8%
Cash-on-Cash Return
-1.2%
Cap rate
0.3%
Rent to Value Ratio