Ingham County Investment Properties for Sale
Browse homes for sale and investment properties in Ingham County. Refine your search by price, property type, or more.
Best cash flowing properties in Ingham County
Active
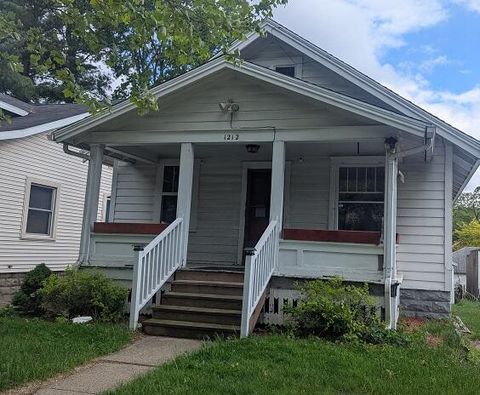
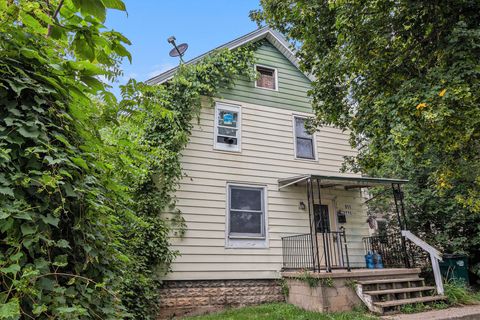
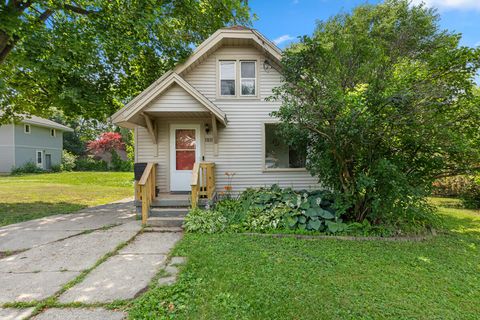
$59,900
3
bds
|
1
ba
|
816
sqft
|
built
1925
1212 Climax St, Lansing, MI 48912
$832
Cash flow
16.2%
Cash-on-Cash Return
16.7%
Cap rate
2.3%
Rent to Value Ratio
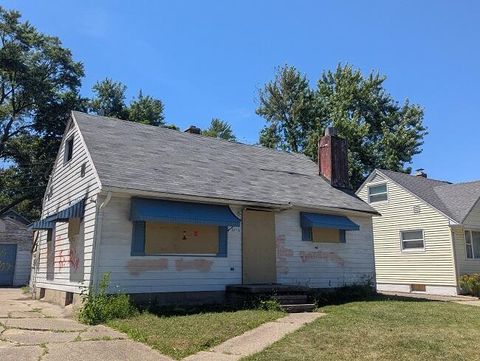
Active
$28,900
4
bds
|
2
ba
|
460
sqft
|
built
1950
3716 S Pennsylvania Ave, Lansing, MI 48910
$520
Cash flow
21.0%
Cash-on-Cash Return
21.6%
Cap rate
3.8%
Rent to Value Ratio
38 out of 39 properties for sale in Ingham County
Limited Results Shown
Create a free account, or log in to reveal all property listings and enjoy the complete experience.
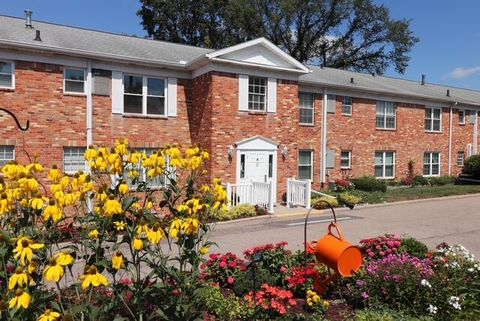
Active
$205,000
3
bds
|
2
ba
|
1,600
sqft
|
built
1966
3333 Moores River Dr, Lansing, MI 48911
$-953
Cash flow
-24.3%
Cash-on-Cash Return
0.6%
Cap rate
0.6%
Rent to Value Ratio

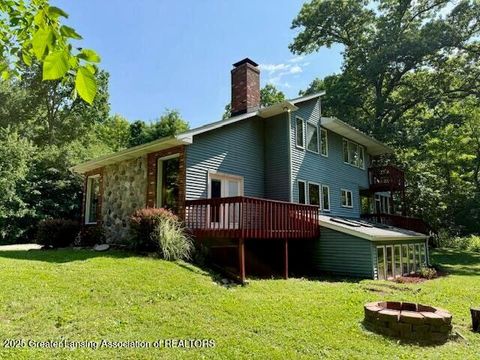
Active
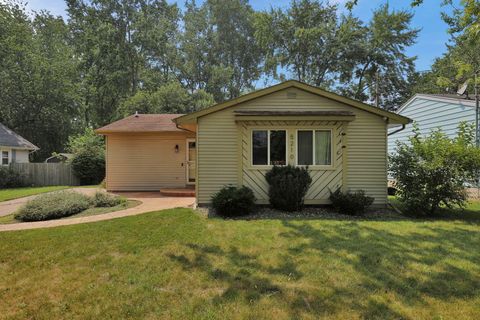
$89,900
2
bds
|
1
ba
|
608
sqft
|
built
1954
1529 S Pennsylvania Ave, Lansing, MI 48910
$170
Cash flow
9.9%
Cash-on-Cash Return
8.4%
Cap rate
1.2%
Rent to Value Ratio
Active
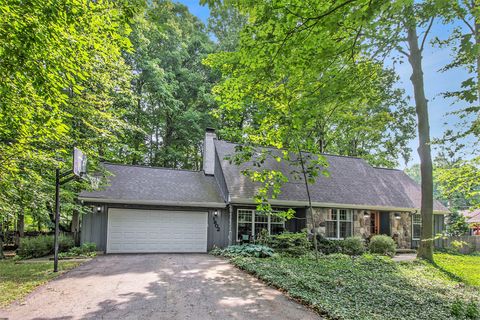
$398,000
4
bds
|
5
ba
|
3,636
sqft
|
built
1987
1800 Onondaga Rd, Holt, MI 48842
$-962
Cash flow
-12.6%
Cash-on-Cash Return
3.2%
Cap rate
0.7%
Rent to Value Ratio
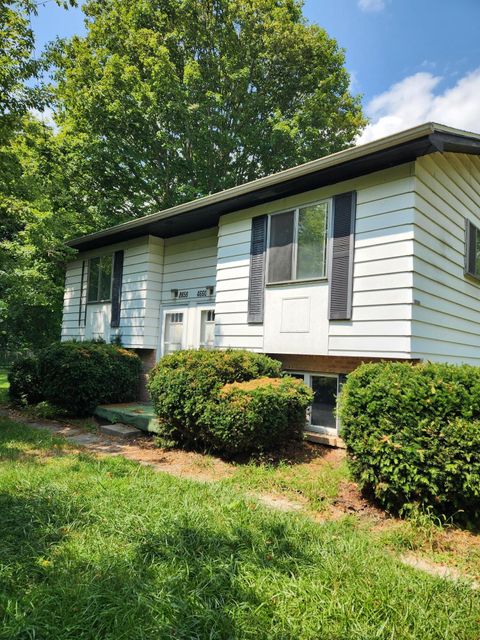
Active
$185,000
4
bds
|
0
ba
|
0
sqft
|
built
1966
4660 Ammon Dr, Holt, MI 48842
$-404
Cash flow
-11.4%
Cash-on-Cash Return
3.5%
Cap rate
0.8%
Rent to Value Ratio

Active
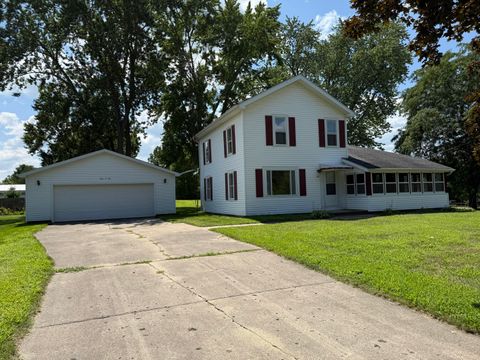
$160,000
5
bds
|
2
ba
|
1,890
sqft
|
built
1940
4620 Christiansen Rd, Lansing, MI 48910
$162
Cash flow
5.3%
Cash-on-Cash Return
7.4%
Cap rate
1.1%
Rent to Value Ratio
Active
$160,000
2
bds
|
1
ba
|
728
sqft
|
built
1941
906 Stanley St, Lansing, MI 48915
$-80
Cash flow
-2.6%
Cash-on-Cash Return
5.6%
Cap rate
0.9%
Rent to Value Ratio
Active
$409,900
bds
|
0
ba
|
0
sqft
|
built
1973
637 Lexington Ave, East Lansing, MI 48823
$-1,478
Cash flow
-18.8%
Cash-on-Cash Return
1.8%
Cap rate
0.6%
Rent to Value Ratio
Active
$197,000
3
bds
|
2
ba
|
1,155
sqft
|
built
1954
4604 Kathy Ct, Holt, MI 48842
$-478
Cash flow
-12.7%
Cash-on-Cash Return
3.2%
Cap rate
0.7%
Rent to Value Ratio
Active
$259,900
3
bds
|
3
ba
|
1,783
sqft
|
built
1924
1977 Ives Rd, Leslie, MI 49251
$-339
Cash flow
-6.8%
Cash-on-Cash Return
4.6%
Cap rate
0.7%
Rent to Value Ratio
Active
$225,000
5
bds
|
2
ba
|
2,740
sqft
|
built
1953
4282 Woodworth Ave, Holt, MI 48842
$-214
Cash flow
-5.0%
Cash-on-Cash Return
5.0%
Cap rate
0.9%
Rent to Value Ratio

Active
$167,000
3
bds
|
2
ba
|
960
sqft
|
built
1963
3010 Pleasant Grove Rd, Lansing, MI 48910
$-231
Cash flow
-7.2%
Cash-on-Cash Return
4.5%
Cap rate
0.8%
Rent to Value Ratio
Active
$155,000
3
bds
|
2
ba
|
1,011
sqft
|
built
1959
3800 Ronald St, Lansing, MI 48911
$75
Cash flow
2.5%
Cash-on-Cash Return
6.7%
Cap rate
0.9%
Rent to Value Ratio
Active
$239,900
3
bds
|
2
ba
|
1,761
sqft
|
built
1958
2200 Rossiter Pl, Lansing, MI 48911
$-252
Cash flow
-5.5%
Cash-on-Cash Return
4.9%
Cap rate
0.8%
Rent to Value Ratio

Active
$215,000
3
bds
|
2
ba
|
1,632
sqft
|
built
1984
5727 Laporte Dr, Lansing, MI 48911
$-302
Cash flow
-7.3%
Cash-on-Cash Return
4.5%
Cap rate
0.7%
Rent to Value Ratio
Active
$109,900
bds
|
0
ba
|
0
sqft
|
built
1908
811 Larned St, Lansing, MI 48912
$-56
Cash flow
-2.7%
Cash-on-Cash Return
5.5%
Cap rate
1.1%
Rent to Value Ratio
Active
$329,900
3
bds
|
3
ba
|
2,896
sqft
|
built
1973
1802 Tupelo Trl, Holt, MI 48842
$-673
Cash flow
-10.6%
Cash-on-Cash Return
3.7%
Cap rate
0.7%
Rent to Value Ratio
Active
$165,000
3
bds
|
1
ba
|
1,906
sqft
|
built
1979
5210 Wexford Rd, Lansing, MI 48911
$-282
Cash flow
-8.9%
Cash-on-Cash Return
4.1%
Cap rate
0.8%
Rent to Value Ratio
Active
$229,900
2
bds
|
1
ba
|
1,418
sqft
|
built
1900
301 Mill St, Leslie, MI 49251
$-418
Cash flow
-9.5%
Cash-on-Cash Return
4.0%
Cap rate
0.6%
Rent to Value Ratio
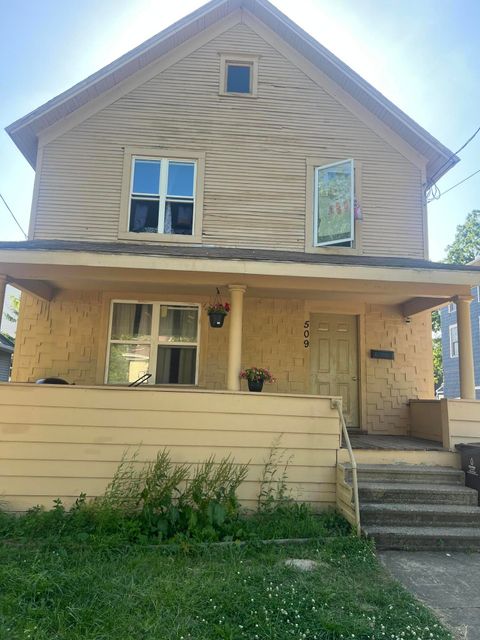
Active
$85,000
bds
|
0
ba
|
0
sqft
|
built
1903
509 N Walnut St, Lansing, MI 48933
$112
Cash flow
6.9%
Cash-on-Cash Return
7.7%
Cap rate
1.6%
Rent to Value Ratio
Active
$260,000
3
bds
|
3
ba
|
1,779
sqft
|
built
1965
2415 Woodview Dr, Lansing, MI 48911
$-428
Cash flow
-8.6%
Cash-on-Cash Return
4.2%
Cap rate
0.7%
Rent to Value Ratio
Active
$450,000
5
bds
|
6
ba
|
2,725
sqft
|
built
1925
1912 Moores River Dr, Lansing, MI 48910
$-1,086
Cash flow
-12.6%
Cash-on-Cash Return
3.3%
Cap rate
0.6%
Rent to Value Ratio
Active
$224,900
4
bds
|
2
ba
|
1,040
sqft
|
built
1980
3726 Ruth Ave, Lansing, MI 48910
$-480
Cash flow
-11.1%
Cash-on-Cash Return
3.6%
Cap rate
0.6%
Rent to Value Ratio
Active
$150,000
3
bds
|
1
ba
|
1,039
sqft
|
built
1928
1420 Reo Rd, Lansing, MI 48910
$-287
Cash flow
-10.0%
Cash-on-Cash Return
3.8%
Cap rate
0.7%
Rent to Value Ratio
Active
$204,900
3
bds
|
2
ba
|
1,213
sqft
|
built
1969
407 Doty St, Leslie, MI 49251
$-327
Cash flow
-8.3%
Cash-on-Cash Return
4.2%
Cap rate
0.8%
Rent to Value Ratio
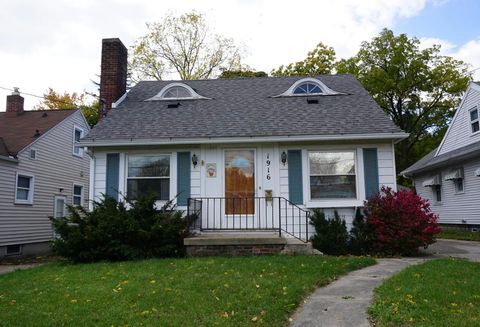
Active
$110,000
3
bds
|
2
ba
|
1,363
sqft
|
built
1925
1916 Lyons Ave, Lansing, MI 48910
$95
Cash flow
4.5%
Cash-on-Cash Return
7.2%
Cap rate
1.3%
Rent to Value Ratio
Active
$315,000
3
bds
|
2
ba
|
3,782
sqft
|
built
1973
3684 W Howell Rd, Mason, MI 48854
$-584
Cash flow
-9.7%
Cash-on-Cash Return
3.9%
Cap rate
0.6%
Rent to Value Ratio
Active
$100,000
2
bds
|
1
ba
|
796
sqft
|
built
1922
1811 Vermont Ave, Lansing, MI 48906
$310
Cash flow
16.2%
Cash-on-Cash Return
9.9%
Cap rate
1.5%
Rent to Value Ratio
Active
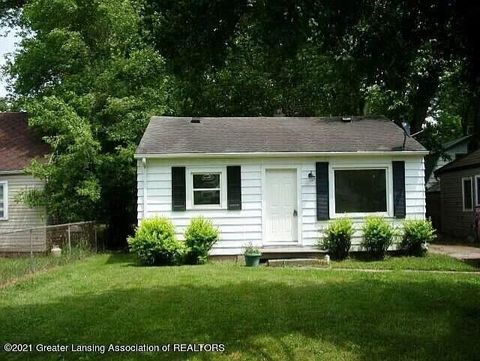
$89,900
3
bds
|
1
ba
|
812
sqft
|
built
1952
4927 Starr Ave, Lansing, MI 48910
$81
Cash flow
4.7%
Cash-on-Cash Return
7.2%
Cap rate
1.2%
Rent to Value Ratio
Active
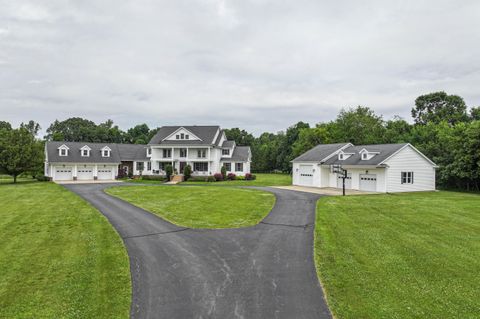
$989,000
4
bds
|
3
ba
|
4,576
sqft
|
built
2004
2787 Moyer Rd, Williamston, MI 48895
$-2,770
Cash flow
-14.6%
Cash-on-Cash Return
2.8%
Cap rate
0.4%
Rent to Value Ratio
Active
$395,000
5
bds
|
3
ba
|
1,927
sqft
|
built
1922
539 Sunset Ln, East Lansing, MI 48823
$-1,080
Cash flow
-14.3%
Cash-on-Cash Return
2.9%
Cap rate
0.5%
Rent to Value Ratio

Active
$78,800
3
bds
|
1
ba
|
836
sqft
|
built
1916
904 Riverview Ave, Lansing, MI 48915
$46
Cash flow
3.0%
Cash-on-Cash Return
6.9%
Cap rate
1.3%
Rent to Value Ratio
Active
$318,000
2
bds
|
2
ba
|
1,187
sqft
|
built
2008
600 Albert Ave, East Lansing, MI 48823
$-1,453
Cash flow
-23.8%
Cash-on-Cash Return
0.7%
Cap rate
0.6%
Rent to Value Ratio
Active
$309,900
3
bds
|
2
ba
|
1,620
sqft
|
built
1946
533 Beech St, East Lansing, MI 48823
$-606
Cash flow
-10.2%
Cash-on-Cash Return
3.8%
Cap rate
0.6%
Rent to Value Ratio

Active
$134,900
2
bds
|
2
ba
|
1,081
sqft
|
built
1941
715 W Holmes Rd, Lansing, MI 48910
$-158
Cash flow
-6.1%
Cash-on-Cash Return
4.7%
Cap rate
0.9%
Rent to Value Ratio
Active
$250,000
3
bds
|
2
ba
|
1,552
sqft
|
built
1991
2354 Sower Blvd, Okemos, MI 48864
$-526
Cash flow
-11.0%
Cash-on-Cash Return
3.6%
Cap rate
0.8%
Rent to Value Ratio
Active
$122,500
3
bds
|
1
ba
|
933
sqft
|
built
1955
4935 Delray Dr, Lansing, MI 48910
$19
Cash flow
0.8%
Cash-on-Cash Return
6.3%
Cap rate
1.0%
Rent to Value Ratio