Jackson County Investment Properties for Sale
Browse homes for sale and investment properties in Jackson County. Refine your search by price, property type, or more.
Best cash flowing properties in Jackson County
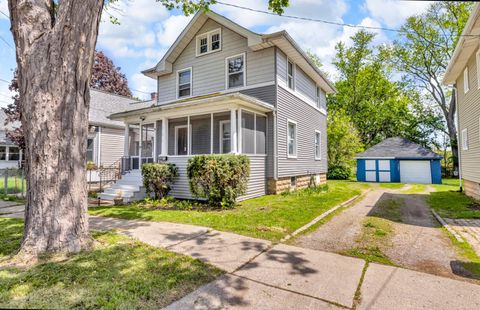
Active
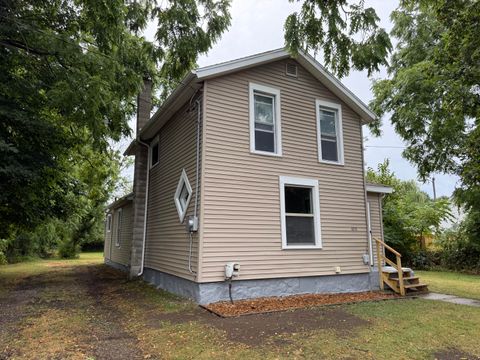
$65,000
3
bds
|
1
ba
|
1,066
sqft
|
built
1920
337 E Addison St, Jackson, MI 49203
$733
Cash flow
13.1%
Cash-on-Cash Return
13.5%
Cap rate
2.2%
Rent to Value Ratio
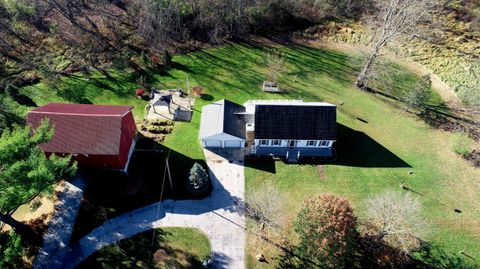
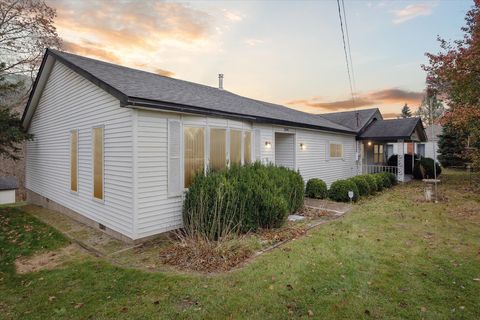
Active
$77,500
4
bds
|
2
ba
|
2,393
sqft
|
built
1890
328 W Mason St, Jackson, MI 49203
$578
Cash flow
38.9%
Cash-on-Cash Return
15.1%
Cap rate
2.1%
Rent to Value Ratio
74 out of 274 properties for sale in Jackson County
Limited Results Shown
Create a free account, or log in to reveal all property listings and enjoy the complete experience.
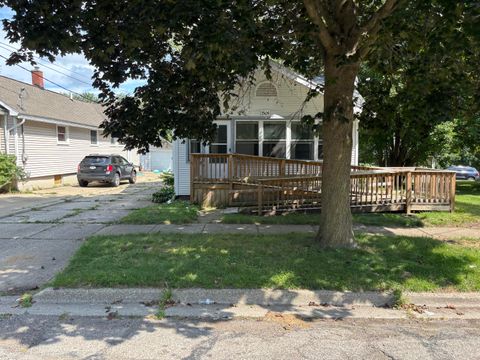
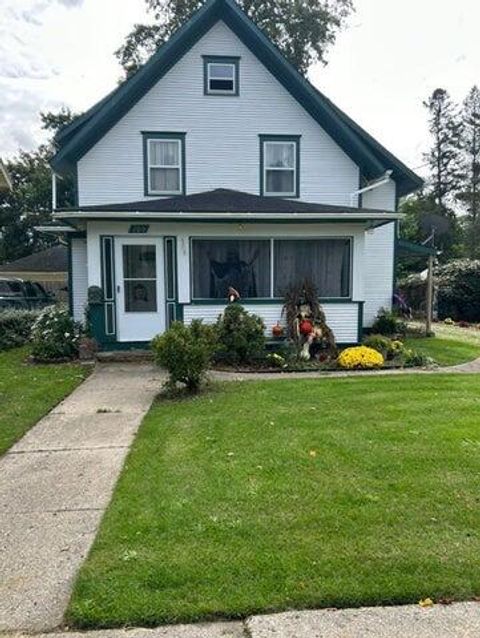
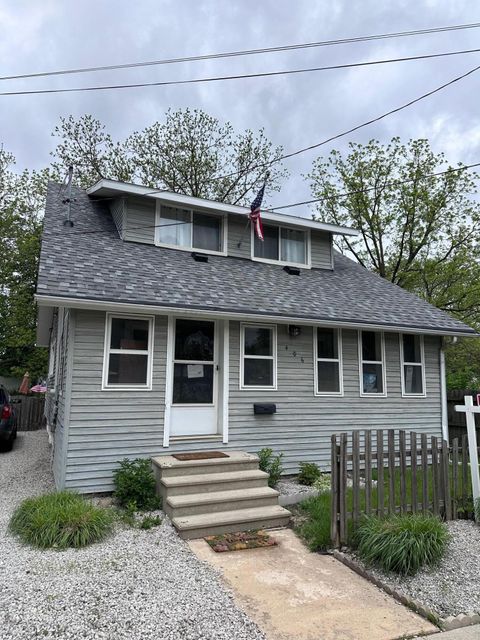
Active
$119,900
2
bds
|
1
ba
|
886
sqft
|
built
1920
1309 Woodbridge St, Jackson, MI 49203
$139
Cash flow
6.0%
Cash-on-Cash Return
7.5%
Cap rate
1.0%
Rent to Value Ratio
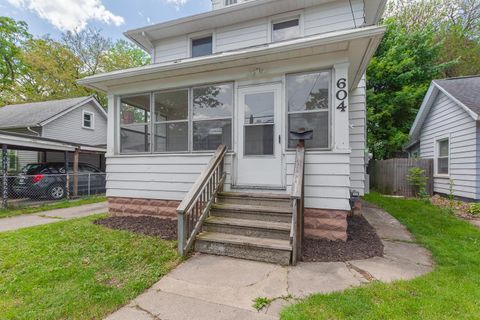
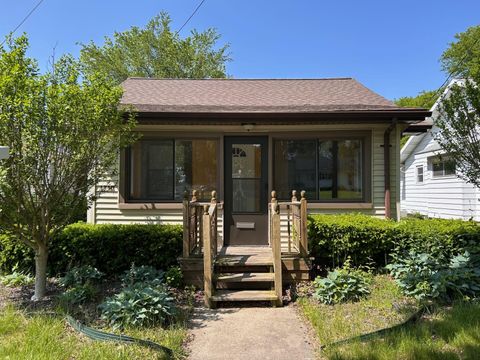
Active
$129,900
4
bds
|
2
ba
|
1,435
sqft
|
built
1914
604 Edgewood St, Jackson, MI 49202
$-14
Cash flow
-0.6%
Cash-on-Cash Return
6.0%
Cap rate
1.1%
Rent to Value Ratio

Active
$189,999
bds
|
0
ba
|
0
sqft
|
built
1923
1000 S West Ave, Jackson, MI 49203
$15
Cash flow
0.4%
Cash-on-Cash Return
6.2%
Cap rate
0.9%
Rent to Value Ratio
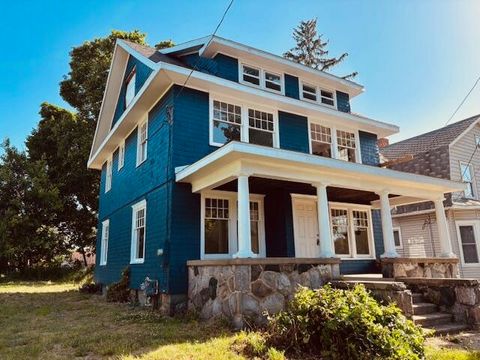
Active
$145,000
3
bds
|
1
ba
|
1,502
sqft
|
built
1886
1015 N Blackstone St, Jackson, MI 49202
$113
Cash flow
4.1%
Cash-on-Cash Return
7.1%
Cap rate
1.0%
Rent to Value Ratio
Active
$350,000
4
bds
|
3
ba
|
2,134
sqft
|
built
1992
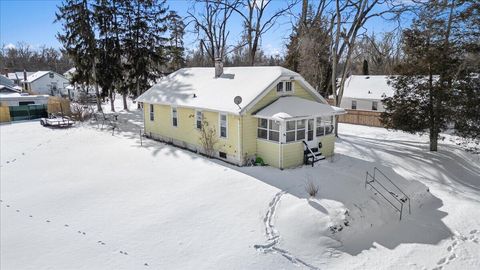
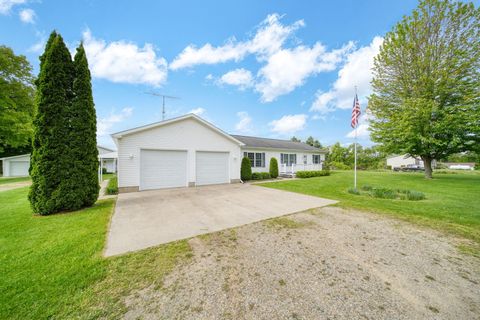
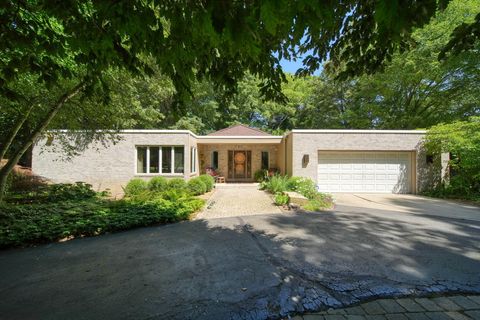
4175 Springport Rd, Jackson, MI 49201
$-166
Cash flow
-2.5%
Cash-on-Cash Return
5.6%
Cap rate
0.7%
Rent to Value Ratio

Active
$134,900
3
bds
|
1
ba
|
1,532
sqft
|
built
1928
804 17th St, Jackson, MI 49203
$131
Cash flow
5.1%
Cash-on-Cash Return
7.3%
Cap rate
1.0%
Rent to Value Ratio
Active
$164,900
3
bds
|
1
ba
|
1,152
sqft
|
built
1910
709 Griswold St, Jackson, MI 49203
$124
Cash flow
3.9%
Cash-on-Cash Return
7.1%
Cap rate
1.0%
Rent to Value Ratio
Active
$127,400
2
bds
|
1
ba
|
918
sqft
|
built
1925
1110 E North St, Jackson, MI 49202
$181
Cash flow
7.4%
Cash-on-Cash Return
7.9%
Cap rate
1.1%
Rent to Value Ratio
Active
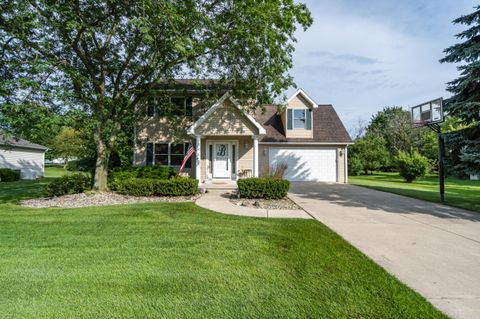
$344,900
3
bds
|
2
ba
|
1,633
sqft
|
built
2003
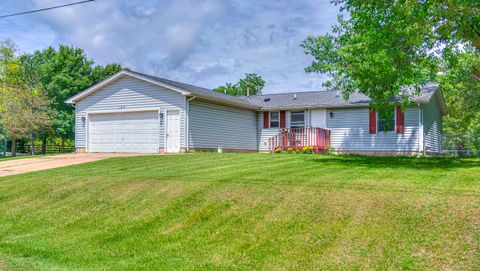
10639 Hanover Rd, Hanover, MI 49241
$0
Cash flow
n/a
Cash-on-Cash Return
n/a
Cap rate
n/a
Rent to Value Ratio
Active
$339,000
4
bds
|
3
ba
|
2,394
sqft
|
built
2003
106 Nicole Dr, Brooklyn, MI 49230
$-747
Cash flow
-11.5%
Cash-on-Cash Return
3.5%
Cap rate
0.6%
Rent to Value Ratio

Active
$269,000
2
bds
|
2
ba
|
1,988
sqft
|
built
1965
173 Mohawk St, Jackson, MI 49203
$-148
Cash flow
-2.9%
Cash-on-Cash Return
5.5%
Cap rate
0.7%
Rent to Value Ratio
Active
$121,900
3
bds
|
2
ba
|
1,292
sqft
|
built
1900
1717 Carl Breeding Way, Jackson, MI 49203
$138
Cash flow
5.9%
Cash-on-Cash Return
7.5%
Cap rate
1.1%
Rent to Value Ratio
Active
$194,000
3
bds
|
1
ba
|
1,908
sqft
|
built
1965
6015 S Stony Lake Rd, Jackson, MI 49201
$110
Cash flow
3.0%
Cash-on-Cash Return
6.8%
Cap rate
0.9%
Rent to Value Ratio
Active
$475,000
4
bds
|
5
ba
|
3,589
sqft
|
built
1972
1360 Kathmar Dr, Jackson, MI 49203
$-1,162
Cash flow
-12.8%
Cash-on-Cash Return
3.2%
Cap rate
0.6%
Rent to Value Ratio
Active
$245,000
3
bds
|
2
ba
|
2,311
sqft
|
built
1960
5695 Hinkley Rd, Stockbridge, MI 49285
$-65
Cash flow
-1.4%
Cash-on-Cash Return
5.8%
Cap rate
0.8%
Rent to Value Ratio
Active
$125,900
3
bds
|
1
ba
|
1,144
sqft
|
built
1914
327 Carr St, Jackson, MI 49201
$143
Cash flow
5.9%
Cash-on-Cash Return
7.5%
Cap rate
1.1%
Rent to Value Ratio

Active
$375,000
4
bds
|
3
ba
|
3,279
sqft
|
built
1970
5345 Squires Manor Rd, Jackson, MI 49201
$-420
Cash flow
-5.8%
Cash-on-Cash Return
4.8%
Cap rate
0.7%
Rent to Value Ratio
Active
$159,000
3
bds
|
2
ba
|
1,296
sqft
|
built
1920
406 S Elm Ave, Jackson, MI 49203
$70
Cash flow
2.3%
Cash-on-Cash Return
6.7%
Cap rate
0.9%
Rent to Value Ratio

Active
$1,195,000
4
bds
|
8
ba
|
7,643
sqft
|
built
1997
6076 Browns Lake Rd, Jackson, MI 49203
$-3,854
Cash flow
-16.8%
Cash-on-Cash Return
2.3%
Cap rate
0.4%
Rent to Value Ratio
Active
$315,000
3
bds
|
1
ba
|
1,758
sqft
|
built
1835
120 Michigan St, Brooklyn, MI 49230
$-359
Cash flow
-5.9%
Cash-on-Cash Return
4.8%
Cap rate
0.6%
Rent to Value Ratio
Active
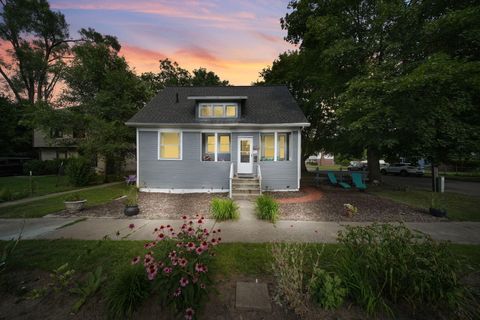
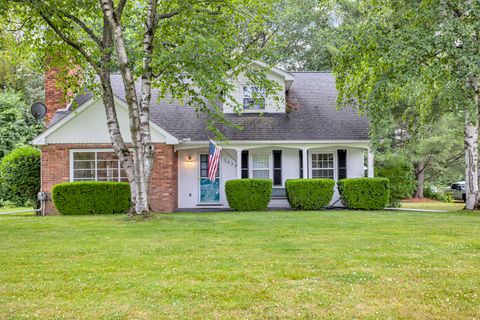
$149,900
2
bds
|
1
ba
|
1,312
sqft
|
built
1865
123 Fairview St, Hanover, MI 49241
$211
Cash flow
7.3%
Cash-on-Cash Return
7.8%
Cap rate
1.1%
Rent to Value Ratio
Active
$169,000
3
bds
|
2
ba
|
2,288
sqft
|
built
1928
116 E Prospect St, Jackson, MI 49203
$-215
Cash flow
-6.6%
Cash-on-Cash Return
4.6%
Cap rate
0.7%
Rent to Value Ratio
Active
$449,900
4
bds
|
2
ba
|
3,536
sqft
|
built
1981
12900 Kalmbach Rd, Grass Lake, MI 49240
$-946
Cash flow
-11.0%
Cash-on-Cash Return
3.6%
Cap rate
0.6%
Rent to Value Ratio
Active
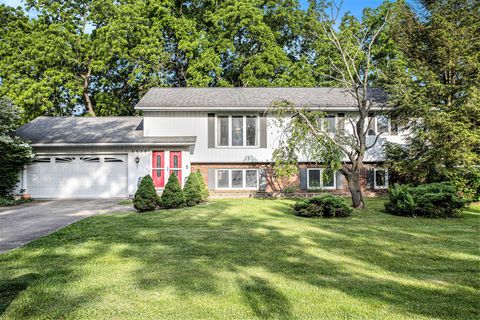
$279,000
4
bds
|
2
ba
|
2,200
sqft
|
built
1992
123 Carlysle Dr, Brooklyn, MI 49230
$-569
Cash flow
-10.6%
Cash-on-Cash Return
3.7%
Cap rate
0.6%
Rent to Value Ratio
Active
$295,000
4
bds
|
2
ba
|
2,542
sqft
|
built
1960
3432 Loretta Ave, Jackson, MI 49201
$-463
Cash flow
-8.2%
Cash-on-Cash Return
4.3%
Cap rate
0.6%
Rent to Value Ratio
Active
$295,000
5
bds
|
3
ba
|
2,576
sqft
|
built
1974
6958 Paddock Ln, Jackson, MI 49201
$-490
Cash flow
-8.7%
Cash-on-Cash Return
4.2%
Cap rate
0.7%
Rent to Value Ratio
Active
$274,900
3
bds
|
2
ba
|
1,680
sqft
|
built
1989
11261 North Dr, Brooklyn, MI 49230
$-209
Cash flow
-4.0%
Cash-on-Cash Return
5.2%
Cap rate
0.7%
Rent to Value Ratio

Active
$210,000
2
bds
|
2
ba
|
1,120
sqft
|
built
2006
1955 Coventry Rd, Jackson, MI 49201
$-622
Cash flow
-15.5%
Cash-on-Cash Return
2.6%
Cap rate
0.7%
Rent to Value Ratio

Active
$369,000
3
bds
|
2
ba
|
1,344
sqft
|
built
1939
114 W Grove Ave, Michigan Center, MI 49254
$-786
Cash flow
-11.1%
Cash-on-Cash Return
3.6%
Cap rate
0.4%
Rent to Value Ratio

Active
$875,000
4
bds
|
3
ba
|
4,008
sqft
|
built
2016
295 W Shore Dr, Jerome, MI 49249
$-3,745
Cash flow
-22.3%
Cash-on-Cash Return
1.0%
Cap rate
0.2%
Rent to Value Ratio
Active
$499,900
3
bds
|
3
ba
|
2,458
sqft
|
built
1991
490 Skyline Dr, Horton, MI 49246
$-1,426
Cash flow
-14.9%
Cash-on-Cash Return
2.7%
Cap rate
0.4%
Rent to Value Ratio

Active
$140,000
3
bds
|
1
ba
|
1,264
sqft
|
built
1948
807 Winifred St, Jackson, MI 49202
$117
Cash flow
4.4%
Cash-on-Cash Return
7.1%
Cap rate
1.0%
Rent to Value Ratio

Active
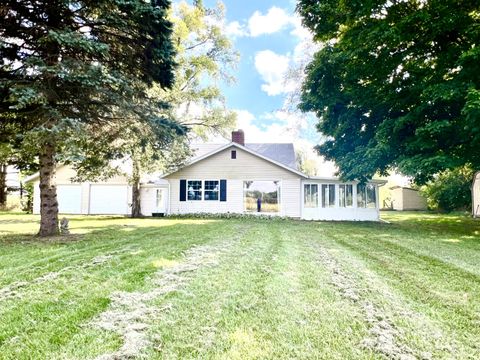
$475,000
3
bds
|
2
ba
|
1,900
sqft
|
built
1900
6750 County Farm Rd, Jackson, MI 49201
$-1,045
Cash flow
-11.5%
Cash-on-Cash Return
3.5%
Cap rate
0.5%
Rent to Value Ratio
Active
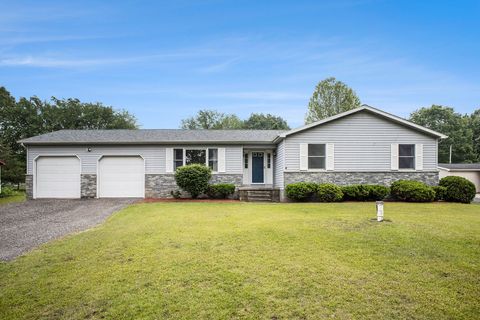
$285,000
3
bds
|
1
ba
|
1,401
sqft
|
built
1950
37 Indian Trl, Munith, MI 49259
$-349
Cash flow
-6.4%
Cash-on-Cash Return
4.7%
Cap rate
0.7%
Rent to Value Ratio

Active
$159,900
2
bds
|
1
ba
|
912
sqft
|
built
1954
311 Rosehill Rd, Jackson, MI 49202
$-10
Cash flow
-0.3%
Cash-on-Cash Return
6.1%
Cap rate
0.9%
Rent to Value Ratio

Active
$194,000
2
bds
|
2
ba
|
1,120
sqft
|
built
2003
920 Oak Brook Dr, Jackson, MI 49203
$-342
Cash flow
-9.2%
Cash-on-Cash Return
4.0%
Cap rate
0.8%
Rent to Value Ratio
Active
$544,900
5
bds
|
3
ba
|
3,998
sqft
|
built
1998
1750 Fox Rd, Jackson, MI 49201
$-1,436
Cash flow
-13.7%
Cash-on-Cash Return
3.0%
Cap rate
0.5%
Rent to Value Ratio

Active
$120,000
2
bds
|
1
ba
|
732
sqft
|
built
1910
130 N Horton St, Jackson, MI 49202
$158
Cash flow
6.9%
Cash-on-Cash Return
7.7%
Cap rate
1.0%
Rent to Value Ratio