Kent County Investment Properties for Sale
Browse homes for sale and investment properties in Kent County. Refine your search by price, property type, or more.
Best cash flowing properties in Kent County
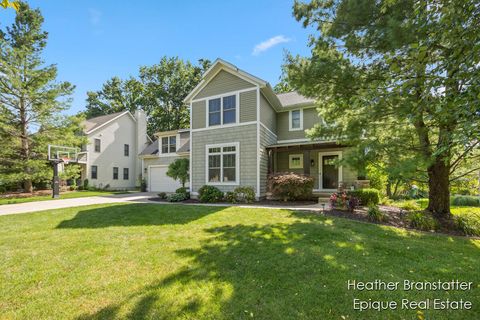
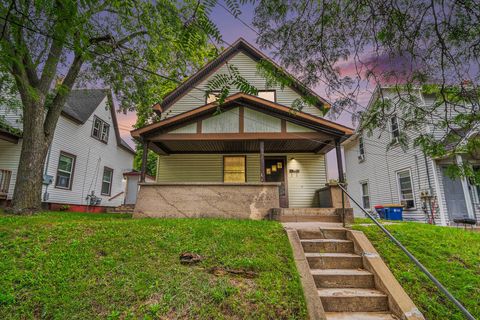
Active
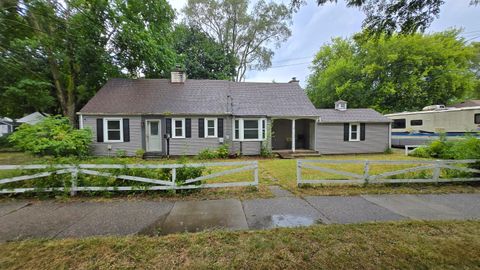
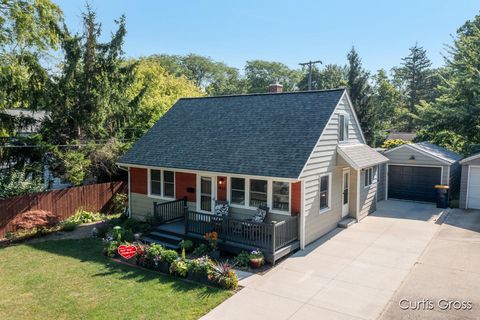
$219,900
4
bds
|
2
ba
|
1,750
sqft
|
built
1940
1339 Fuller Ave NE, Grand Rapids, MI 49505
$256
Cash flow
6.1%
Cash-on-Cash Return
7.5%
Cap rate
1.0%
Rent to Value Ratio
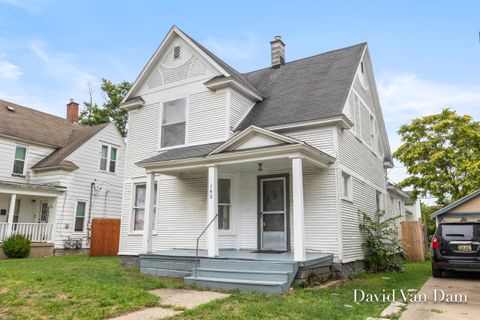
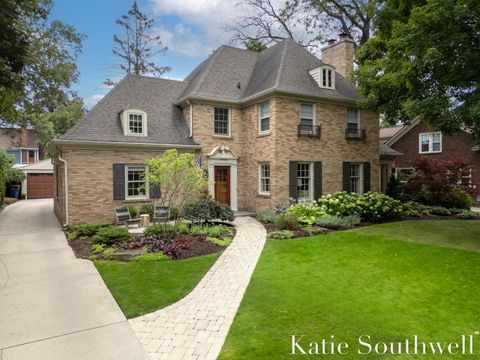
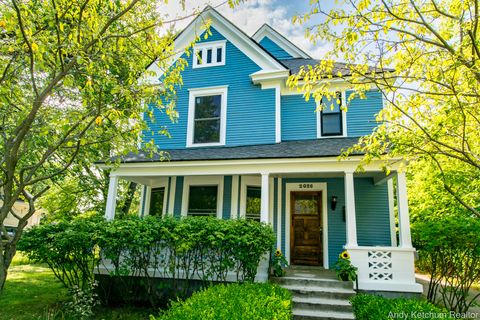
Active
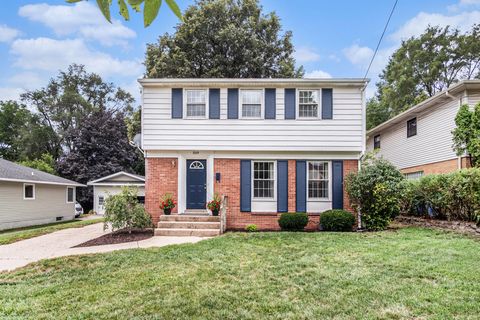
$199,900
4
bds
|
1
ba
|
1,462
sqft
|
built
1895
140 Stewart St SW, Grand Rapids, MI 49507
$101
Cash flow
2.6%
Cash-on-Cash Return
6.8%
Cap rate
0.9%
Rent to Value Ratio
571 out of 640 properties for sale in Kent County
Limited Results Shown
Create a free account, or log in to reveal all property listings and enjoy the complete experience.
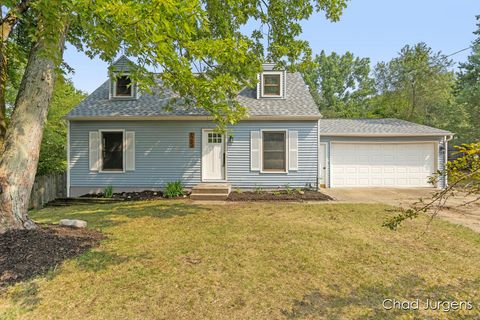
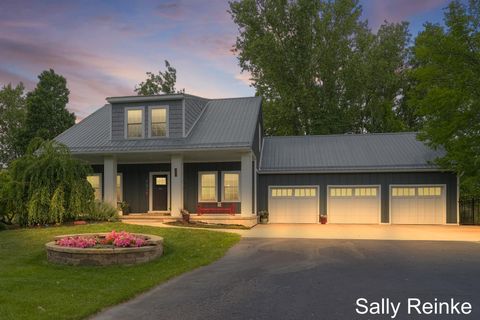
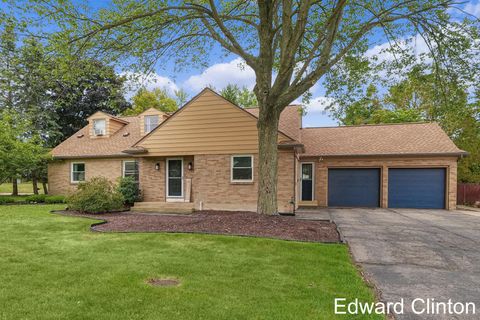
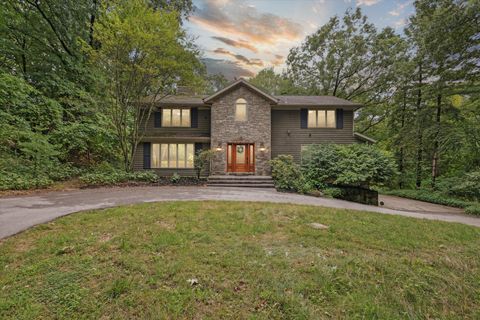
Active
$344,900
4
bds
|
2
ba
|
2,040
sqft
|
built
1971
1702 Woodgate Dr SE, Lowell, MI 49331
$-416
Cash flow
-6.3%
Cash-on-Cash Return
4.7%
Cap rate
0.7%
Rent to Value Ratio
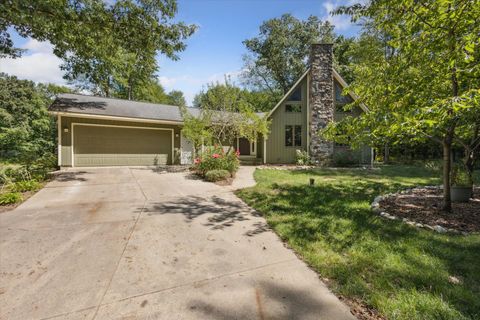
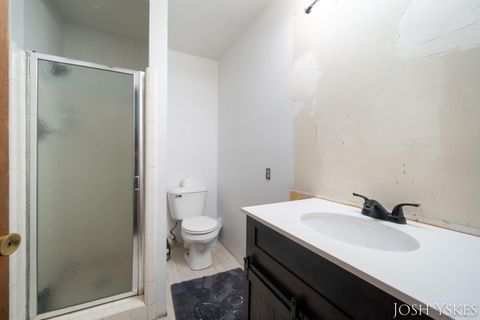
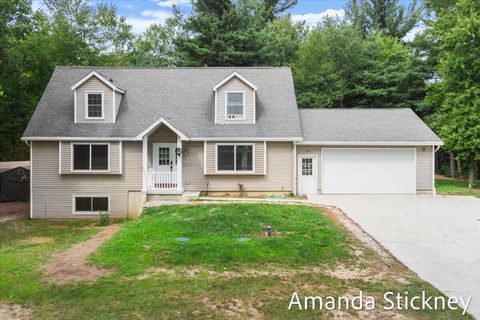
Active
$650,000
4
bds
|
3
ba
|
2,081
sqft
|
built
1986
6130 Ramsdell Dr NE, Rockford, MI 49341
$-1,774
Cash flow
-14.2%
Cash-on-Cash Return
2.9%
Cap rate
0.5%
Rent to Value Ratio
Active
$839,000
5
bds
|
4
ba
|
3,528
sqft
|
built
2005
4936 W Village Trl SE, Ada, MI 49301
$-2,576
Cash flow
-16.0%
Cash-on-Cash Return
2.5%
Cap rate
0.4%
Rent to Value Ratio
Active
$1,585,000
4
bds
|
4
ba
|
3,672
sqft
|
built
1929
958 Pinecrest Ave SE, Grand Rapids, MI 49506
$-6,602
Cash flow
-21.7%
Cash-on-Cash Return
1.1%
Cap rate
0.3%
Rent to Value Ratio
Active
$950,000
5
bds
|
7
ba
|
4,432
sqft
|
built
2017
303 Broman St, Sparta, MI 49345
$-2,563
Cash flow
-14.1%
Cash-on-Cash Return
2.9%
Cap rate
0.5%
Rent to Value Ratio
Active
$600,000
5
bds
|
4
ba
|
2,749
sqft
|
built
1940
5855 Grand River Dr NE, Ada, MI 49301
$-1,625
Cash flow
-14.1%
Cash-on-Cash Return
2.9%
Cap rate
0.5%
Rent to Value Ratio

Active
$650,000
4
bds
|
3
ba
|
2,659
sqft
|
built
2000
8905 Conservancy Dr NE, Ada, MI 49301
$-1,767
Cash flow
-14.2%
Cash-on-Cash Return
2.9%
Cap rate
0.5%
Rent to Value Ratio
Active
$475,000
5
bds
|
4
ba
|
3,737
sqft
|
built
1954
2024 7th St NW, Grand Rapids, MI 49504
$-871
Cash flow
-9.6%
Cash-on-Cash Return
3.9%
Cap rate
0.6%
Rent to Value Ratio

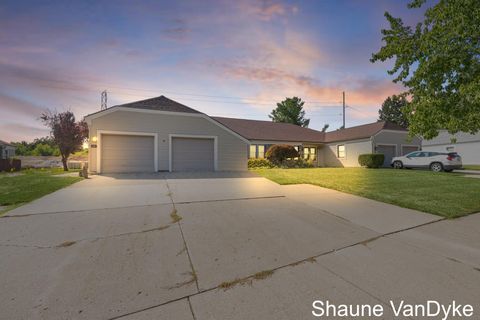
Active
$374,900
4
bds
|
2
ba
|
1,963
sqft
|
built
1988
4926 Farmview Ln SE, Kentwood, MI 49508
$-409
Cash flow
-5.7%
Cash-on-Cash Return
4.8%
Cap rate
0.7%
Rent to Value Ratio
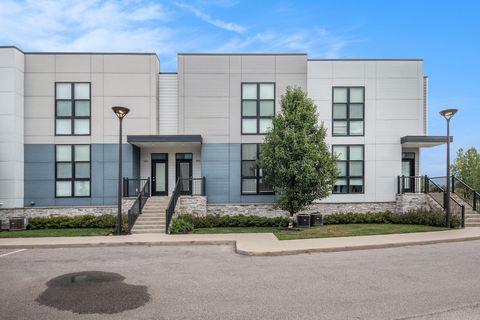
Active
$324,900
3
bds
|
3
ba
|
1,542
sqft
|
built
2020
6028 Port View Dr SE, Grand Rapids, MI 49512
$-623
Cash flow
-10.0%
Cash-on-Cash Return
3.8%
Cap rate
0.8%
Rent to Value Ratio

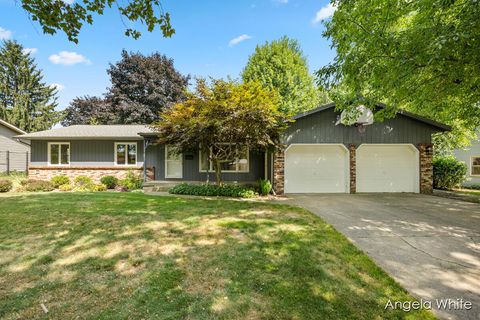
Active
$425,000
3
bds
|
2
ba
|
2,904
sqft
|
built
1976
4847 Ridgeline Dr NE, Grand Rapids, MI 49525
$-819
Cash flow
-10.1%
Cash-on-Cash Return
3.8%
Cap rate
0.6%
Rent to Value Ratio
Active
$235,000
1
bds
|
2
ba
|
980
sqft
|
built
1984
331 Rolling Greene Dr NW, Grand Rapids, MI 49534
$-788
Cash flow
-17.5%
Cash-on-Cash Return
2.1%
Cap rate
0.6%
Rent to Value Ratio
Active
$209,900
3
bds
|
2
ba
|
1,155
sqft
|
built
1910
937 Humbolt St SE, Grand Rapids, MI 49507
$75
Cash flow
1.9%
Cash-on-Cash Return
6.6%
Cap rate
0.9%
Rent to Value Ratio
Active
$1,150,000
4
bds
|
5
ba
|
3,716
sqft
|
built
1979
8300 Grand River Dr SE, Ada, MI 49301
$-4,700
Cash flow
-21.3%
Cash-on-Cash Return
1.2%
Cap rate
0.2%
Rent to Value Ratio

Active
$349,900
3
bds
|
2
ba
|
1,022
sqft
|
built
1900
656 Gladstone Dr SE, Grand Rapids, MI 49506
$-677
Cash flow
-10.1%
Cash-on-Cash Return
3.8%
Cap rate
0.6%
Rent to Value Ratio
Active
$224,900
5
bds
|
0
ba
|
0
sqft
|
built
1922
26 Hall St SW, Grand Rapids, MI 49507
$-144
Cash flow
-3.3%
Cash-on-Cash Return
5.4%
Cap rate
0.8%
Rent to Value Ratio
Active
$769,000
4
bds
|
5
ba
|
4,000
sqft
|
built
2005
5189 Bonasa Dr NE, Rockford, MI 49341
$-2,184
Cash flow
-14.8%
Cash-on-Cash Return
2.7%
Cap rate
0.5%
Rent to Value Ratio

Active
$319,900
3
bds
|
2
ba
|
1,685
sqft
|
built
1925
1248 Fisk Rd SE, Grand Rapids, MI 49506
$-289
Cash flow
-4.7%
Cash-on-Cash Return
5.1%
Cap rate
0.8%
Rent to Value Ratio
Active
$349,900
3
bds
|
1
ba
|
1,241
sqft
|
built
1951
1813 Kreiser St SE, Grand Rapids, MI 49506
$-413
Cash flow
-6.2%
Cash-on-Cash Return
4.7%
Cap rate
0.7%
Rent to Value Ratio

Active
$950,000
4
bds
|
4
ba
|
3,589
sqft
|
built
1915
415 Prospect Ave SE, Grand Rapids, MI 49503
$-3,600
Cash flow
-19.8%
Cash-on-Cash Return
1.6%
Cap rate
0.3%
Rent to Value Ratio

Active
$775,000
4
bds
|
3
ba
|
2,693
sqft
|
built
2015
4307 Maybeck Dr NE, Grand Rapids, MI 49525
$-3,218
Cash flow
-21.7%
Cash-on-Cash Return
1.2%
Cap rate
0.4%
Rent to Value Ratio
Active
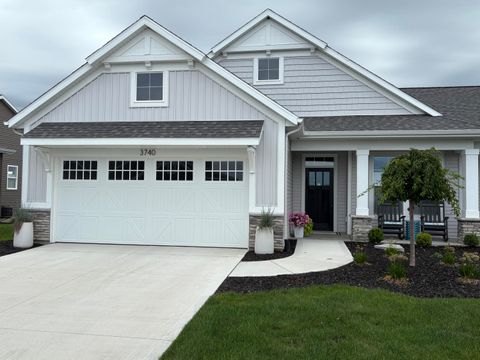
$484,900
3
bds
|
3
ba
|
2,164
sqft
|
built
2024
3740 Leenheer Dr, Grandville, MI 49418
$-1,483
Cash flow
-16.0%
Cash-on-Cash Return
2.5%
Cap rate
0.5%
Rent to Value Ratio
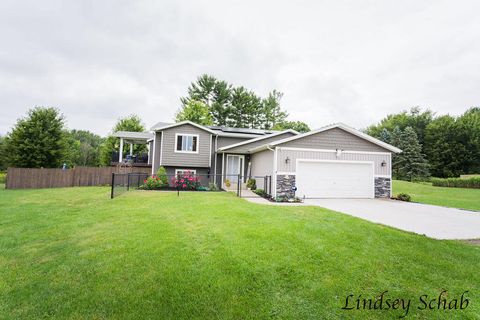
Active
$475,000
4
bds
|
3
ba
|
2,300
sqft
|
built
1995
15333 Cedar Springs Ave, Cedar Springs, MI 49319
$-938
Cash flow
-10.3%
Cash-on-Cash Return
3.8%
Cap rate
0.6%
Rent to Value Ratio
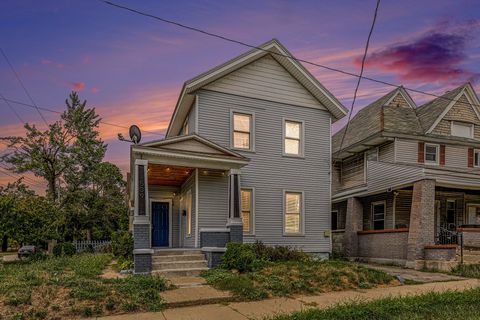
Active
$219,000
bds
|
0
ba
|
0
sqft
|
built
1890
539 Pine Ave NW, Grand Rapids, MI 49504
$-103
Cash flow
-2.5%
Cash-on-Cash Return
5.6%
Cap rate
0.9%
Rent to Value Ratio
Active
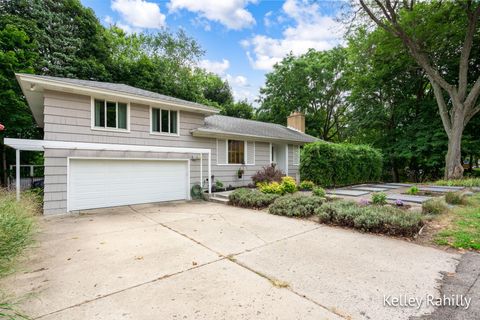
$449,900
4
bds
|
3
ba
|
2,912
sqft
|
built
1951
1440 Holborn Dr NW, Grand Rapids, MI 49504
$-619
Cash flow
-7.2%
Cash-on-Cash Return
4.5%
Cap rate
0.7%
Rent to Value Ratio
Active
$385,000
3
bds
|
1
ba
|
1,493
sqft
|
built
1950
1432 Eastlawn Rd SE, East Grand Rapids, MI 49506
$-559
Cash flow
-7.6%
Cash-on-Cash Return
4.4%
Cap rate
0.6%
Rent to Value Ratio

Active
$699,900
4
bds
|
3
ba
|
2,916
sqft
|
built
1958
1753 Breton Rd SE, East Grand Rapids, MI 49506
$-1,734
Cash flow
-12.9%
Cash-on-Cash Return
3.2%
Cap rate
0.6%
Rent to Value Ratio
Active
$329,000
3
bds
|
2
ba
|
1,836
sqft
|
built
1960
509 Tuttle Ave NE, Grand Rapids, MI 49503
$-167
Cash flow
-2.6%
Cash-on-Cash Return
5.5%
Cap rate
0.8%
Rent to Value Ratio
Active
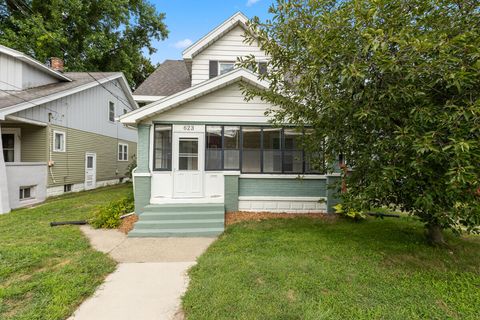
$250,000
3
bds
|
2
ba
|
1,296
sqft
|
built
1922
623 Diamond Ave NE, Grand Rapids, MI 49503
$-55
Cash flow
-1.1%
Cash-on-Cash Return
5.9%
Cap rate
0.8%
Rent to Value Ratio

Active
$495,000
4
bds
|
3
ba
|
2,484
sqft
|
built
1972
6565 Tanglewood Dr SE, Grand Rapids, MI 49546
$-921
Cash flow
-9.7%
Cash-on-Cash Return
3.9%
Cap rate
0.6%
Rent to Value Ratio

Active
$299,900
3
bds
|
2
ba
|
1,005
sqft
|
built
1948
2958 Dean Lake Ave NE, Grand Rapids, MI 49525
$-305
Cash flow
-5.3%
Cash-on-Cash Return
4.9%
Cap rate
0.7%
Rent to Value Ratio
Active
$250,000
3
bds
|
2
ba
|
1,602
sqft
|
built
1971
250 Jean St SW, Wyoming, MI 49548
$-89
Cash flow
-1.9%
Cash-on-Cash Return
5.7%
Cap rate
0.8%
Rent to Value Ratio
Active
$739,500
5
bds
|
4
ba
|
4,737
sqft
|
built
1988
3530 Wild Rose Ln NE, Grand Rapids, MI 49525
$-1,433
Cash flow
-10.1%
Cash-on-Cash Return
3.8%
Cap rate
0.6%
Rent to Value Ratio
Active
$290,000
5
bds
|
2
ba
|
2,210
sqft
|
built
1900
2025 Francis Ave SE, Grand Rapids, MI 49507
$-189
Cash flow
-3.4%
Cash-on-Cash Return
5.4%
Cap rate
0.8%
Rent to Value Ratio

Active
$175,000
1
bds
|
1
ba
|
628
sqft
|
built
1930
4811 Walton Ave SW, Wyoming, MI 49548
$-64
Cash flow
-1.9%
Cash-on-Cash Return
5.7%
Cap rate
0.8%
Rent to Value Ratio

Active
$399,900
3
bds
|
2
ba
|
1,329
sqft
|
built
1953
6667 W River Rd NE, Belmont, MI 49306
$-408
Cash flow
-5.3%
Cash-on-Cash Return
4.9%
Cap rate
0.7%
Rent to Value Ratio
Active
$430,000
3
bds
|
2
ba
|
2,136
sqft
|
built
1994
1345 Fonger St NE, Sparta, MI 49345
$-788
Cash flow
-9.6%
Cash-on-Cash Return
3.9%
Cap rate
0.6%
Rent to Value Ratio
Active
$349,900
3
bds
|
3
ba
|
2,802
sqft
|
built
1970
130 Centennial Ave NW, Grand Rapids, MI 49504
$-549
Cash flow
-8.2%
Cash-on-Cash Return
4.3%
Cap rate
0.6%
Rent to Value Ratio